Session
import tensorflow as tf

m1 = tf.constant([[2, 2]])
m2 = tf.constant([[3],
                  [3]])
dot_operation = tf.matmul(m1, m2)

print(dot_operation)  # wrong! no result

# method1 use session
sess = tf.Session()
result = sess.run(dot_operation)
print(result)
sess.close()

# method2 use session
with tf.Session() as sess:
    result_ = sess.run(dot_operation)
    print(result_)

'''
运行结果:
Tensor("MatMul:0", shape=(1, 1), dtype=int32)
[[12]]
[[12]]
'''
Placeholder
import tensorflow as tf

x1 = tf.placeholder(dtype=tf.float32, shape=None)
y1 = tf.placeholder(dtype=tf.float32, shape=None)
z1 = x1 + y1

x2 = tf.placeholder(dtype=tf.float32, shape=[2, 1])
y2 = tf.placeholder(dtype=tf.float32, shape=[1, 2])
z2 = tf.matmul(x2, y2)

with tf.Session() as sess:
    # when only one operation to run
    z1_value = sess.run(z1, feed_dict={x1: 1, y1: 2})

    # when run multiple operations
    z1_value, z2_value = sess.run(
        [z1, z2],       # run them together
        feed_dict={
            x1: 1, y1: 2,
            x2: [[2], [2]], y2: [[3, 3]]
        })
    print(z1_value)
    print(z2_value)


'''
运行结果:
3.0
[[6. 6.]
 [6. 6.]]
'''
Variable
import tensorflow as tf

var = tf.Variable(0)    # our first variable in the "global_variable" set

add_operation = tf.add(var, 1)
update_operation = tf.assign(var, add_operation)

with tf.Session() as sess:
    # once define variables, you have to initialize them by doing this
    sess.run(tf.global_variables_initializer())
    for _ in range(3):
        sess.run(update_operation)
        print(sess.run(var))


'''
运行的结果:
1
2
3
'''
'''
如果把print(sess.run(var))改为print(sess.run(update_operation))
那么运行结果是:
2
4
6
'''
Activation
# -*-Coding: UTF-8 -*-

'''
Linear to Nonlinear
'''


import tensorflow as tf
import numpy as np
import matplotlib.pyplot as plt

# fake data
x = np.linspace(-5, 5, 200)     # x data, shape=(100, 1)

'''
linspace
函数:
numpy.linspace(start,stop,num=50,endpoint=True,retstep=False,dtype=None)
参数:
start:scalar类型(个人理解是标量的意思,这不是一个具体的数据类型,而是指某一些数据类型,比如int,float,bool,long,str等等都属于sclar类型)。这个数参数表示这个序列的开始值。
stop:scalar类型。如果endpoint=True。那么stop就是序列的终止数值。当endpoint=False时,返回值中不包含最后一个端点,并且步长会改变。
num:int型,可选参数,默认值为50。表示要生成的样本数,必须是非负值。
endpoint:bool类型。可选参数,默认值为True,这时stop就是最后的样本。为False时,不包含stop的值。
retstep:bool类型。可选参数,默认值为True,这时返回值是(samples,step),前面的是数组,后面是步长。
dtype:表示输出的数组的数据类型,如果没有给出就从其他输入中推断输出的类型
返回值:
samples:ndarray类型。在[start,stop]闭区间,或者[start,stop)半闭合区间中,数量为num,步长相等的样本。至于包不包含stop取决于endpoint参数的取值。
step:float类型。可选。只有restep参数取值为True时才会返回这个返回值,表示样本中步长。
参考:https://blog.csdn.net/rainpasttime/article/details/79847674
'''

# following are popular activation functions
y_relu = tf.nn.relu(x)
y_sigmoid = tf.nn.sigmoid(x)
y_tanh = tf.nn.tanh(x)
y_softplus = tf.nn.softplus(x)
# y_softmax = tf.nn.softmax(x)  softmax is a special kind of activation function, it is about probability

sess = tf.Session()
y_relu, y_sigmoid, y_tanh, y_softplus = sess.run([y_relu, y_sigmoid, y_tanh, y_softplus])

# plt to visualize these activation function
plt.figure(1, figsize=(8, 6))#返回一个窗口框,大小是宽度为8英寸和高度为6英寸
plt.subplot(221)    #左上角小窗口
plt.plot(x, y_relu, c='red', label='relu')
plt.ylim((-1, 5))
plt.legend(loc='best') #设置图例位置

plt.subplot(222)
plt.plot(x, y_sigmoid, c='red', label='sigmoid')
plt.ylim((-0.2, 1.2))
plt.legend(loc='best')

plt.subplot(223)
plt.plot(x, y_tanh, c='red', label='tanh')
plt.ylim((-1.2, 1.2))
plt.legend(loc='best')

plt.subplot(224)
plt.plot(x, y_softplus, c='red', label='softplus')
plt.ylim((-0.2, 6))
plt.legend(loc='best')

plt.show()
Activation效果图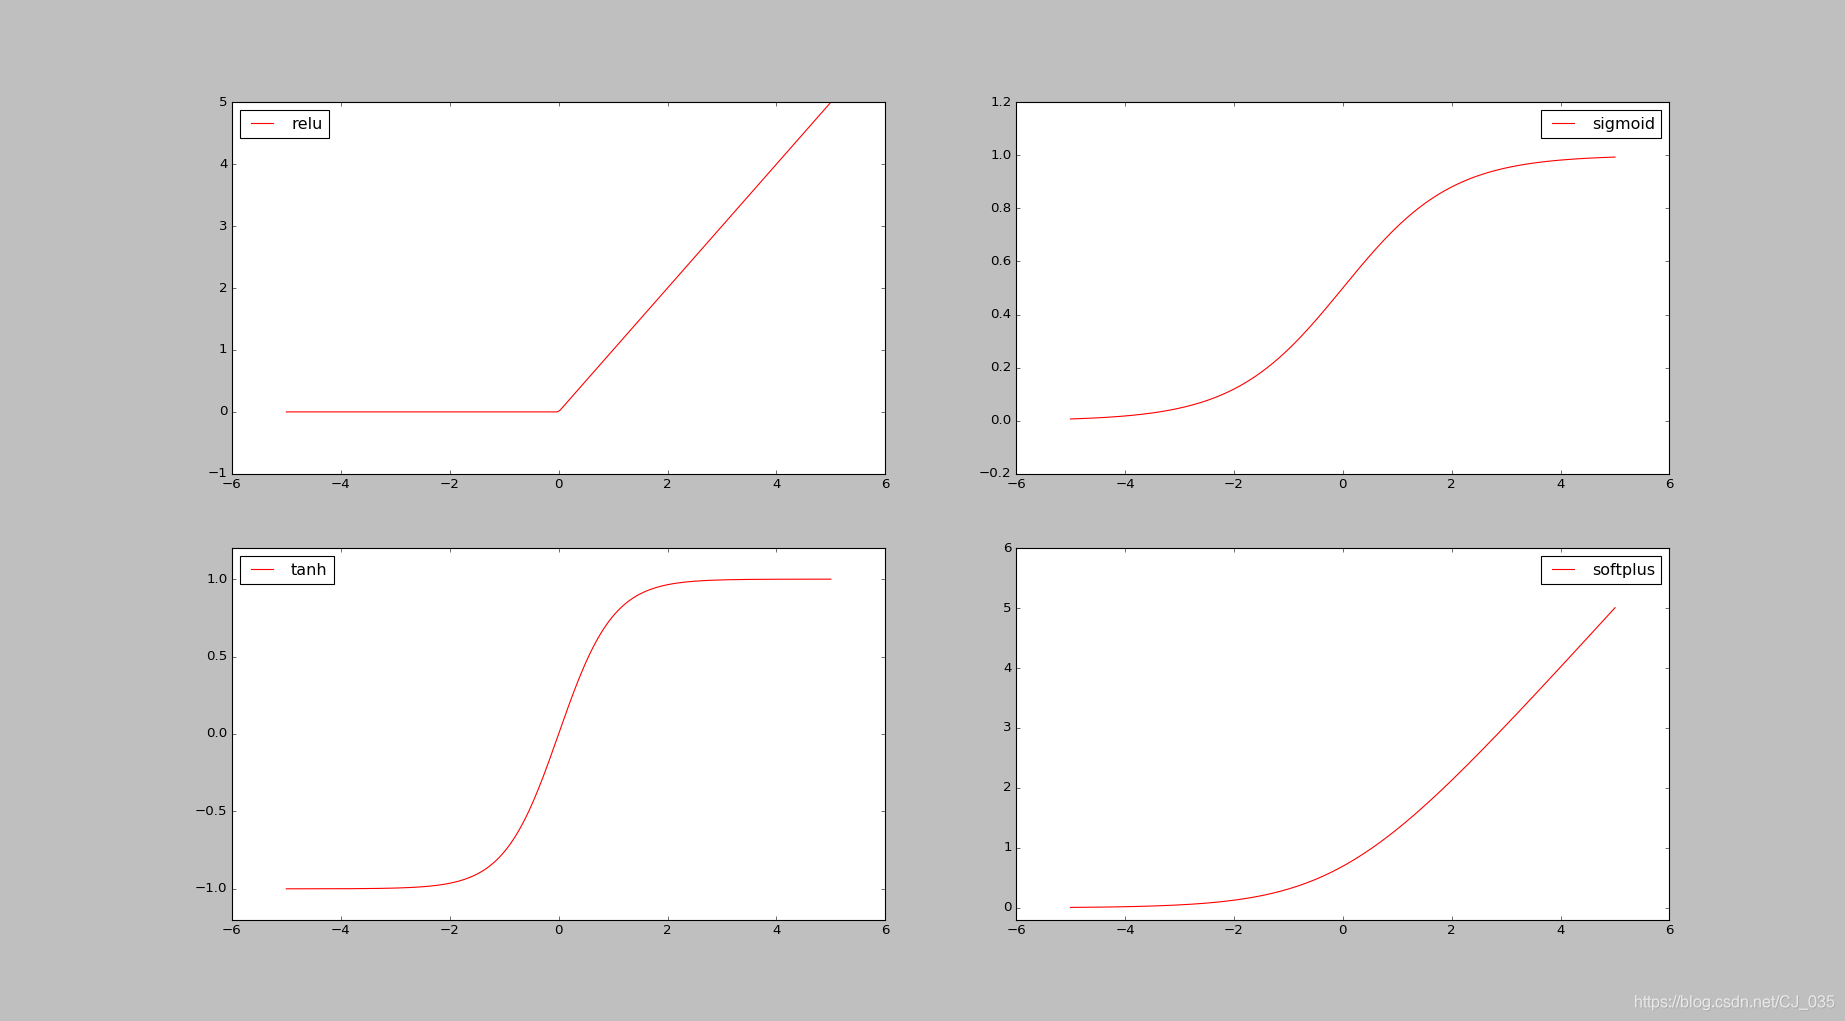
理论讲解可观看:https://www.bilibili.com/video/av16001891/?p=13