The first pair job: Visualization disease (prototype)
| This work belongs courses | Fuzhou University Software Engineering 2020 Spring classes w |
|---|---|
| Where the job requires | The first pair - the epidemic statistics visualization (prototyping) |
| Pair Student ID | 221701127 221701138 |
| The target job | Statistics epidemic complete visual prototyping |
| Text of the job | Text of the job |
| Other references | ... |
Model-based solutions NABCD given
Our products epidemic statistical visualization platform to solve Internet users can not get timely intuitive epidemic data distribution, grasp the trend of the epidemic pain points.
Based on this, we provide users with an intuitive maps, charts, trends show them the form of the epidemic.
1. Need demand
Since the outbreak, the epidemic data traceability and monitoring of the epidemic, the epidemic situation analysis, support epidemic situation judged and epidemic prevention and control aspects of the deployment has played a positive role.
People have to judge whether they can travel through the current regional disease information.
Currently, all the people to fight the epidemic of pneumonia new crown to enter a new phase of the gradual recovery of production capacity, at the time of the gradual recovery of production capacity, the public needed an intuitive provide access to timely disease information software.
- Object-oriented
all Internet users - The development trend of
the current fight against new outbreaks of pneumonia crown a new stage of gradual recovery of production capacity, when businesses return to work, people need urgent timely, intuitive software provides real-time outbreak information to identify and plan their trip.
At the end of the epidemic, the software can also extend the functionality, not only to achieve a new crown pneumonia outbreak of queries, but also other epidemic query, update to a full-fledged epidemic-wide information query software.
Demand priority
basic needs priority, expansion needs as expansion, making the information more feature-rich platformBasic needs of users
Users need to be able to obtain timely and intuitive data Region's epidemic.
Therefore, we in our log files to store data processing, combined with the map data to visually display the distribution of the epidemic.
Users can also enter the details of the epidemic interface to view information specific provinces.
| functional module | Rules Function |
|---|---|
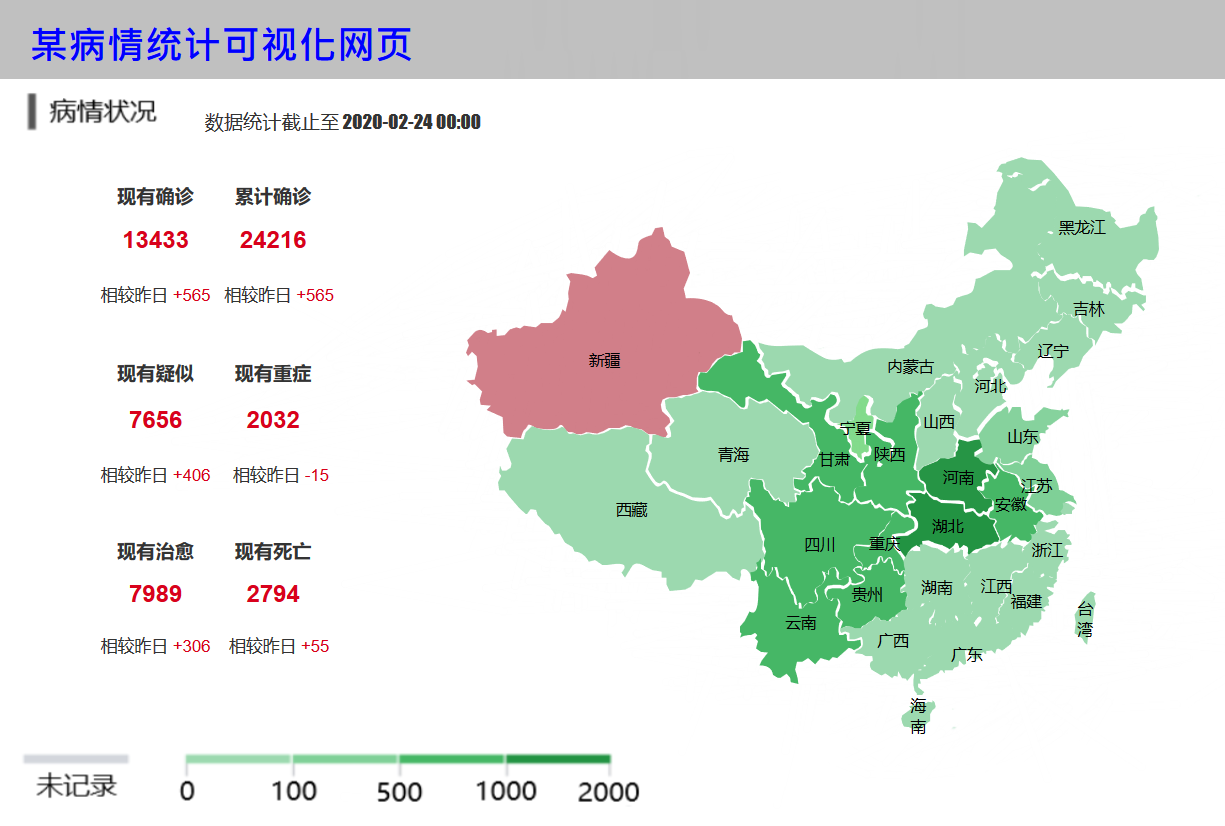
| National epidemic information table module | Respectively, show the number of existing diagnosis, the number of suspected, the number of existing severe, the cumulative number of patients, the number of cure, the number of deaths |
| National epidemic information visualization module | Map as a template to China, according to the number of points of different colors to highlight the number of infected provinces can choose to display the map query template and into the provinces of epidemic detailed information query module |
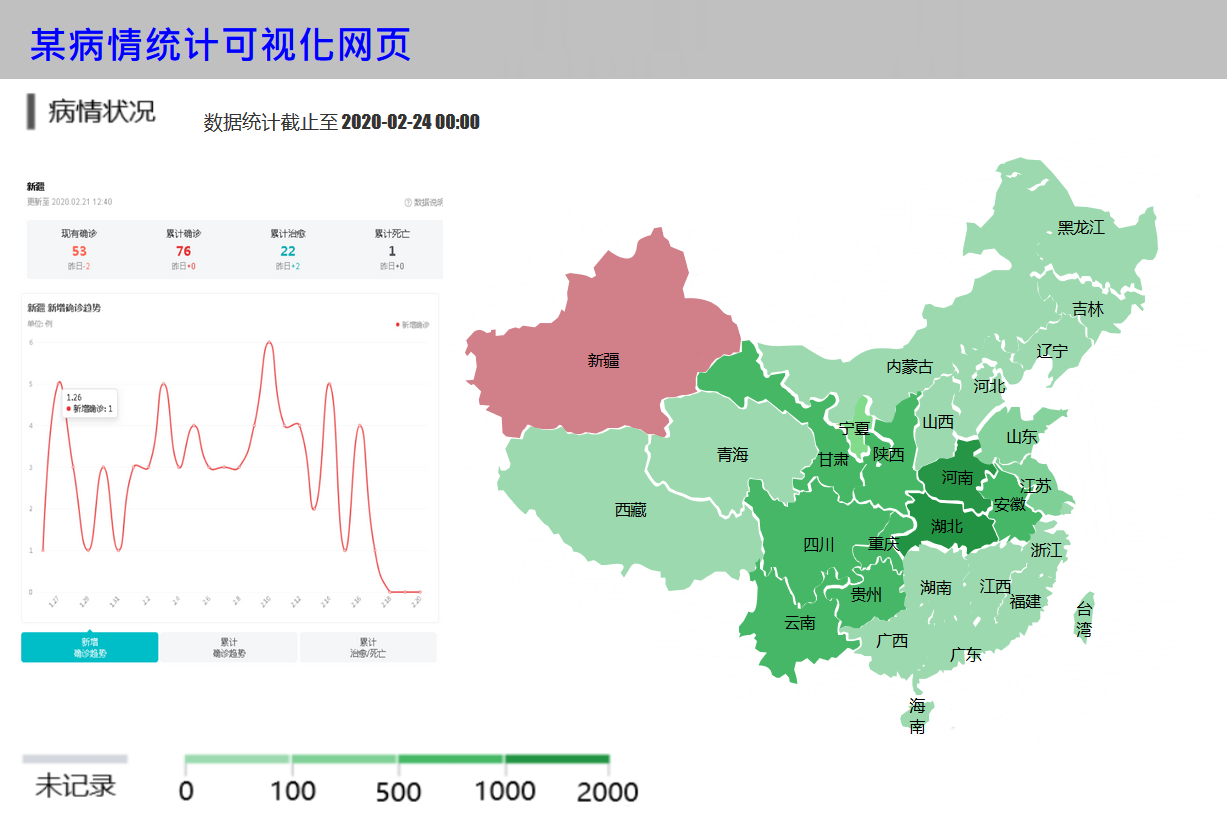
| Region epidemic information module | Respectively, show the number of diagnosed, the cumulative number of confirmed, a total cure module, the cumulative number of deaths, and epidemic trend with time as the abscissa, specify the data for the vertical axis, with the way the line graph of a visual representation of the Region |
2. Approach Methods
- Web-based visualization platform epidemic data, and communicate clearly and effectively convey information
- Java achieve a background process based on the log file and logical computing
- Based Mysql implement database storage and management
3. Benefit Benefits
- It allows the user to promptly understand the condition of the current parts of the country, help the user to identify and plan your trip
- Visualize the epidemic situation data, allowing users to access information with rich graphics, to avoid a single text form
- With flexible and convenient way to interact, allowing users to focus on a province-demand situation downtown
4. Competitors competition
Advantage
- Interface is simple and elegant, beautiful and rule-based, structured
- Information updated in a timely manner, assume the role of epidemic information release platform
- User-friendly, user-friendly interactive processing
- Development of high efficiency, timely response to the needs of the moment
Disadvantaged
- Platform also launched several major outbreaks related data visualization platform, and more mature, competitive pressures
- There is scalable feature-rich modules is limited by the relatively short development cycle, failed to achieve a more feature-rich
5. Delivery Promotion
- Push real-time outbreak information in a web page
Open public micro-channel number, and micro-channel push real-time user information epidemic
Prototype Screenshots Description
National epidemic information module shown below, the left side is a national epidemic module information table, the right side is the national epidemic data visualization module (FIG highlighted as selected Xinjiang)
Region epidemic information module in the following figure, the left epidemic trends Region
---
Prototyping tools: Aurex RP
Axure RP is a professional tool for rapid prototyping.
RP is an acronym for Rapid Prototyping (Rapid Prototyping) as a professional rapid prototyping tool, which lets responsible for defining requirements and specifications, design features and interface experts to quickly create wireframe software application or Web site, flow diagrams, prototyping and specification document.
---
Cooperation Process
- The division planning, focus and approximate time schedule two tasks
- Learning related knowledge and technology, and to achieve plus summary
- It found difficult to achieve in the process of seeking solutions, and timely summary
Finalization of blog content, summarize the whole task process

---PSP table
PSP Personal Software Process Stages Estimated time consuming (minutes) The actual time-consuming (minutes) Planning plan 30 30 Estimate Estimate how much time this task requires 10 5 Analysis Needs analysis (including learning new technologies) 30 20 Design Spec Generate design documents 30 30 Design Review Design Review 30 10 Design Specific design 2*60 2*60 Reporting report 2*60 2*60 Postmortem & Process Improvement Plan Later summarized, and process improvement plan 30 10 total 400 345
Blog PDF