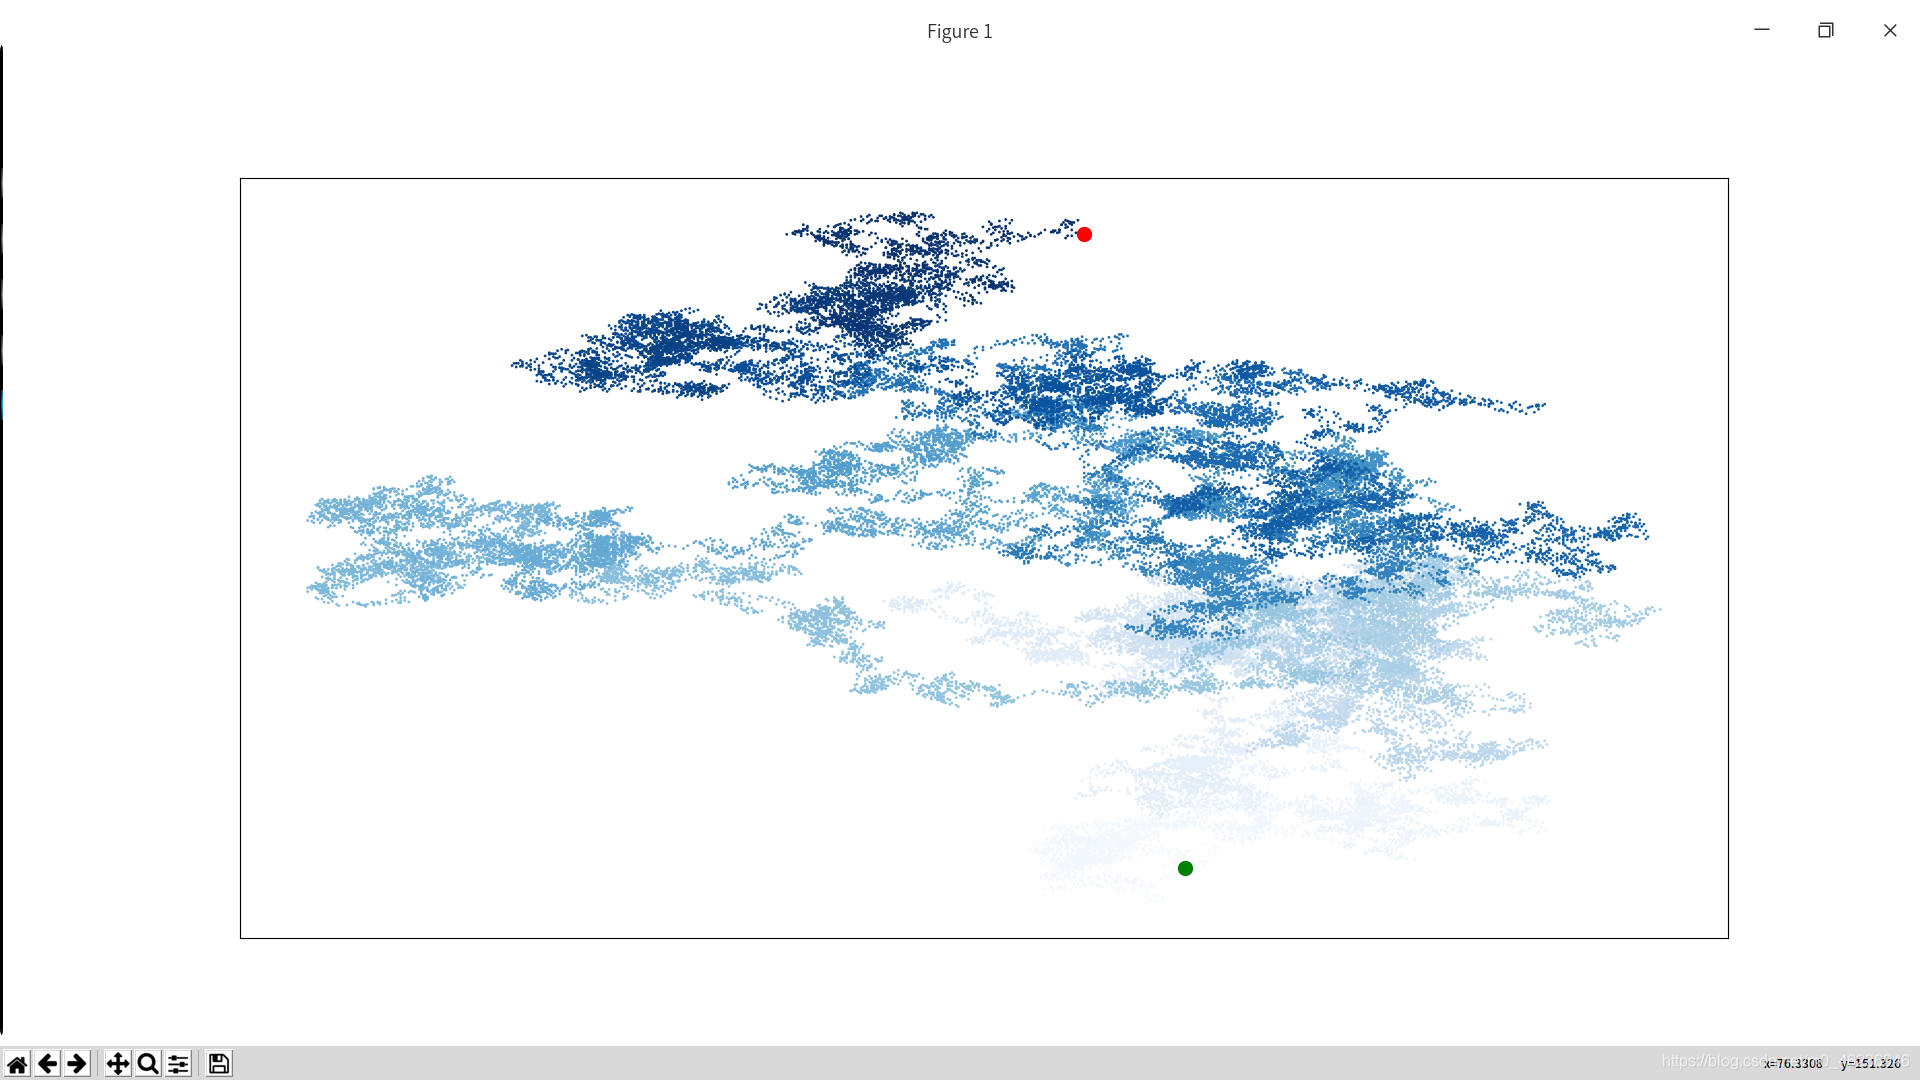
Today we learned matplotlib, mainly learned to use it to create a series of scatter. (As shown)
the main contacts and several methods
- plt.axes () get_xaxis () set_visible (False):.. cancel axis
- plt.figure (figsize, dpi): figsize parameter representation drawing image window, screen resolution parameter represents dpi
