This article is PWN2WEB original, reproduced, please indicate the source
Machine learning algorithms to learn the final result depends on the merits of data quality and data contains the amount of useful information, processing of data on the efficiency of the model has played a huge role.
A missing data processing
Data collection errors lead to missing values, we can not ignore these missing values, so we need to deal with these missing values.
First, we construct a csv file to an example where the description of the problem.
CSV file structure is as follows:
- read_csv function is to read data pandas CSV format data frame (DataFrame) in
- Demo StringIO only have a role: if we are to the CSV file data stored on the hard disk, can be read by way of this function to a string from the file data, and converted into a format assigned to csv_data DataFrame
A method 0x01 - missing feature values or delete samples
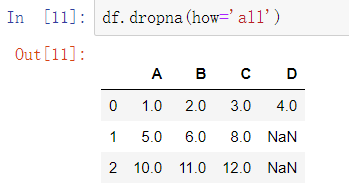
The easiest way is to directly delete the missing data, the method can be used is dropna, namely df.dropna ()
You can see, the default function to delete rows, columns if you want to delete, then you need to add a parameter axis:
axis = 1 means to delete the columns containing NaN, NaN 0 indicates deleted rows have values
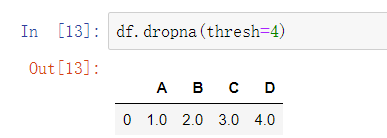
There are several other parameters of this function:
- All columns dropna (how = 'all') to discard the entire row of NaN
- dropna (subset = [ 'C']) deleted NaN values appear in a particular column of the row
0x02 missing data fill
Generally delete is an entire column or row is not enough, you lose a lot of valuable data, in which case we can use different interpolation techniques, the most common is mean imputation by the data set of data other training to estimate the missing value, we use Impute class implementation
Generally mean interpolation calculation is the average row or column interpolation is performed, and the code below, where axis = 1, is calculated for each row and for all other numbers in addition to the mean value of the missing, and filled.
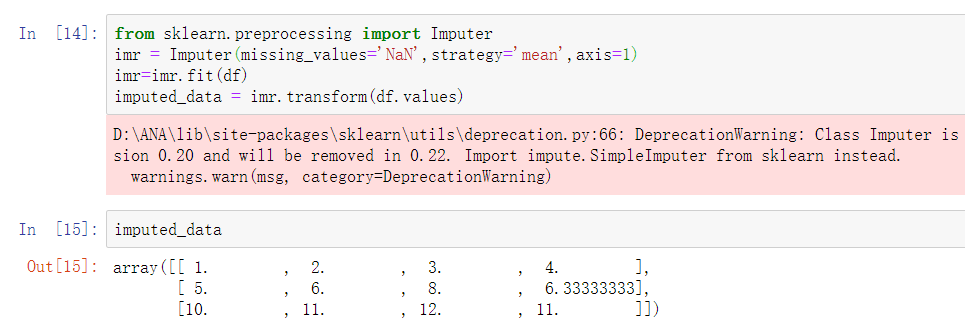 axis = 0 then that is an average value is calculated for each column.
Meanwhile, there may be median strategy parameters and most_frequent, depending on the particular circumstances the particular application
Here, Imputer the converter type API, two commonly used methods are fit and transform, difference between the two see article: https://blog.csdn.net/weixin_38278334/article/details/82971752
Two categories of data processing
Real life situations often occur one or more categories of feature data column. In discussing the category data can be further divided into their nominal feature and ordered feature, ordered feature can be understood orderly sort, or when the value category. Characteristics sorted nominal not provided. Before discussing this question we first construct a data set:
0x01 ordered mapping feature
Generally, in order to ensure that the algorithm can effectively and efficiently use ordered feature, we need to convert the string to an integer, we need to manually map usually configured:
0x02 Class underlying coding
We mentioned in the previous section mapping and orderly features, think about it, in fact, the order of these figures is not meaningful, as long as one to one to, then here's a tip:
classmapping1 by way of enumeration (enumerate), here behind me explain this class_mapping1 dictionary code is what a principle,
首先,np.unique( ) 函数,转自(https://blog.csdn.net/u012193416/article/details/79672729):
那就是说,将 将df1中的classlabel这个标的所有值去除重复值取出来
然后是我们的enumerate函数,这个函数主要是将一个可遍历的数据对象(如列表、元组或字符串)组合为一个索引序列
然后我们回过头来看label:idx这个东西,我们先看这个
这个map对应的是 label:数字 , 但是label:idx这种写法就是将字典的键值对转换成这种表达方式
最后就是for idx,label in 这句话就是将idx,label组合并分别赋值
上面两种方案太麻烦了,使用LabelEncoder类可以更加方便的完成对类标的整数编码工作
0x03 标称特征上的one-hot编码
用上面的方法去标识标称特征往往会出现如blue=1 > red=0这种情况,然而blue和red是无法比较的,这种情况下我们就要用到one-hot编码了
具体可参考:
https://zhuanlan.zhihu.com/p/35287916
https://www.imooc.com/article/35900
我简要说明一下,举例:{红,黄,蓝},{男,女},{东,西,南,北}、
首先,红黄蓝,一个特征三个类别,那就是N=3,就用三位数表示:100红 010黄 001蓝
其次,男女,一个特征两个类别,那就是N=2,就用两位数表示:10男 01女
东西南北以此类推。当一个样本为[男 黄 女 蓝 北]时,就直接按顺序把对应的编码放进去就行了:[1,0, 0,1,0, 0,1, 0,0,1, 0,0,0,1] 。这样的化会让特征空间很大,一般会结合PCA使用,我们后面会说到。
三 训练集和测试集划分
这部分虽就简单的几行代码,但是需要注意的有很多
选取UCI的葡萄酒数据举例,一共13个特征,下面第二个cell的第二行,是将numpy数组的第2-13个特征赋值给X,第一个类标特征赋值给y。这里简要介绍一下,df_wine.iloc[:, 1:]这个东西,逗号前的那个冒号,意味着第几条到第几条数据传给X,因为是冒号,那么就是所有。逗号后的1:,是第几个到第几个的特征赋值。
之后,我们要70:30划分数据集和测试集(即上图种的0.3),实际应用中,我们基于数据大小划分数据集,一般是60:40, 70:30,80:20,对于非常庞大的数据集,那就是90:10或者99:1了,然而,测试集不能太小,否则就会对泛化误差的估计将会越不准确。
四 将特征的值缩放到相同的区间
特征缩放的定义是特征缩放就是标准化数据特征的范围,从而使得每个特征的范围有可比性,比如将取值范围处理为0到1之间。
将特征缩放到相同的区间有归一化和标准化两个常用方法。
归一化:一般是缩放到[0,1]区间,为最小-最大缩放的一个特例
from sklearn.preprocesing import MinMaxScaler
mms = MinMaxScaler()
标准化:可以将均值设为0,方差设为1,使得特征列的值呈标准正态分布,易于权重的更新。
from sklearn.preprocessing import StandardScaler
stdsc = StandardScaler()
