Windows kernel analysis index directory : https: //www.cnblogs.com/onetrainee/p/11675224.html
VT debugging environment to build
Debugging method: VmWare + win7x64 + windbg + IDA64 bit
First, the virtual machine configuration
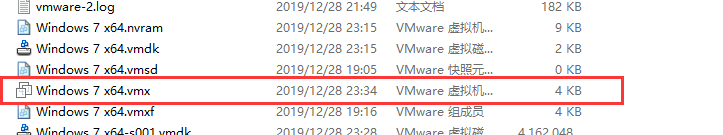
1. Open win7 virtual machine files, find a .vmx file, followed by the following words, after saving, start the virtual machine.
debugStub.listen.guest64.remote = "TRUE"
monitor.debugOnStartGuest64 = "TRUE"
debugStub.hideBreakpoints = "TRUE"
bios.bootDelay = "3000"
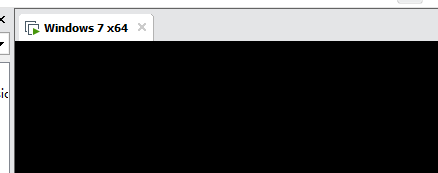
2. When you start the virtual machine, found after entering [debugging] mode, black screen, and also Windbg not connect, then do not worry, read on.
Two, IDA configured to start remote debugging
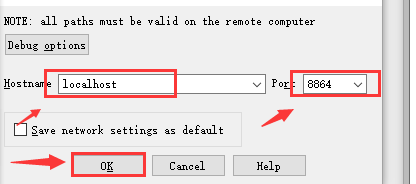
1. Open the IDA64, click on the "Debugger" - "Attach" - "Remote DGB debugger"

2. Two parameters were "localhost" "8864", and click OK.
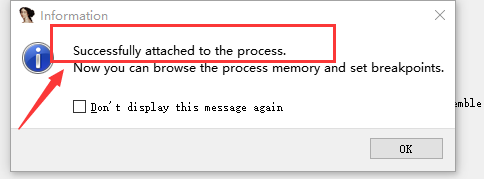
3. point has been determined, the final success of the process there will be additional
4. Tap the top left running, start the virtual machine

Third, the Virtual Machine Connection windbg
1. 当IDA中继续执行时,此时屏幕还是黑的,但此时已经可以和windbg连接了。

2. 正常启动。
四、加载PDB文件
1. 从虚拟机中的 C:\windows\system32 中找到ntoskrnl.exe
2. 下载对应的PDB文件
3. 将ntoskrnl.exe 与 对应的pdb文件放在同一个目录下,然后IDA加载PDB文件时,选择加载ntoskrnl.exe(其会自动找到对应的模块地址然后加载PDB文件)

PDB加载现在还不知道什么原因并未加载成功,但不影响我们后续的使用。