surroundings
phpstorm、phpstudy
Configuration
1, the configuration of xdebug php configuration in php.ini, which version is used, you configure which, for example 5.4.5 here to
the php.ini configuration xdebug, this is my configuration
[XDebug]
xdebug.auto_trace=1
xdebug.trace_format=0
xdebug.profiler_output_dir="F:\phpstudy\PHPTutorial\tmp\xdebug"
xdebug.trace_options=0
xdebug.collect_params=4
xdebug.collect_return=1
xdebug.collect_vars=1
xdebug.collect_assignments=1
xdebug.profiler_enable=1
xdebug.trace_output_dir="F:\phpstudy\PHPTutorial\tmp\xdebug"
zend_extension="F:\phpstudy\PHPTutorial\php\php-5.4.45\ext\php_xdebug.dll"

xdebug.remote_autostart = 0 ;
xdebug.remote_enable = 1 ;
xdebug.remote_handler = "dbgp";
xdebug.remote_host = "127.0.0.1";
xdebug.remote_port = 9000 ;
xdebug.idekey="PHPSTORM" ;
2, the configuration phpstorm, select interpreter method and pycharm almost ordinary breakpoints can be used after the
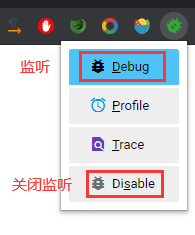
3 major record about the configuration of remote monitoring, use the Google plug-Xdebug helper
configuration process:
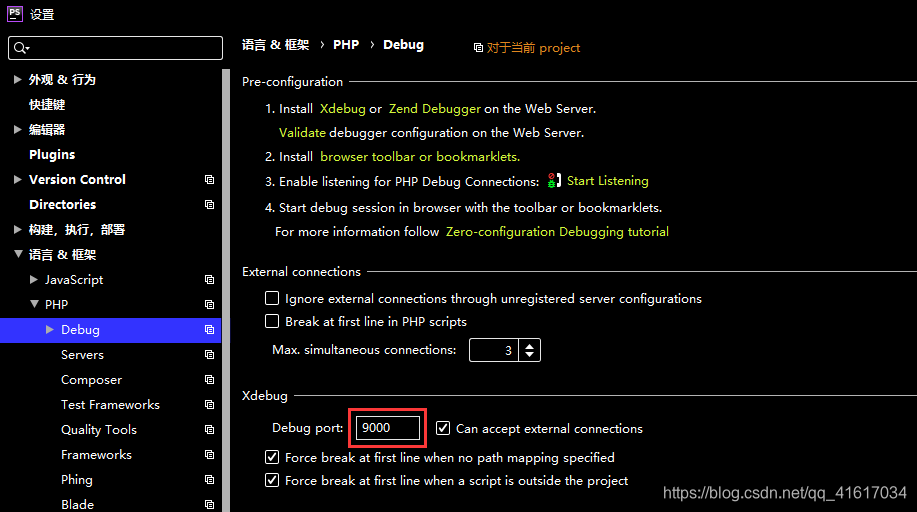
(1) in the Debug configuration phpstorm
select file -> settings -> language & frame -> Debug-> port is provided, a default 9000
Note: the determination here is the same as the port and the php.ini
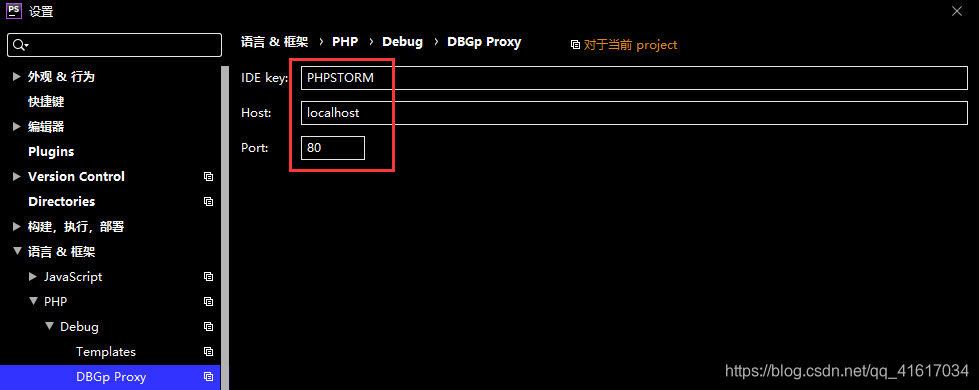
(2) DBGp Proxy configuration
file -> settings -> language & framework - > Debug-> DBGp Proxy
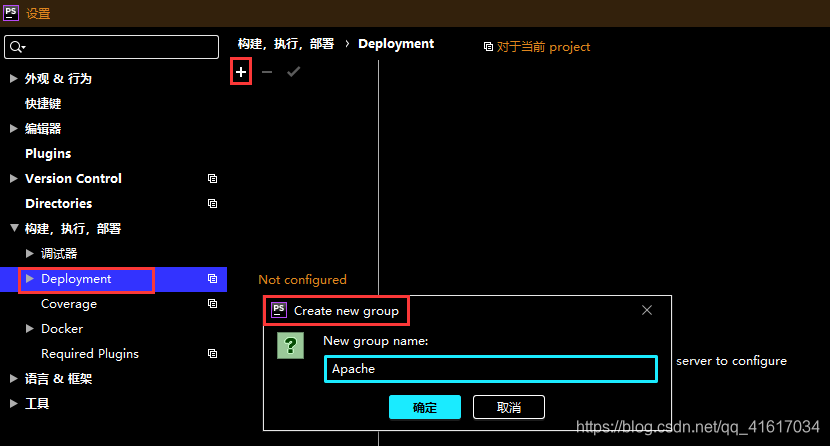
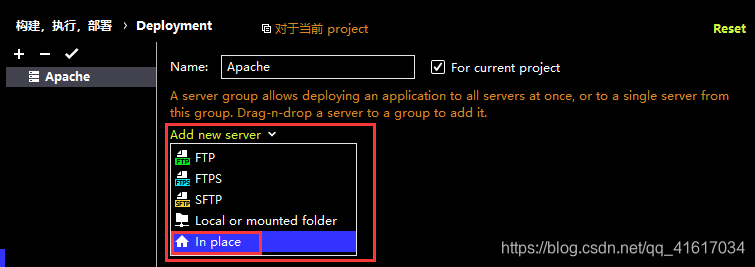
(3) using phpstudy environment configuration (if not can not be provided, the default phpstorm port 64423)
my Servers configured port is not used, no matter how all 64,233 ports, we can only use the following the method, the name at random:
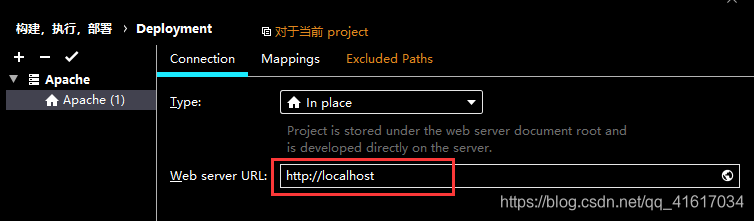
Note: after you configure this, click your browser will default to execute file in the local phpstudy in www directory in phpstorm, so as to be under the text of the 1.php www directory
(4) monitor browser
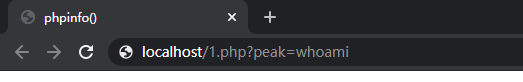
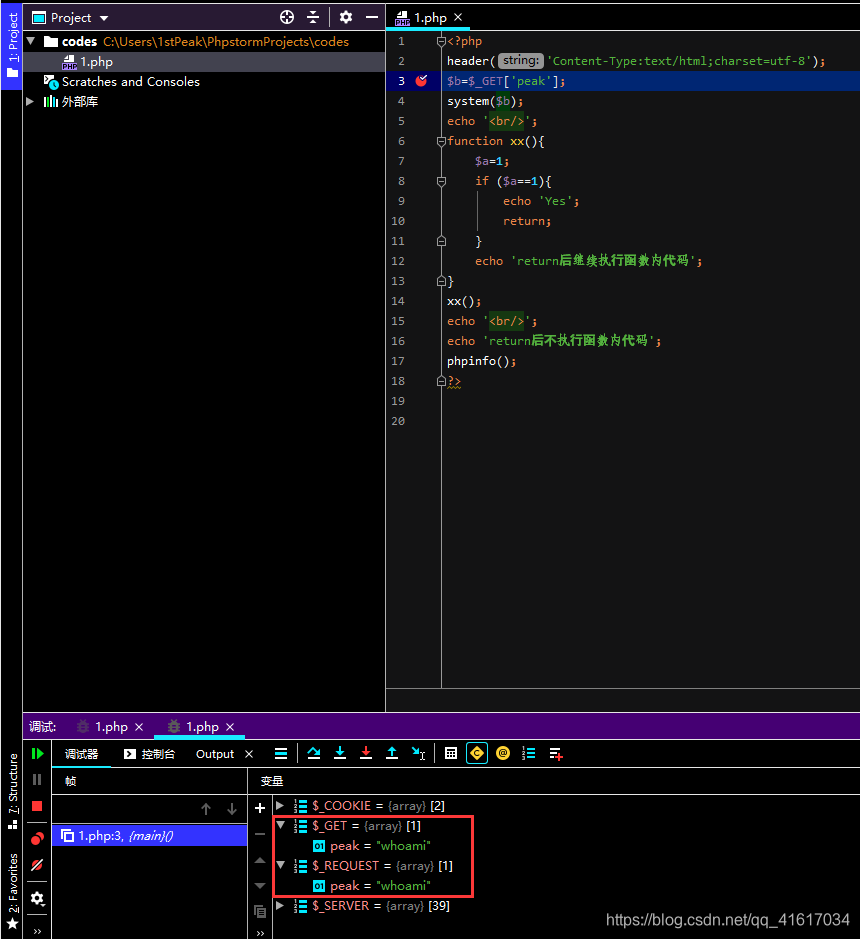
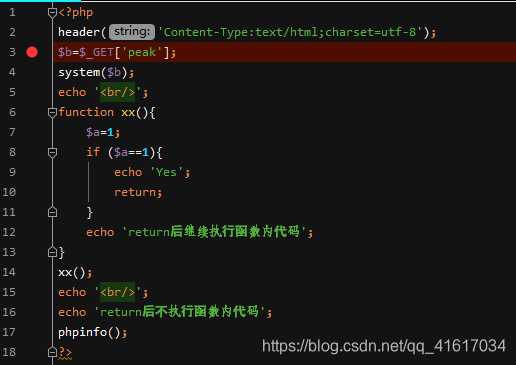
such as a string of codes:
<?php
header('Content-Type:text/html;charset=utf-8');
$b=$_GET['peak'];
system($b);
echo '<br/>';
function xx(){
    $a=1;
    if ($a==1){
        echo 'Yes';
        return;
    }
    echo 'return后继续执行函数内代码';
}
xx();
echo '<br/>';
echo 'return后不执行函数内代码';
?>
How to intercept GET request it? As
to set breakpoints
Open monitoring (as shown in the figure is closed)
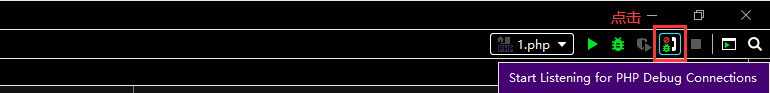
after opening a browser
Open monitoring, access 1.php