Source: the Java: online troubleshooting common means
A, jmap find examples of large memory footprint
Give a sample code:
import java.util.ArrayList;
import java.util.List;
import java.util.concurrent.CountDownLatch;

/**
 * Created by 菩提树下的杨过 on 05/09/2017.
 */
public class OOMTest {

    public static void main(String[] args) throws InterruptedException {
        CountDownLatch latch = new CountDownLatch(1);
        int max = 10000;
        List<Person> list = new ArrayList<>(max);
        for (int j = 0; j < max; j++) {
            Person p = new Person();
            p.setAge(100);
            p.setName("菩提树下的杨过");
            list.add(p);
        }
        System.out.println("ready!");
        latch.await();
    }


    public static class Person {
        private String name;
        private int age;

        public String getName() {
            return name;
        }

        public void setName(String name) {
            this.name = name;
        }

        public int getAge() {
            return age;
        }

        public void setAge(int age) {
            this.age = age;
        }
    }
}
List of examples 1w put a Person object, put this program up and running
javac OOMTest.java
java OOMTest
And then open a window, JPS the -l to find the pid of the program
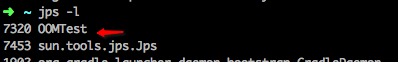
And then do jmap -histo: Live 7320 (Note: If the output of content too much, just want to see the top 10, you can add | head -10)
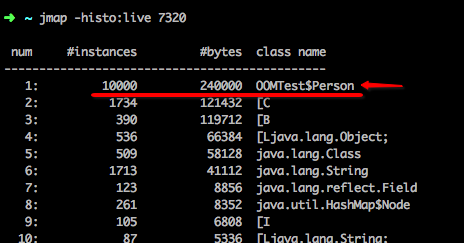
The output will be by memory usage, the actual number of objects descending order, taking up the amount of memory (in bytes) to print out a summary of the final output will be

In the above example, the number of instances of this class OOMTest $ Person to 10,000, occupy a total of 240,000 bytes (Note: for each instance i.e. 24 bytes), the total number of occupied program memory is 725,464 bytes, from about: 0.69 M.
There are also some [C, [B such class name, probably meaning:
[C is a char[]
[S is a short[]
[I is a int[]
[B is a byte[]
[[I is a int[][]
[C with String objects are often related, String its internal use final char [] array to hold the data
constMethodKlass/ methodKlass/ constantPoolKlass/ constantPoolCacheKlass/ instanceKlassKlass/ methodDataKlass
Related Classloader, resident and Perm region.
Second,? To find out the number of threads and handles a java application open
LL / proc / PID} {/ FD | WC -l view open handles Number
LL / proc / {pid} / Task | WC the -l to see the number of threads
Three, jmap view the configuration of heap memory
jmap -heap pid see something like the following output:
Thread-local the using Object Allocation.
Parallel with GC . 4 Thread (S)   // this embodiment GC (GC parallel) used

Heap the Configuration:   // heap memory configuration
   MinHeapFreeRatio = 0    // corresponds jvm startup parameters -XX: MinHeapFreeRatio disposed JVM stack minimum idle ratio (java8 default 0)
   MaxHeapFreeRatio = 100  // corresponds jvm startup parameters -XX: MaxHeapFreeRatio set the maximum idle JVM stack ratio
   maxHeapSize = 8388608 ( . 8 .0MB) // corresponds jvm startup parameters -XX: maxHeapSize = JVM stack provided The maximum size (or -Xmx parameter)
   the NewSize = 5242880 ( . 5 .0MB) //Start parameters corresponding to jvm -XX: NewSize = disposed JVM stack 'new generation' default
   MaxNewSize = 5242880 ( . 5 .0MB) // corresponds jvm startup parameters -XX: MaxNewSize = disposed JVM stack 'new generation' maximum size
   OldSize = 3145728 ( . 3 .0MB) // corresponds jvm startup parameters -XX: OldSize = disposed JVM stack 'Older Generation' size
   NewRatio = 2  // corresponds jvm startup parameters -XX: NewRatio =: 'new generation' and 'old boy Generation 'size ratio
   SurvivorRatio = . 8  // corresponds jvm startup parameters -XX: SurvivorRatio = Eden disposed in the young generation area size area ratio Survivor
   MetaspaceSize = 21,807,104 ( 20 is .796875MB)
   CompressedClassSpaceSize =1073741824 ( 1024 .0MB)
   MaxMetaspaceSize          = 17,592,186,044,415 MB
   G1HeapRegionSize          = 0 ( 0 .0MB)

Heap the Usage: // heap memory usage
the PS Young Generation
Eden Space: // Eden distribution area
   Capacity = 2.62144 million ( 2 .5MB) // Eden region The total capacity
   used = 2328088 ( 2 .2202377319335938MB) // Eden area used
   Free      = 293 352 ( 0 .27976226806640625MB) //Eden area remaining capacity
   88.80950927734375 % Used
the From Space: // wherein a Survivor Memory distribution zone
   Capacity = 1572864 ( . 1 .5MB)
   Used      = 360 448 ( 0 .34375MB)
    Free      = 1212416 ( . 1 .15625MB)
    22.916666666666668 % Used
the To Space: / / memory layout region other Survivor
   Capacity = 1048576 ( . 1 .0MB)
   Used      = 0 ( 0 .0MB)
    Free      =1048576 ( . 1 .0MB)
    0.0 % Used
the PS Old Generation // current memory area distribution Old
   Capacity = 3145728 ( . 3 .0MB)
   Used      = 1458968 ( . 1 .3913803100585938MB)
    Free      = 1.68676 million ( . 1 .6086196899414062MB)
    46.37934366861979 % Used

3759 interned Strings occupying 298 824 bytes.
NOTE: lines 5-16 heap memory is a main configuration, these parameters can be java -XX: resize = parameter name parameter value, such as:
java -XX:MinHeapFreeRatio=20 -XX:MaxHeapFreeRatio=80 -Xmx100m -XX:MetaspaceSize=50M -XX:NewRatio=3 将影响MinHeapFreeRatio、MaxHeapFreeRatio、MaxHeapSize、MetaspaceSize、NewRatio的值

Note that the NewRatio, this value refers to the year old (Old Generation): New Generation (Young Generation) ratio above 3 is arranged so as OldSize 75m, and NewSize to 25m, with reference to the following figure:

Note: This is jdk7 schematic, jdk8 the Permanent Generation been removed, new entrants to the Metaspace area, but this difference does not affect the understanding of the new generation, the Older Generation.
New Generation (Young Generation) can be subdivided into eden, s0, s1 three blocks.

Java7 and the memory changes java8, substantially as in FIG.
SurvirorRatio this a little harder to calculate, according to Oracle's official website explained: https://docs.oracle.com/cd/E19159-01/819-3681/abeil/index.html , the default value is 8, namely:? Each survivor : eden area size is 1: 8, in other words s0 = s1 = 1 / (1 + 1 + 8) = 1/10
Note: Although the official website so explain, but my real problem, it seems this is not strictly proportional to count, can probably be said that this allocation ratio. (The conclusion is: the larger SurvirorRatio setting, the greater the eden region)
Fourth, find the highest occupancy thread CPU
First to a demonstration of code:
import java.util.concurrent.CountDownLatch;

/**
 * Created by 菩提树下的杨过 on 05/09/2017.
 */
public class OOMTest {

    public static void main(String[] args) throws InterruptedException {
        CountDownLatch latch = new CountDownLatch(1);
        int max = 100;
        for (int i = 0; i < max; i++) {
            Thread t = new Thread() {
                public void run() {
                    try {
                        Thread.sleep(50);
                    } catch (InterruptedException e) {
                        Thread.currentThread().interrupt();
                    }
                }
            };
            t.setName("thread-" + i);
            t.start();
        }
        Thread t = new Thread() {
            public void run() {
                int i = 0;
                while (true) {
                    i = (i++) / 10;
                }
            }
        };
        t.setName("BUSY THREAD");
        t.start();
        System.out.println("ready");
        latch.await();
    }

}
这里面有100个线程是空转的,另外还有一个线程BUSY THREAD在狂跑CPU。
javac OOMTest.java
java OOMTest
把程序跑起来,jps -l 找出pid,然后 top -Hp pid
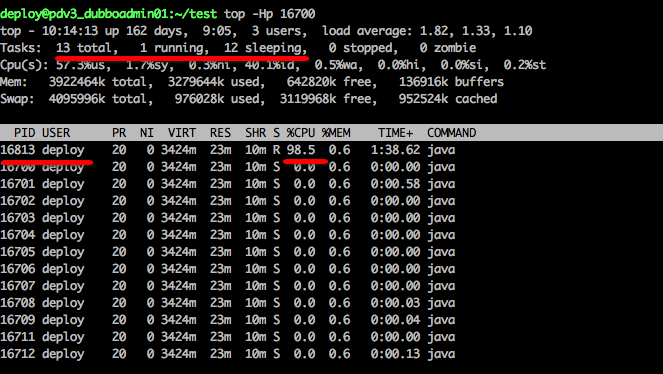
可以看到pid 16813这个对应的线程,把CPU快跑满了,达到了98.5%
接下来,将16813转换成16进制 ,即41ad (tips: printf "%x" 16813 ) ,然后
jstack pid | grep '41ad'

我们就把最忙的这个线程BUSY THREAD给找出来了(注:这个技巧再次说明了,给线程取个好名字相当重要!)
tips:如果使用spring-boot的话,直接在浏览器里查看/dump端点,也可以达到类似jstack的效果。
五、jvisualvm 查看运行情况
JDK_HOME/bin下有一个自带的jvisualvm工具,可以图形化的查看GC情况(注:要安装插件)
java.net这个网站已经被oracle关了,所以安装插件这里,有点小麻烦,先到https://visualvm.github.io/pluginscenters.html 这里找到jvisualvm对应的jdk版本号,以jdk8为例,地址就是 https://visualvm.github.io/uc/8u131/updates.xml.gz
然后,把这个地址在Plugins里的Settings里改一下,然后Available Plugin这里,就能看到可用插件了,选择GC插件并安装。

可以来一段代码,然后用jvisualvm来看下GC情况
import java.util.ArrayList;
import java.util.List;

/**
 * Created by 菩提树下的杨过 on 05/09/2017.
 */
public class OOMTest {

    public static void main(String[] args) throws InterruptedException {
        List<String> list = new ArrayList<>();
        while (true) {
            Thread.sleep(10);
            list.add("菩提树下的杨过" + System.currentTimeMillis());
        }
    }
}
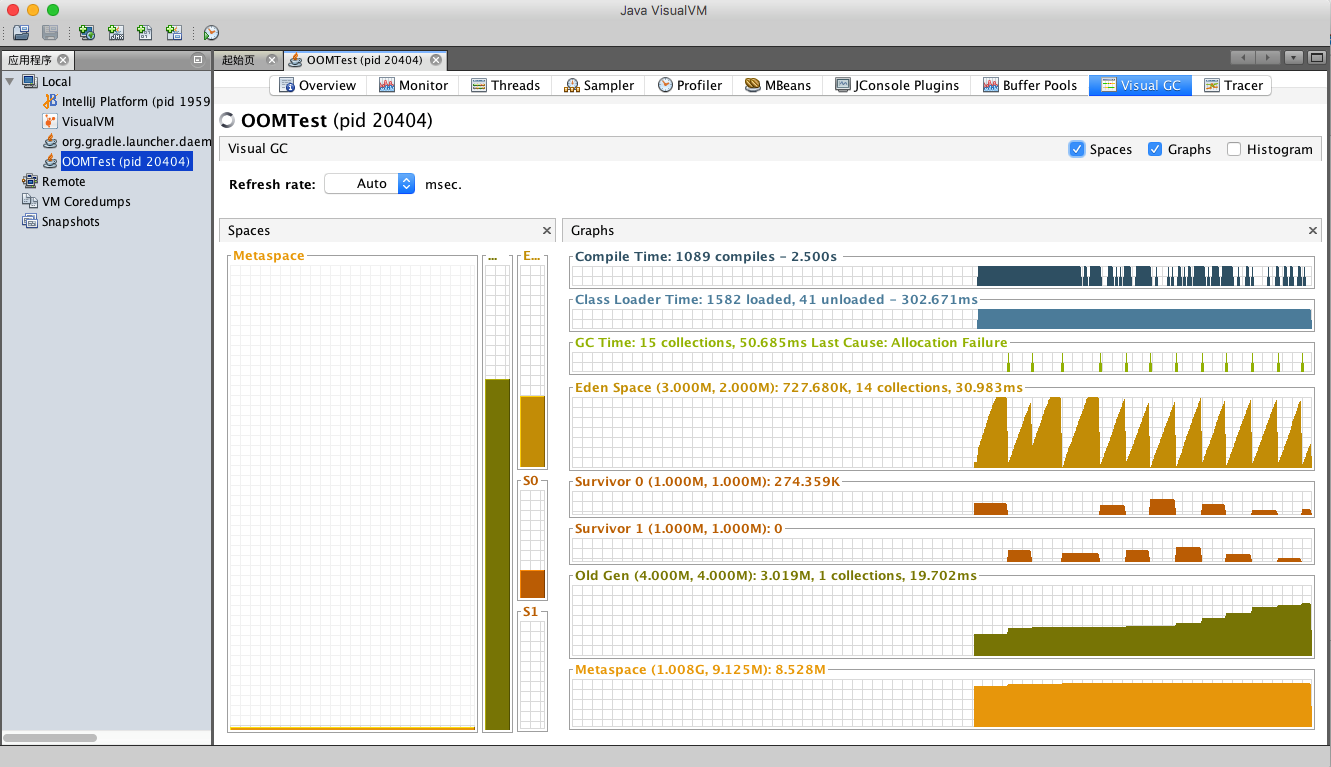
可以直观的看到Old区,Eden区,S0,S1以及Metaspace区的内存变化情况,以上图为例:Old Gen区占用内存一直在增加,表示可能有内存一直未被释放,值得关注。
此外,还可以看到占用内存最多的类(即:本文最开始提到的)

还可以更进一步点击看详情,比如下面的图,就能发现Metaspace已经OOM了

也可以查看哪些线程最忙

六、使用jstat 查看GC
虽然jvisualvm很好用,但是通常服务器是用终端连上的,无法运行图形化界面,而且也并非所有应用都开启了jmx,所以掌握jstat以命令行方式查看GC情况也是蛮重要的
用法:jstat -gc pid 采样间隔毫秒数,比如: jstat -gc 8544 5000,将每隔5s采样一次pid为8544的gc情况

以上图为例:红剪头的地方,S0区的已用量降到0,而S1区的已用量上涨,即说明发生了Young GC,对象从S0区被迁移到了S1区。
title栏的含义如下:
S0C - 新生代中第1块survivor 的容量(Survivor 0 Capacity),KB单位
S1C - 新生代中第2块survivor 的容量(Survivor 1 Capacity),KB单位
S0U - 新生代中第1块survivor 已使用空间数(Survivor 0 Used),KB单位
S1U - 新生代中第2块survivor 已使用空间数(Survivor 0 Used),KB单位
EC - Eden区的容量(KB)
EU - Eden区已使用(KB数)
OC - Old区的容量(KB)
OU - Old区已使用(KB数)
MC - Metaspace容量(KB)
MU - Metaspace已使用KB
CCSC - 压缩类的内存容量(KB)
CCSU - 压缩类的已用容量(KB)
YGC - (从应用启动算起,到采样时的) Young GC次数
YGCT - (从应用启动算起,到采样时的) Young GC所用时间(秒)
FGC - (从应用启动算起,到采样时的) Full GC次数
FGCT - (从应用启动算起,到采样时的) Full GC所用时间(秒)
GCT - (从应用启动算起,到采样时的) Yong GC + Full GC的总时间
值得一提的是G1垃圾回收器,在大堆(>4G)时,用G1可能效果会更好,G1的开启方法:
-XX:+UseG1GC -XX:MaxGCPauseMillis=200
When turned on, then use jmap -heap pid 
We can see from the default concurrent GC becomes G1.
jstat -gc pid 5000

S0 see all 0, which is a feature of the G1, the new generation will be divided and cancel the old era, but with the new concept of the region, the entire heap memory is divided into one region, as detailed in the final reference herein article.
Seven, export dump of the entire jvm
jmap -dump: format = b, file = filename [pid]
Enlarge this be the last resort, the whole jvm all turned out analysis, usually when other means get it working, only to find that engage in operation and maintenance, large volume exported file, and when you export will pause application . After this file to get local, you can use a plugin eclipse of MAT to analyze, download address: http://www.eclipse.org/mat/downloads.php