1, incident reduction
Yesterday afternoon, 504 received a warning, this is obviously a time-out alarm. At that time, there are other things on hand, did not care, just a glance, but caused alarm method is very familiar with, I wrote, the first reaction a little surprised.
After the surprise, we continue to deal with the job at hand.
After one hour, they received the same warning, apparently not accidental, certainly where a problem and began investigation.
Alarm Interface Controller is a layer of getControllerAMethod ControllerA interface that a plurality of micro call service, and finally assembling the resulting data is returned. The problem is ServiceM, ServiceM service in the getServiceMMethod method logic is very simple, mainly two database query, to fetch data from MySQL database and returned to the caller.
Call chains as shown in FIG.

2, Environment Introduction
Language: Go
DB:MySQL
Database interaction: Database / SQL (On this basis, the company did some customization and packaging, nature or database / sql)
The following describes specific troubleshooting process began this question.
3, instinctive reaction: start from the sql statement
Get alarms, alarm information from log information and details of the corresponding point of view, it belongs to the overtime issue.
The first reaction is to see if sql statement query is slow (although this is highly unlikely to play knew), sql statement is very simple, shaped like
select a, b, c from tableA where a in (a1,a2,a3)
Do not look at the execution plan may know that it is a hit index.
But still looked under the implementation plan and actual implementation, analysis, and response time are considerable, there is no problem.
Investigation instinct is so uninteresting, start the next investigation.
4, upstream of the investigation: whether the context time runs out
Since it is a time-out issue, there may be upstream of the timeout, it may be downstream of the timeout, the first step in the investigation has ruled out the possibility of causing downstream because the slow query timeout.
It would not be the upstream overtime it? Obviously it is possible, after all, we know that the context can pass Go all the way down, all service calls are common to the total amount of time set.
And from the chart can be found ServiceM is the final step in the upstream interface, so if the above service too time-consuming occupation, will lead to a time limit ServiceM compressed left.
However, the investigation can be found from the log, see getServiceMethod method ServiceM layer corresponds almost all sql queries return tens of milliseconds.
From this point of view, because a timeout is not enough time to cause the upstream.
5, downstream of a preliminary investigation: rows into a prime suspect
Since the upstream adequate amount of time, then the problem is a high probability that in the downstream service interface.
I began to read getServiceMMethod method code, the following pseudo-code is the code for implementing the functions
rows, err = db.query(sql1)
if err != nil {
  ...
}

defer rows.Close()
for rows.Next() {
  rows.scan(...)
}

rows, err = db.query(sql2)
if err != nil {
  ...
}

defer rows.Close()
for rows.Next() {
  rows.scan(...)
}
After reading the code, start a little excited, I think yes, probably this is the problem of the rows.
In the "Go-ons Learn --database / sql database connection pool you use the right thing," I introduced this about pit rows did not close properly brought. So whether it is because Lenovo began traversing the rows in the process does not properly close the database connection, resulting in leakage of the connection, that connection can not get behind the query results in a timeout.
The reason I have analyzed clearly, but concrete step in addition to the problem which it only can think of is here twice a query using the same rows object is not a situation leading to the previous connection has been closed down a query directly using a closed connection timeout caused it?
In this case the warning begins more frequently, then the two rows from the original query where a receiver to receive two rows close it and submit the code, after the test started through the line.
6, a brief calm
After the code on the line, the effect is immediate.
Alarm immediately stop, no time-out log information again, and everything has returned to its former calm, which made me believe that I should find the cause and solve the problem now.
After returning home, my heart is still somewhat at ease, starting from 11:00, I took out my computer and began a variety of simulation, validation and reducing causes of the alarm.
7, three hours later, realizing that the calm could be illusion
From 11:00 until the two points, a full three hours, I not only find no reason, but I found the solution may not solve the problem.
Because the problem is not complicated code, as shown above, i.e., only two Select queries.
So I wrote some code in the same local test, and did not finish after a timeout or get connected appears. Even, I will maxConn and IdleConn are set to 1 and no time-out does not occur.
Unless, like the article "Go-ons Learn --database / sql database connection pool you use the right thing," Lane said, like an early exit in row.Next () process and no rows.Close () statement, will result in lower get connected to the case of a query, i.e., the following code shown in FIG.
func oneConnWithRowsNextWithError() {
	db, _ := db.Open("mysql", "root:rootroot@/dqm?charset=utf8&parseTime=True&loc=Local")

	db.SetMaxOpenConns(1)
	rows, err := db.Query("select * from test where name = 'jackie' limit 10")
	if err != nil {
		fmt.Println("query error")
	}

	i := 1
	for rows.Next() {
		i++
		if i == 3 {
			break
		}
		fmt.Println("close")
	}

	row, _ := db.Query("select * from test")
	fmt.Println(row, rows)
}
But the original code is defer rows.Close () method, the connection will eventually will shut down, the situation memory leak does not occur.
At this moment, I thought of Murphy's Law (because there is no real solution to the problem, the problem back again).
So, I began Grilled source, combining log and found an important clue is that many queries are being actively cancel the task. Yes, this is context.Timeout cancel returned cancel (this code is abundant in our database / sql basis functions).
Cancel trigger condition is QueryContext method for performing database / sql Returns the err
// QueryContext executes a query that returns rows, typically a SELECT.
// The args are for any placeholder parameters in the query.
func (db *DB) QueryContext(ctx context.Context, query string, args ...interface{}) (*Rows, error) {
	var rows *Rows
	var err error
	for i := 0; i < maxBadConnRetries; i++ {
		rows, err = db.query(ctx, query, args, cachedOrNewConn)
		if err != driver.ErrBadConn {
			break
		}
	}
	if err == driver.ErrBadConn {
		return db.query(ctx, query, args, alwaysNewConn)
	}
	return rows, err
}
The first reaction is upstream of lack of time, resulting in a direct cancel context, but for this reason we have already ruled out.
So this code has been turned down several layers, also once suspected to our self-developed code called a parameter whether QueryTimeout configuration is too small, but went to a configuration (this one is very important, later would say), found is 800ms, obviously enough.
With more and more problems, I reluctantly went to bed.
8, Murphy's Law still apparitions
This afternoon, I had received this familiar warning that they're coming in (but only received a warning).
Said earlier, this is an important message may cancel, so the problem is not gone, certainly because of a timeout, timeout may be due to not get connected.
Because getServiceMMethod have asked yourself a pass, and did not connect leak case, but other places will not leak it? So gone through all of the code ServiceM services, whether or not there is normally closed checking rows for the use of the code object.
After investigation hopes.
So far, I played my heart has been ruled out is the question of the connection leak.
Period, I also asked our DBA, because I turned down the log, around 8:00 today, there are several queries in a few hundred milliseconds, suspected to be caused by abnormal state DB. DBA database for my reply is very normal.
I also saw the monitor, compared to the past state of DB and no traffic anomaly, the number of pools of ups and downs and no connection.
Colleagues said a few days ago on new features than previous large, so I looked under the new code corresponding to the function, did not find the problem.
9, prepared to "Quxianjiuguo"
I want the root cause has not been found, I began to wonder if can avoid this problem by other means unknown yet. After all, the best way to solve the problem is not resolved (Put another way).
Prepare the timeout ServiceM method to transfer large.
Also ready to add cache getServiceMMethod method ServiceM services, to fend off a portion of the amount requested by the cache.
Okay, stop here, tomorrow to try to use Zheliang Zhao.
So, I stand ready to get some activity, by the way in my mind this warning ins and outs of inventory.
10, had an idea, I found the truth
Alarm upstream, downstream timeout ->
Exclude upstream lack of time ->
Negative downstream rows not closed ->
Exclude unstable state database ->
Determining downstream timeout ->
Suspect can not get connected ->
Get connected, get connected, get connected
So we look through the database configuration parameters, the above is just to turn QueryTimeout parameter, vaguely remember the connection pool setting is not here. Turning next read configuration, idleConn = X, maxConn = Y.
Again looked getServiceMMethod QPS method of monitoring, I think I found the truth.
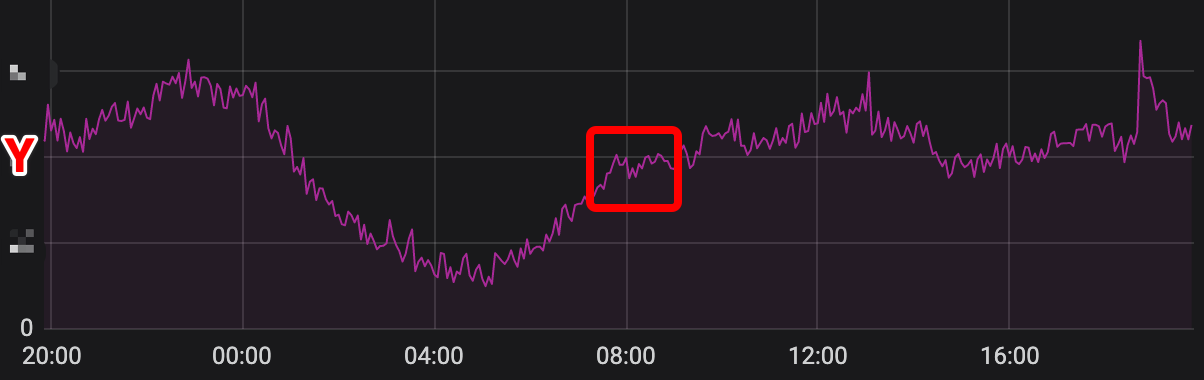
From early morning to eight in the morning, QPS has been on the rise until about 8:00, breaking Y, and maxConn = Y.
So it should be more than maxConn, leading to the back of the query task not get the connection can only wait, wait to time-out or did not get the connection, so the above said trigger cancel, which also led to the upstream seeing timeout alarms are ServiceM getServiceMMethod execution of a timeout, as has been waiting for.
So why the figure has more than Y when the alarm has not yet, I understand there should be other tasks to perform query task has been completed to connect put back into pool during this period, followed by the request can be used directly, after all, there will be a wait window timeout.
So why this warning does not appear before it, my understanding is smaller than before, the new line features the recently co-worker, causes the interface is to increase the number of calls, it highlights the problem.
11, summary
In fact, the last reason may be simple, the amount is up, the number of connections configured seem small, which later led to query tasks not get a connection timeout.
But this time out across the Service Controller layer and the bottom of the DB layer, each layer may lead to a timeout, so the investigation is relatively difficult.
Here are some key points afterthought
- Recent changes to the code that needs extra attention. If you've a long time without warning, the recent completion of the new code alarm, the high probability and on-line relationship (this timeout fact and new on-line code is also related, though the code itself is no problem, but the new on-line traffic bigger)
- Make good use of tools. With good monitoring and logging systems and other tools to find out the clues and useful links.
- Top-down investigation and track. For good positioning bug, you can call the order such as checking in a certain order, validation, exclusion, until the cause.