First, the section reviews
On one, we study together, the basic idea of application monitoring, first briefly recall. Monitoring application, you can monitor and log monitoring indicators divided into two blocks.
Monitoring indicators, mainly for performance of a certain period is measured, and then by a time series manner, processing, storage and alarms.
Monitoring and logging, it is possible to provide more detailed information on the context, generally, to the collection, indexing, and a graphic representation by ELK technology stack.
In the complex business scenarios across multiple different applications, you can also build full link tracking system. This way, you can dynamically track the performance of various components of the call chain, the entire call topology generation applications, thus speeding up the performance of complex applications to locate the problem.
However, if you receive an alarm monitoring system, we found the system resources or application performance bottlenecks, how to further analyze its roots it? Today, I would separately from the system resource bottlenecks and bottlenecks in the application of these two angles, with you with the view of
the general steps look, performance analysis.
Second, the system resource bottlenecks
First look at the bottlenecks of system resources, which is the most common performance problems.
Integrated system monitoring ideas article, I have introduced the bottleneck of system resources, you can USE method, namely usage, saturation, and the number of errors of these three indicators to measure . Resource system can be divided into two types of hardware and software resources.
- Such as CPU, memory, disk and file systems and networks, are the most common hardware resources.
- The number of file descriptors, connection tracking number, socket buffer size, is a typical software resources.
In this way, when you receive an alarm monitoring system, they can control these resource list, and then to target people based on different indicators.
In fact, the core before we columns of four modules, it is to learn to analyze performance problems caused by these resource bottlenecks. Therefore, when you encounter a performance bottleneck of system resources, all ideas, methods and tools of the front of the module, as can be fully used.
Next, I went from four aspects of CPU performance, memory performance, disk and file system I / O performance and network performance, they look at you with analysis steps
Three, CPU performance analysis
The first resource is the most common system CPU. About CPU performance analysis methods, I analyze the bottlenecks in how quickly the system CPU, the idea has been put together quickly analyze a CPU performance bottlenecks for you.
Remember this picture it? The most common use of several tools top, vmstat, pidstat, strace and perf etc., after obtaining the CPU performance, combined with the CPU process works, you can quickly locate the source of CPU performance bottlenecks.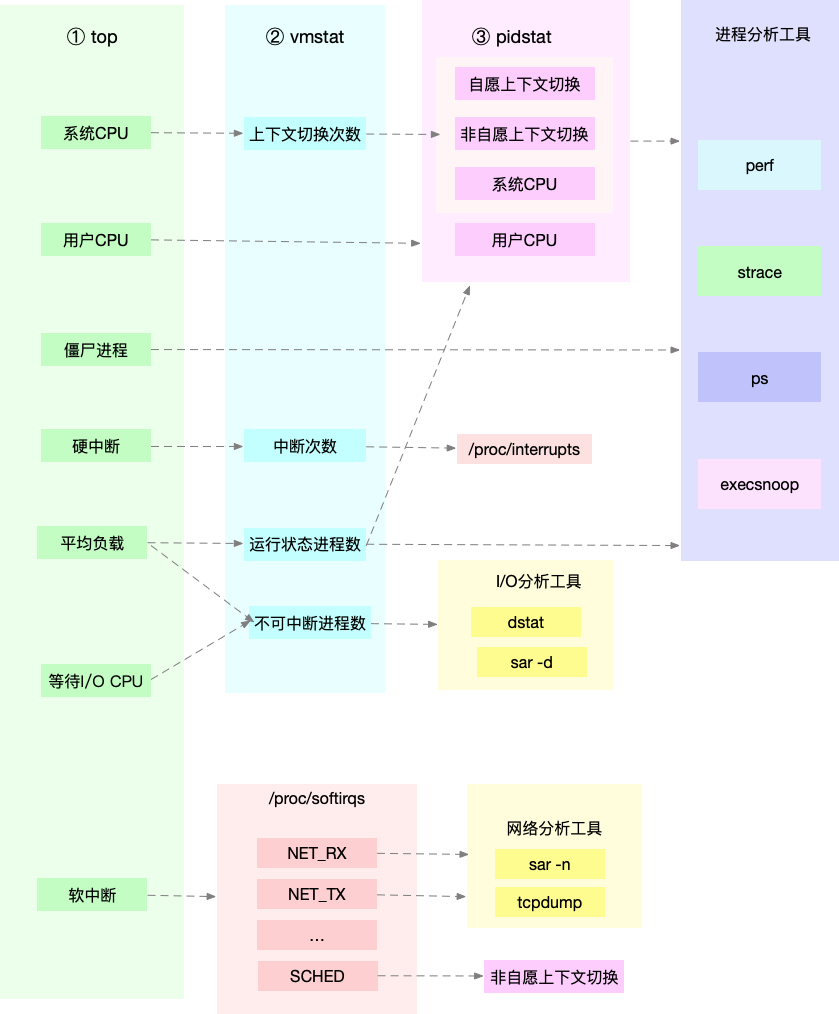
Indeed, top, pidstat, vmstat such tools are reported CPU performance, are derived from the / proc file system (such as / proc / loadavg, / proc / stat, / proc / softirqs etc.). These indicators should be monitored by the monitoring system play
to. Although not all alarm indicators are required, but these indicators it can speed up the analysis of positioning performance issues.
For example, when you receive the system users high CPU usage alarm from the monitoring system queries directly to, resulting in high CPU usage process; and then log on to the Linux server process, the analysis of the process behavior.
You can use strace, view the process of system calls summary; you can also use tools such as perf identify hot spots function process; you can even use dynamic tracking, the currently executing process to observe the process until you determine the root cause of the bottleneck.
Fourth, the memory performance analysis
Having analyzed the performance of the CPU, let's look at the second system resources, namely memory. Analysis on memory performance, and how I am, "Quick, Accurate" find the problem of system memory, the idea has also been finishing a quick analysis for you.
The picture below is a process to quickly locate memory bottleneck. We can free performance indicators and vmstat output, confirm memory bottleneck; Then, depending on the type of memory problem, further analyze memory use, distribution, and slow leaks
exist, and finally find out the source of the problem.

Like CPU performance, a lot of memory performance, but also from the / proc filesystem (such as / proc / meminfo, / proc / slabinfo , etc.), they should monitor them through the monitoring system. In this way, when you receive
when the alarm memory, you can from the monitoring system, the performance indicators directly from the image above, thus speeding up the localization process performance issues.
For example, when you receive an insufficient memory warning, first of all you can monitor the system from. Find memory for up to several processes. Then, based on memory usage history of these processes, to see if there is a memory leak. After determining the most suspicious of the process,
and then log on to the Linux server process, the analysis of the process memory space or memory allocation, and finally figure out why the process can take up a lot of memory.
Fifth, disk and file system I / O performance analysis
Next, we look at the third system resources, that is, disk and file system I / O. I on the disk and file system / O performance analysis, I analyze how quickly a bottleneck in the system I / O, the idea has also been finishing a quick analysis for you.
We look at this picture below. When you use the iostat, found disk I / O performance bottleneck (such as I / O usage is too high, the response time is too long, or a sudden increase in queue length, etc.) can then by pidstat, vmstat, etc., to confirm I / O
origin of. Then, again according to different sources, further analysis of the file system and disk usage, cache, and process I / O, so as to ferret out the murderers I / O problems
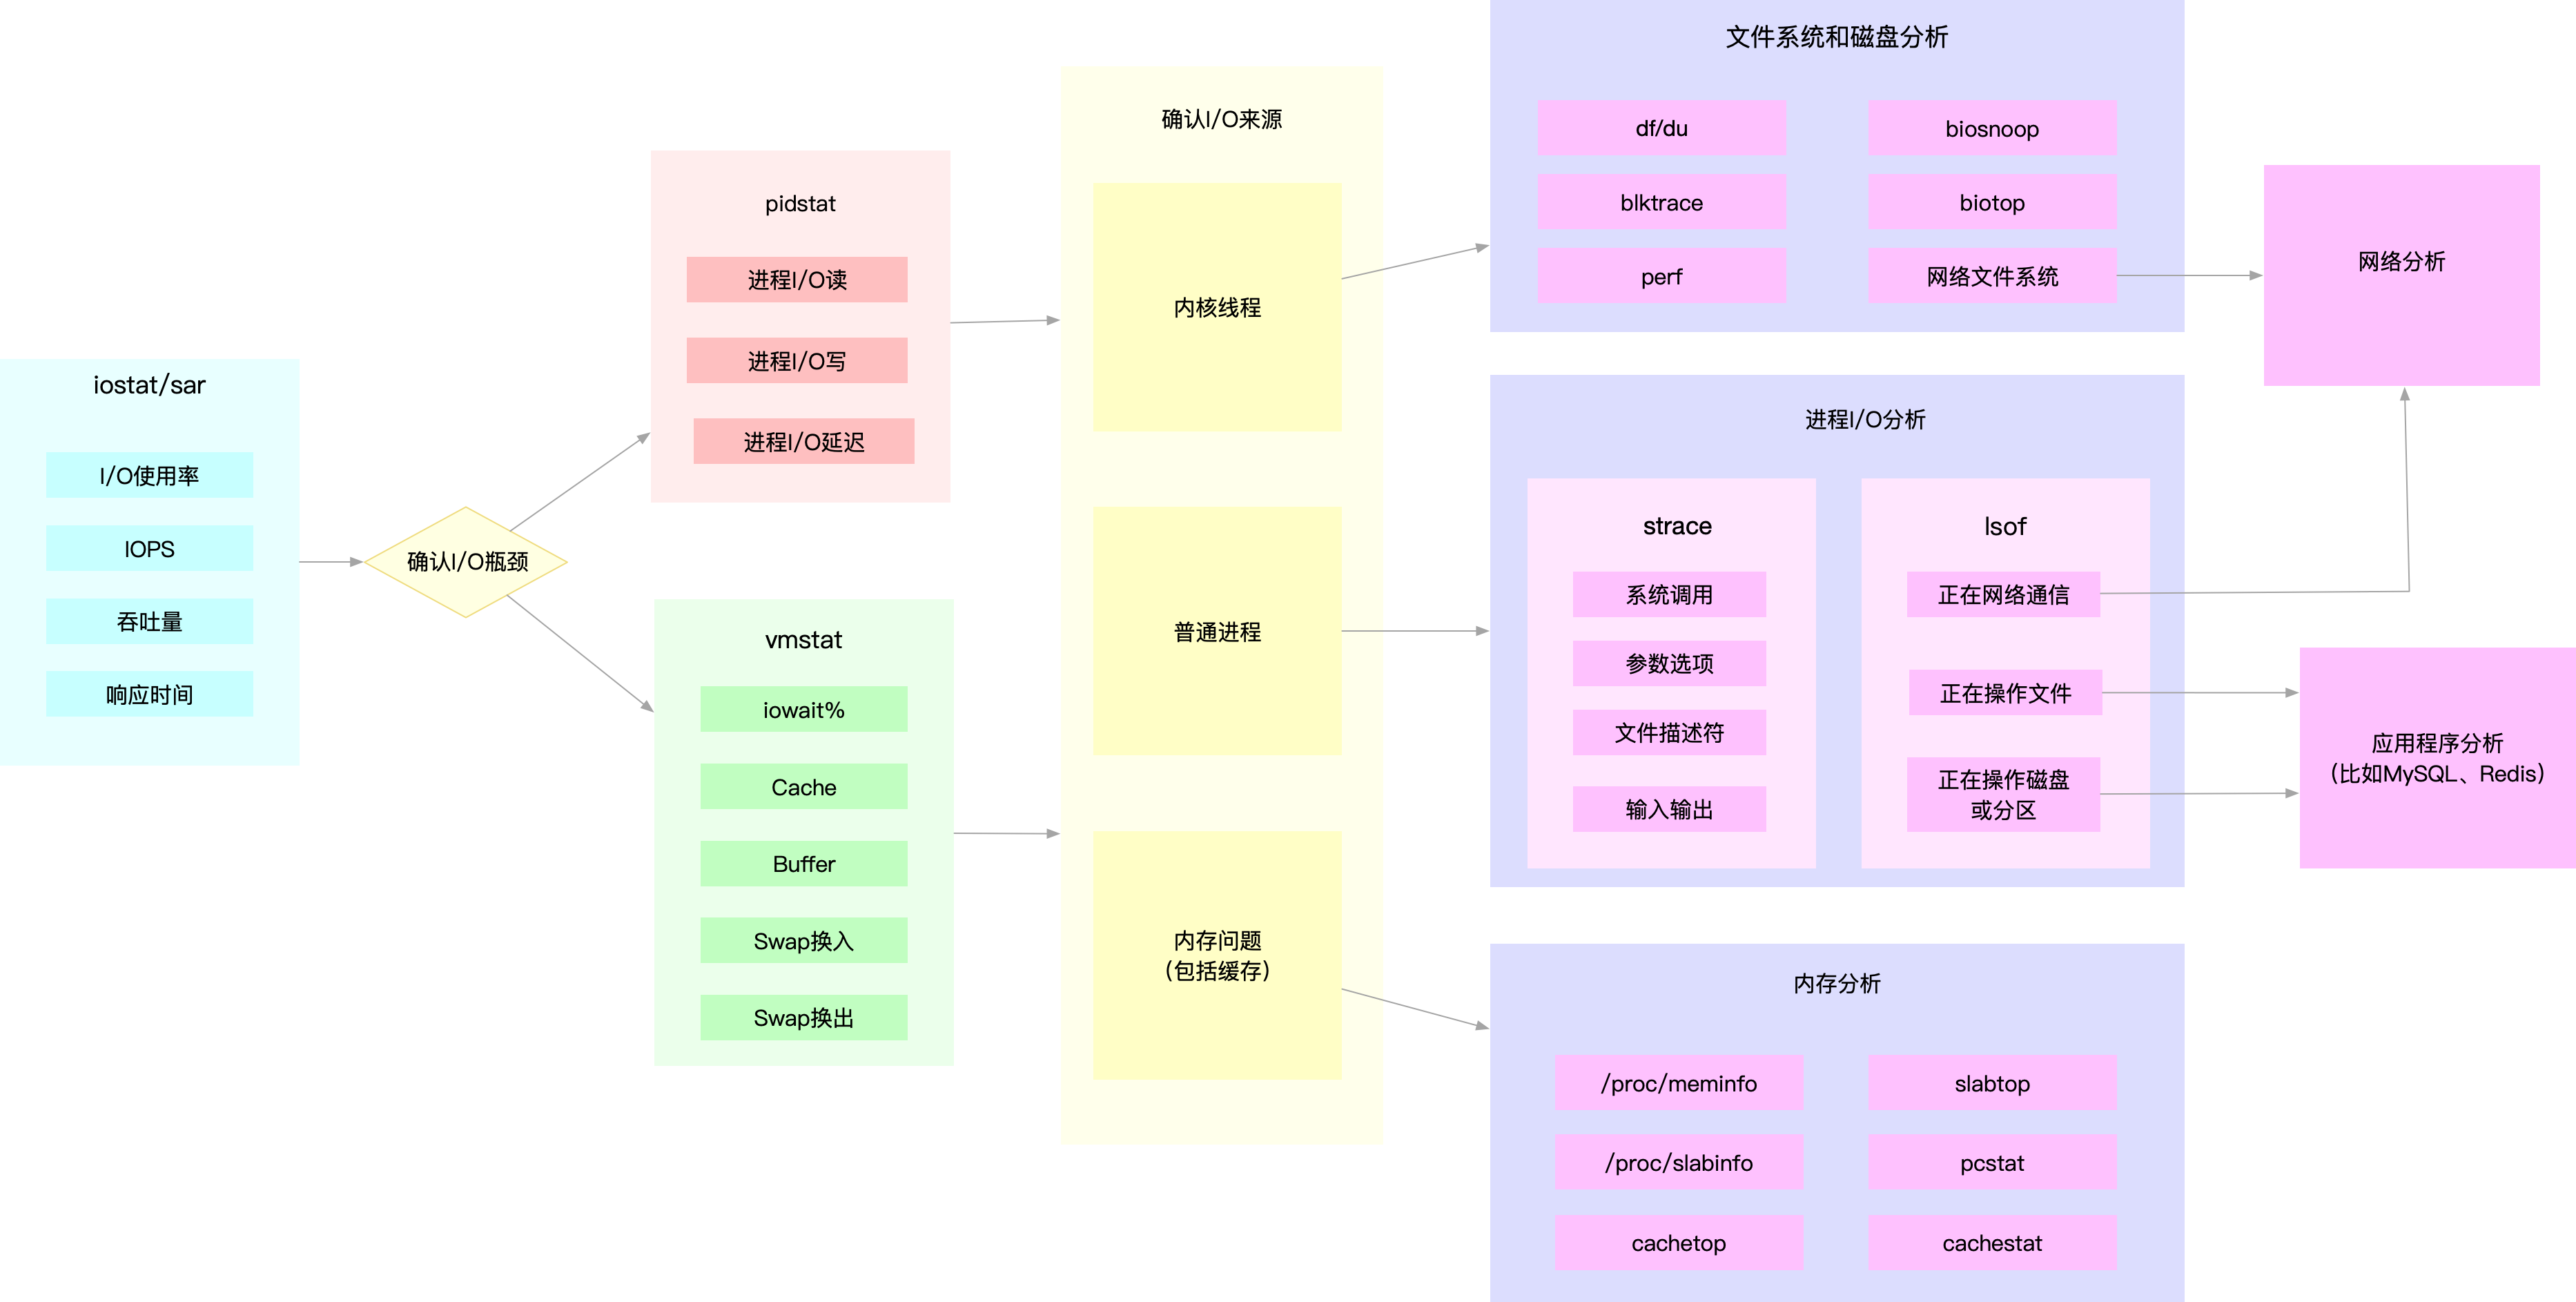
Similar to the CPU and memory performance, a lot of disk and file system performance, but also from / proc and / sys file system (such as / proc / diskstats, / sys / block / sda / stat , etc.). Naturally, they should also be monitored by the monitoring system play
to. In this way, when you receive the I / O performance alarms from the monitoring system can directly obtain the performance indicators in the figure above, thus speeding up the process of positioning performance.
For example, when you find I / O using 100% of a disk block, the system can be monitored from the first. Identify I / O up process. Then, log on to the Linux server process where, with the aid strace, lsof, perf and other tools into the analysis
process I / O behavior. Finally, combined with the application of the principle, to find out the reason a large number of I / O's.
Sixth, network performance analysis
Finally, network performance, in fact, contain two types of resources, that is, the network interface and kernel resources. In a few ideas to optimize network performance, I also mentioned to analyze network performance, to cut from the principle Linux network protocol stack. Below this figure, that
the basic principles of the Linux network protocol stack includes an application layer, the digital interface kit, transport layer, network layer, link layer, and the like.
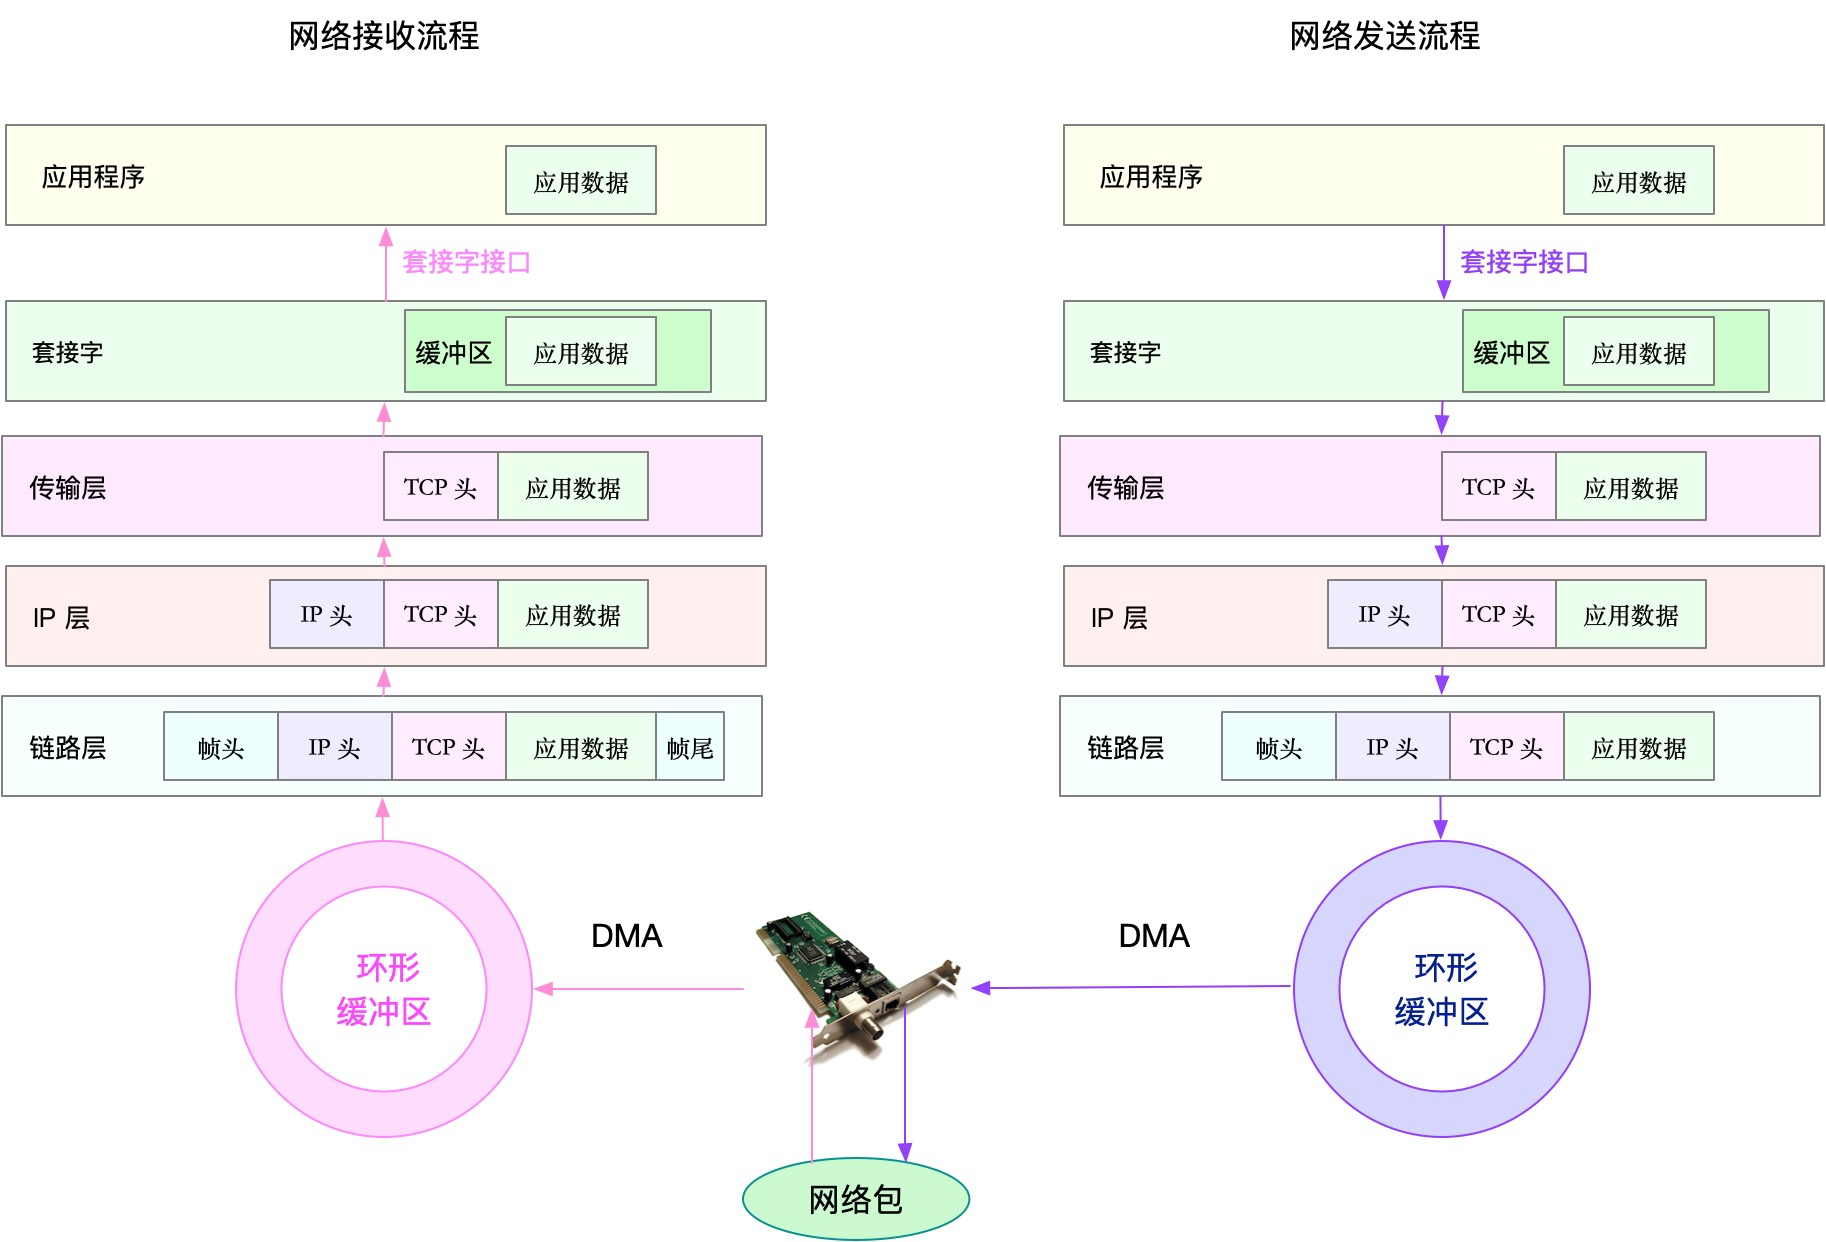
And to analyze network performance, naturally starting from several protocol layers, through usage, saturation and errors these types of performance indicators to see if there is a performance problem. such as:
- In the link layer, the network interface from the throughput, packet loss, network errors, and soft interrupt functions and unloading point of view;
- In the network layer, from the routing, fragmentation, etc. angle overlay network analysis;
- In the transport layer, starting from the principle of TCP, UDP protocol, the number of connections is analyzed, throughput, delay, retransmission equiangularly;
- In the application layer, the application layer protocol (e.g., HTTP and the DNS), requests (QPS), the angle of socket buffers and the like are analyzed.
Similar to the foregoing several resources, network performance indicators are also derived from the kernel, / proc file system (e.g., / proc / net), a network interface, and the like conntrack kernel module. These indicators also need to be monitored system monitoring. This
way, when you receive network alarms from the monitoring system can query the performance indicators of these protocol layer, thereby quickly locate performance issues.
For example, when you receive a warning network does not make sense, it can from the monitoring system, look for the loss indicators for each protocol layer, protocol layer where the confirmation packet loss. Then, the data from the monitoring system, the network bandwidth is confirmed, a buffer, connected to other hardware and software tracking number,
whether a performance bottleneck. Finally, log on to the Linux server is causing problems, with netstat, tcpdump, bcc and other tools to analyze network send and receive data, and combined with network options in the kernel as well as the principle of network protocols such as TCP, identify the source of the problem.
VII application bottlenecks
In addition to these bottlenecks from the network resources, there are many bottlenecks, in fact, directly from the application. For example, the most typical application performance problem that throughput (the number of concurrent requests) decreased, increased error rate and the response time increases.
However, in my opinion, these performance issues, although a wide variety of applications, but the source of its very nature, in fact, only three, which is the bottleneck of resources and the application itself dependent on service bottlenecks bottlenecks.
The first resource bottlenecks, in fact, or is that just mentioned CPU, memory, disk and file system I / O, network and kernel resources and other kinds of hardware and software resources, there has been a bottleneck, resulting in a limited run of the application. In this case, we can use the former
to various methods of surface analysis system resource bottlenecks modules mentioned.
The second relies bottleneck service, which is such as databases, distributed caching, middleware application, direct or indirect call service performance problems, resulting in slower response of the application, or the error rate increased. This is the cross that white should be
performance issues with using the full link tracking system can help you quickly locate the root cause of such problems.
The last, the application's own performance problems, including improper handling complex multi-threaded, deadlocks, and other higher business spending algorithm. For these problems, we have said earlier application metrics monitoring, and log monitoring, observation time-consuming key links
and internal process execution error, it can help you narrow the scope of the problem.
However, since this is the state of internal applications, external usually can not directly detailed performance data, so we need an application in the design and development, the provision of these indicators in order to monitor the system can understand the internal operating state of the application.
If after these measures still can not identify bottlenecks, you can process all kinds of analysis tools with system resources module referred to locate for analysis. such as:
- You can use strace, observation system calls;
- FIG using perf and flame, hot analysis function;
- Even using dynamic tracking technology to analyze the implementation status of the process.
Of course, the system resources and applications has always been mutual influence, a whole complement each other. In fact, many resource bottlenecks, but also due to the application itself runs. For example, the process of memory leaks will lead to less system memory; too many processes I / O
requests, will slow down the entire system I / O requests and so on.
So, in many cases, the bottleneck of resources and the application itself bottlenecks are in fact caused by the same problem, we do not need to repeat the analysis.
VIII Summary
Today, I will take you from the system resource bottlenecks and bottlenecks in the application of these two angles, the general steps carding performance issues analysis.
From the perspective of system resource bottleneck, the USE method is the most effective way, i.e. from usage, and saturation errors three aspects to analyze CPU, memory, disk and file system I / O, networks, and kernel resources restrictions and other types of hardware and software resources. Off
to the analysis of these resources, I'm bringing you a review of the previous column we analyze routine several modules together.
Bottleneck from the application point of view, we can put the source of performance problems, divided into resource bottlenecks, bottlenecks, and the application itself dependent services of these three bottlenecks.
- Resource bottlenecks with the system resource bottlenecks, the essence is the same.
- Bottleneck dependent services, you can use the full link tracking system to locate.
- The application itself is a problem, you can call through the system, hotspot function, or the application itself, and log monitoring indicators to monitor, analyze positioning.
It is noteworthy that, although I put into the system and application bottlenecks two angles, but in actual operation, both of which tend to complement each other, influence each other. The system is operating environment applications, bottlenecks in the system can lead to decreased performance of applications; and the sub application
processing design, will lead to bottlenecks in system resources. We do performance analysis is to combine the principles and applications of the operating system, ferret out the murderers causing the problem.