First, the section reviews
On one, I brought you learn with a common dynamic tracking method. The so-called dynamic tracking, that is, when the system or applications up and running by the probe provided the kernel, dynamically track their behavior,
to assist troubleshooting performance problems are the bottleneck.
Using dynamic tracking can be without modifying the code, do not restart the service, to understand the dynamic behavior of the application or kernel, this line of investigation issues, particularly not easy to reproduce the problem is particularly effective.
On Linux systems, common dynamic tracking methods include ftrace, perf, eBPF SystemTap and so on. Last time, we learned specific ftrace to use. Today, we look at several other methods together.
Two, perf
perf already our old friends. In the previous case, we use it many times to find the application or kernel hotspot function to locate performance bottlenecks. And in kernel threads with high CPU cases, we also use dynamic diagram showing the flame
event record perf, and thus more intuitive to find the problem.
However, as we use the perf record / when the top, are the first to sample the incident, and then based on the number of samples to assess the frequency of each function call. In fact, perf can do much more than that. such as,
- perf can be used to analyze the CPU cache, CPU migration, branch prediction, instruction cycle events and other hardware;
- perf also be interested in the event are only dynamic tracking.
1, perf dynamic tracking of use
Next, we were still kernel function do_sys_open, as well as user-space function readline, for example, take a look at perf use dynamic tracking.
Like ftrace, you can also perf list, query all supported events:
perf list
Then, add --event option in each of the sub-perf command, set the track events of interest. If these predefined event does not meet the actual needs, you can also use the perf probe to dynamically add. Moreover, in addition to tracing kernel events outside,
Perf function can also be used to track user space.
The first example let's look at perf, kernel function do_sys_open example. You can execute perf probe command, add do_sys_open probe:
perf probe --add do_sys_open
Added new event:
  probe:do_sys_open    (on do_sys_open)
You can now use it in all perf tools, such as:
    perf record -e probe:do_sys_open -aR sleep 1
After the probe successfully added, it can be used in all sub-perf command. For example, the output is an example of a perf record, and it can be performed within the sampling do_sys_open 10s:
perf record -e probe:do_sys_open -aR sleep 10
[ perf record: Woken up 1 times to write data ]
[ perf record: Captured and wrote 0.148 MB perf.data (19 samples) ]
And after sampling is successful, you can perform perf script, to see the results of the sampling:
perf script
            perf 12886 [000] 89565.879875: probe:do_sys_open: (ffffffffa807b290)
           sleep 12889 [000] 89565.880362: probe:do_sys_open: (ffffffffa807b290)
           sleep 12889 [000] 89565.880382: probe:do_sys_open: (ffffffffa807b290)
           sleep 12889 [000] 89565.880635: probe:do_sys_open: (ffffffffa807b290)
           sleep 12889 [000] 89565.880669: probe:do_sys_open: (ffffffffa807b290)
The actual installation of code:
root@luoahong ~]# perf list

List of pre-defined events (to be used in -e):

  alignment-faults                                   [Software
  bpf-output                                         [Software
  context-switches OR cs                             [Software
  cpu-clock                                          [Software


[root@luoahong ~]# perf probe --add do_sys_open
Added new event:
  probe:do_sys_open    (on do_sys_open)

You can now use it in all perf tools, such as:

	perf record -e probe:do_sys_open -aR sleep 1


[root@luoahong ~]# perf record -e probe:do_sys_open -aR sleep 10
[ perf record: Woken up 1 times to write data ]
[ perf record: Captured and wrote 0.153 MB perf.data (7 samples) ]
[root@luoahong ~]# perf script
            perf 10318 [001]  3749.316261: probe:do_sys_open: (ffffffff8129f030)
           sleep 10319 [000]  3749.317116: probe:do_sys_open: (ffffffff8129f030)
           sleep 10319 [000]  3749.317130: probe:do_sys_open: (ffffffff8129f030)
           sleep 10319 [000]  3749.317753: probe:do_sys_open: (ffffffff8129f030)
         systemd     1 [001]  3752.144923: probe:do_sys_open: (ffffffff8129f030)
      irqbalance  7772 [001]  3753.567150: probe:do_sys_open: (ffffffff8129f030)
      irqbalance  7772 [001]  3753.567501: probe:do_sys_open: (ffffffff8129f030)
Output, also lists the task name calling do_sys_open, processes such as PID and CPU running information. However, the open system call it, only that it has been called and not enough, we need to know is that in the end the process of playing the
open which files. Therefore, the actual application, we also want to show the parameters of these functions for tracking.
For kernel function, you can certainly go to see the kernel source, to find out all of its parameters. But there's an easier way, that is, queries directly from the debug symbol table. Execute the following command, you can know all the parameters do_sys_open:
perf probe -V do_sys_open
Available variables at do_sys_open
        @<do_sys_open+0>
                char*   filename
                int     dfd
                int     flags
                struct open_flags       op
                umode_t mode
2, after the installation retries
As can be seen from here, the file path we are concerned, is the first character pointer parameter (ie string), the parameter name for the filename. If this command fails, it shows the debug symbol table is not yet installed. Well, you can execute the following
commands after installation retries:
# Ubuntu
$ apt-get install linux-image-`uname -r`-dbgsym
# CentOS
$ yum --enablerepo=base-debuginfo install -y kernel-debuginfo-$(uname -r)
Identify the parameter names and types, parameters can be added to the probe. However, because we've added a probe of the same name, so I add this before, we need to first delete the old probe to:
# Delete the old probe
Perf the Probe --del the Probe: do_sys_open

# add parameters probe
$ Perf the Probe --add 'do_sys_open filename: String'
Added new new Event:
  the Probe: do_sys_open (ON do_sys_open with filename: String)
by You All now in use IT CAN Perf Tools, SUCH AS:
    Perf the Record -e the Probe: do_sys_open -ar SLEEP 1
After adding a new probe, re-run record and sub-command script, sampling and view records:
# Resampling record
$ Perf the Record -e the Probe: do_sys_open -ar LS

# View Results
$ Script Perf
            Perf 13593 [000] 91846.053622: the Probe: do_sys_open: (ffffffffa807b290) filename_string = "/ proc / 13596 / Status"
              LS 13596 [000] 91846.053995: Probe: do_sys_open: (ffffffffa807b290) filename_string = "/ etc / an ld.so.cache"
              LS 13596 [000] 91846.054011: Probe: do_sys_open: (ffffffffa807b290) filename_string = "/ lib / the x86_64-Linux-GNU / libselinux.so .1 "
              LS 13596 [000] 91846.054066: the probe: do_sys_open: (ffffffffa807b290) filename_string =" / lib / x86_64-the GNU-Linux / libc.so.6 "
              ...
# Do not forget to remove after use to complete the probe
$ perf probe --del probe: do_sys_open
Now, you can see every time you open a file open call. However, this result is not looking very familiar with it?
In fact, when the system we use strace to track the process of calling, but also often see the shadow of these dynamic libraries. For example, when using the tracking strace ls, you can get the following results:
strace ls
...
access("/etc/ld.so.nohwcap", F_OK)      = -1 ENOENT (No such file or directory)
access("/etc/ld.so.preload", R_OK)      = -1 ENOENT (No such file or directory)
openat(AT_FDCWD, "/etc/ld.so.cache", O_RDONLY|O_CLOEXEC) = 3
...
access("/etc/ld.so.nohwcap", F_OK)      = -1 ENOENT (No such file or directory)
openat(AT_FDCWD, "/lib/x86_64-linux-gnu/libselinux.so.1", O_RDONLY|O_CLOEXEC) = 3
...
You want to estimate, since strace can get similar results, in turn, is easy to operate, perf why should we use it?
3, since strace can get similar results, in turn, it is easy to operate, perf why should we use it?
In fact, many people only see the benefits of strace easy to use, but ignored the impact of its process performance. In principle, strace based system call ptrace implementation, which brings up two questions.
- Since ptrace system call, it is necessary to switch the kernel mode and user mode. When comparing the number of events for a long time, busy switching bound to affect the performance of existing services;
- ptrace need the help of SIGSTOP signal suspended the target process. This signal control and process hangs, it will affect the behavior of the target process.
So, in performance-sensitive applications (such as databases), I do not recommend you use strace (or other performance-based ptrace tool) to troubleshoot and debug.
Inspired by strace, combined utrace mechanism in the kernel, perf also provides a trace subcommand, is the tool of choice to replace strace. Relative to the ptrace mechanism is, perf trace kernel-based event, than the natural process of tracking
much better performance.
perf trace using the method shown below, with strace actually very much alike:
perf trace ls
         ? (         ): ls/14234  ... [continued]: execve()) = 0
     0.177 ( 0.013 ms): ls/14234 brk(                                                                  ) = 0x555d96be7000
     0.224 ( 0.014 ms): ls/14234 access(filename: 0xad98082                                            ) = -1 ENOENT No such file or directory
     0.248 ( 0.009 ms): ls/14234 access(filename: 0xad9add0, mode: R                                   ) = -1 ENOENT No such file or directory
     0.267 ( 0.012 ms): ls/14234 openat(dfd: CWD, filename: 0xad98428, flags: CLOEXEC                  ) = 3
     0.288 ( 0.009 ms): ls/14234 fstat(fd: 3</usr/lib/locale/C.UTF-8/LC_NAME>, statbuf: 0x7ffd2015f230 ) = 0
     0.305 ( 0.011 ms): ls/14234 mmap(len: 45560, prot: READ, flags: PRIVATE, fd: 3                    ) = 0x7efe0af92000
     0.324 Dockerfile  test.sh
( 0.008 ms): ls/14234 close(fd: 3</usr/lib/locale/C.UTF-8/LC_NAME>                          ) = 0
     ...
Actual test code is as follows:
[root@luoahong ~]# perf trace ls
         ? (     ?   ): ls/10348  ... [continued]: execve()) = 0
     0.386 ( 0.049 ms): ls/10348 brk(                                                                  ) = 0xae0000
     0.610 ( 0.090 ms): ls/10348 mmap(len: 4096, prot: READ|WRITE, flags: PRIVATE|ANONYMOUS            ) = 0x7fe83213c000
     0.755 ( 0.048 ms): ls/10348 access(filename: 0x31f3abd0, mode: R                                  ) = -1 ENOENT No such file or directory
     0.847 ( 0.052 ms): ls/10348 open(filename: 0x31f394c4, flags: CLOEXEC                             ) = 3
     0.947 ( 0.042 ms): ls/10348 fstat(fd: 3</usr/lib64/libpthread-2.17.so>, statbuf: 0x7fff6a5b9360   ) = 0
     1.036 ( 0.049 ms): ls/10348 mmap(len: 33764, prot: READ, flags: PRIVATE, fd: 3                    ) = 0x7fe832133000
     1.394 ( 0.047 ms): ls/10348 close(fd: 3</usr/lib64/libpthread-2.17.so>                            ) = 0
     1.500 ( 0.053 ms): ls/10348 open(filename: 0x3213c640, flags: CLOEXEC                             ) = 3
     1.599 ( 0.082 ms): ls/10348 read(fd: 3</usr/lib64/libpthread-2.17.so>, buf: 0x7fff6a5b9520, count: 832) = 832
     1.725 ( 0.046 ms): ls/10348 fstat(fd: 3</usr/lib64/libpthread-2.17.so>, statbuf: 0x7fff6a5b93c0   ) = 0
     1.820 ( 0.106 ms): ls/10348 mmap(len: 2255184, prot: EXEC|READ, flags: PRIVATE|DENYWRITE, fd: 3   ) = 0x7fe831cf5000
     2.027 ( 0.350 ms): ls/10348 mprotect(start: 0x7fe831d19000, len: 2093056                          ) = 0
     2.424 ( 0.056 ms): ls/10348 mmap(addr: 0x7fe831f18000, len: 8192, prot: READ|WRITE, flags: PRIVATE|DENYWRITE|FIXED, fd: 3, off: 143360) = 0x7fe831f18000
     2.533 ( 0.053 ms): ls/10348 mmap(addr: 0x7fe831f1a000, len: 6480, prot: READ|WRITE, flags: PRIVATE|ANONYMOUS|FIXED) = 0x7fe831f1a000
However, perf trace can also be system-level call tracking system (ie, tracking all processes), and strace can track specific process.
The second example is a library function perf user space . Library function call to readline bash for example, use similar methods, you can trace library calls (based on uprobes).
Readline action, the user input is read from the terminal, and the data returns to the caller. So, with the open system call is different, we are more concerned about the result of calling the readline.
We execute the following command, specify bash binary files through -x path, you can track the dynamic library function. This is actually tracking all user commands executed in bash:
Is # / bin / bash added readline probe
$ Perf the -X-Probe / bin / bash '+0 readline% return ($ retval): String'

# sampling record
$ Perf Record -e probe_bash: SLEEP. 5 -Ar readline__return

# View Results
Script Perf $
    bash 13348 [000] 93939.142576: probe_bash: readline__return: (5626ffac1610 <- 5626ffa46739) arg1 = "LS"

# deleted after tracing is complete probe
$ perf probe --del probe_bash: readline__return
Of course, if you are unsure probe format, or by the following command to query all supported functions and function parameters:
Kernel functions with similar, if you want to see the name of the function and application of the general parameters, then the binary file of the application, the same need to include debugging information.
Three, eBPF and BCC
ftrace and perf functions have been rich, but they have a common flaw, it is not flexible enough, not free to expand as DTrace as a script.
The eBPF is the Linux version of DTrace, free to expand (these extensions by LLVM bytecode is converted to the BPF, loaded into the kernel execution) by the C language. The picture below, it means the working principle eBPF track: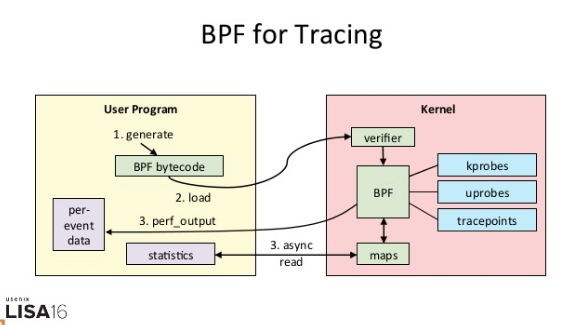
As you can see from the figure, eBPF need to perform three steps:
- Generating a tracking BPF bytecode program from a user;
- Loaded into the kernel running;
- The output to the user space.
So, from the use of terms, eBPF ftrace and perf than we saw earlier, is more complicated.
In fact, in the course of eBPF execution, compiling, loading as well as maps and other operations, for all the track program for both generic. These processes by Python abstract up, it was born BCC (BPF Compiler Collection).
BCC to eBPF various event sources (such as kprobe, uprobe, tracepoint, etc.) and data manipulation (called Maps), are also converted into a Python interface (also supports lua). Thus, when using BCC dynamic tracking, write
a simple script on it.
Note, however, because of the need to interact with the kernel data structures, the real core of the event processing logic, we still need to be written in C language.
As for BCC installation method, in the case of a cache memory module, I have been introduced. If you have not installed the following commands can be executed to install (installation of other systems, please refer to here):
# Ubuntu
sudo apt-key adv --keyserver keyserver.ubuntu.com --recv-keys 4052245BD4284CDD
echo "deb https://repo.iovisor.org/apt/$(lsb_release -cs) $(lsb_release -cs) main" | sudo tee /etc/apt/sources.list.d/iovisor.list
sudo apt-get update
sudo apt-get install bcc-tools libbcc-examples linux-headers-$(uname -r)

# REHL 7.6
yum install bcc-tools
After installation, BCC would all examples (including Python and lua), placed in / usr / share / bcc / examples directory:
ls /usr/share/bcc/examples
hello_world.py  lua  networking  tracing
Next, or to do_sys_open for example, we take a look at how to achieve the same dynamic tracking eBPF and BCC.
Usually, we can apply the BCC, split into the following four steps.
First, with all Python modules using the same method, prior to use, to use to import the module:
from bcc import BPF
Second, we need to define a function of events and handle events. This function needs to be written in C language, the role of BPF object initialization just imported. The C language processing function, to be sent to BPF processing module as a string:
# define BPF program (""" is used for multi-line string).
# '#' indicates comments for python, while '//' indicates comments for C.
prog = """
#include <uapi/linux/ptrace.h>
#include <uapi/linux/limits.h>
#include <linux/sched.h>
// define output data structure in C
struct data_t {
    u32 pid;
    u64 ts;
    char comm[TASK_COMM_LEN];
    char fname[NAME_MAX];
};
BPF_PERF_OUTPUT(events);

// define the handler for do_sys_open.
// ctx is required, while other params depends on traced function.
int hello(struct pt_regs *ctx, int dfd, const char __user *filename, int flags){
    struct data_t data = {};
    data.pid = bpf_get_current_pid_tgid();
    data.ts = bpf_ktime_get_ns();
    if (bpf_get_current_comm(&data.comm, sizeof(data.comm)) == 0) {
        bpf_probe_read(&data.fname, sizeof(data.fname), (void *)filename);
    }
    events.perf_submit(ctx, &data, sizeof(data));
    return 0;
}
"""
# load BPF program
b = BPF(text=prog)
# attach the kprobe for do_sys_open, and set handler to hello
b.attach_kprobe(event="do_sys_open", fn_name="hello")
The third step is to define an output function, and the output of the function with the BPF event binding:
# process event
start = 0
def print_event(cpu, data, size):
    global start
    # event’s type is data_t
    event = b["events"].event(data)
    if start == 0:
            start = event.ts
    time_s = (float(event.ts - start)) / 1000000000
    print("%-18.9f %-16s %-6d %-16s" % (time_s, event.comm, event.pid, event.fname))

# loop with callback to print_event
b["events"].open_perf_buffer(print_event)
The final step is to execute the event loop, began tracking the call do_sys_open:
# print header
print("%-18s %-16s %-6s %-16s" % ("TIME(s)", "COMM", "PID", "FILE”))
# start the event polling loop
while 1:
    try:
        b.perf_buffer_poll()
    except KeyboardInterrupt:
        exit()
We put a few steps above the code, save it to a file trace-open.py, and then you can use Python to run. If all goes well, you can see the following output:
python trace-open.py
TIME(s)            COMM             PID    FILE
0.000000000        irqbalance       1073   /proc/interrupts
0.000175401        irqbalance       1073   /proc/stat
0.000258802        irqbalance       1073   /proc/irq/9/smp_affinity
0.000290102        irqbalance       1073   /proc/irq/0/smp_affinity
From the output, you can see irqbalance process (you may also have other environmental processes) is opening a lot of documents, and irqbalance rely on the contents of these documents read to execute the interrupt load balancing.
Through this simple example, you can also find, eBPF and BCC's use, in fact, there is a higher threshold than ftrace and perf. BCC want to develop with its own dynamic tracking program, at least be familiar with C language, Python language, tracked event or function
features (such as parameters and returns the format kernel function) as well as various methods of data manipulation eBPF provided.
However, because a strong flexibility, although eBPF a certain threshold in use, but can not stop it become the most popular, most talked about dynamic tracking technologies.
Of course, the BCC also built many packages have been developed a good utility installed by default to the / usr / share / bcc / tools / directory, their use scenario shown below:

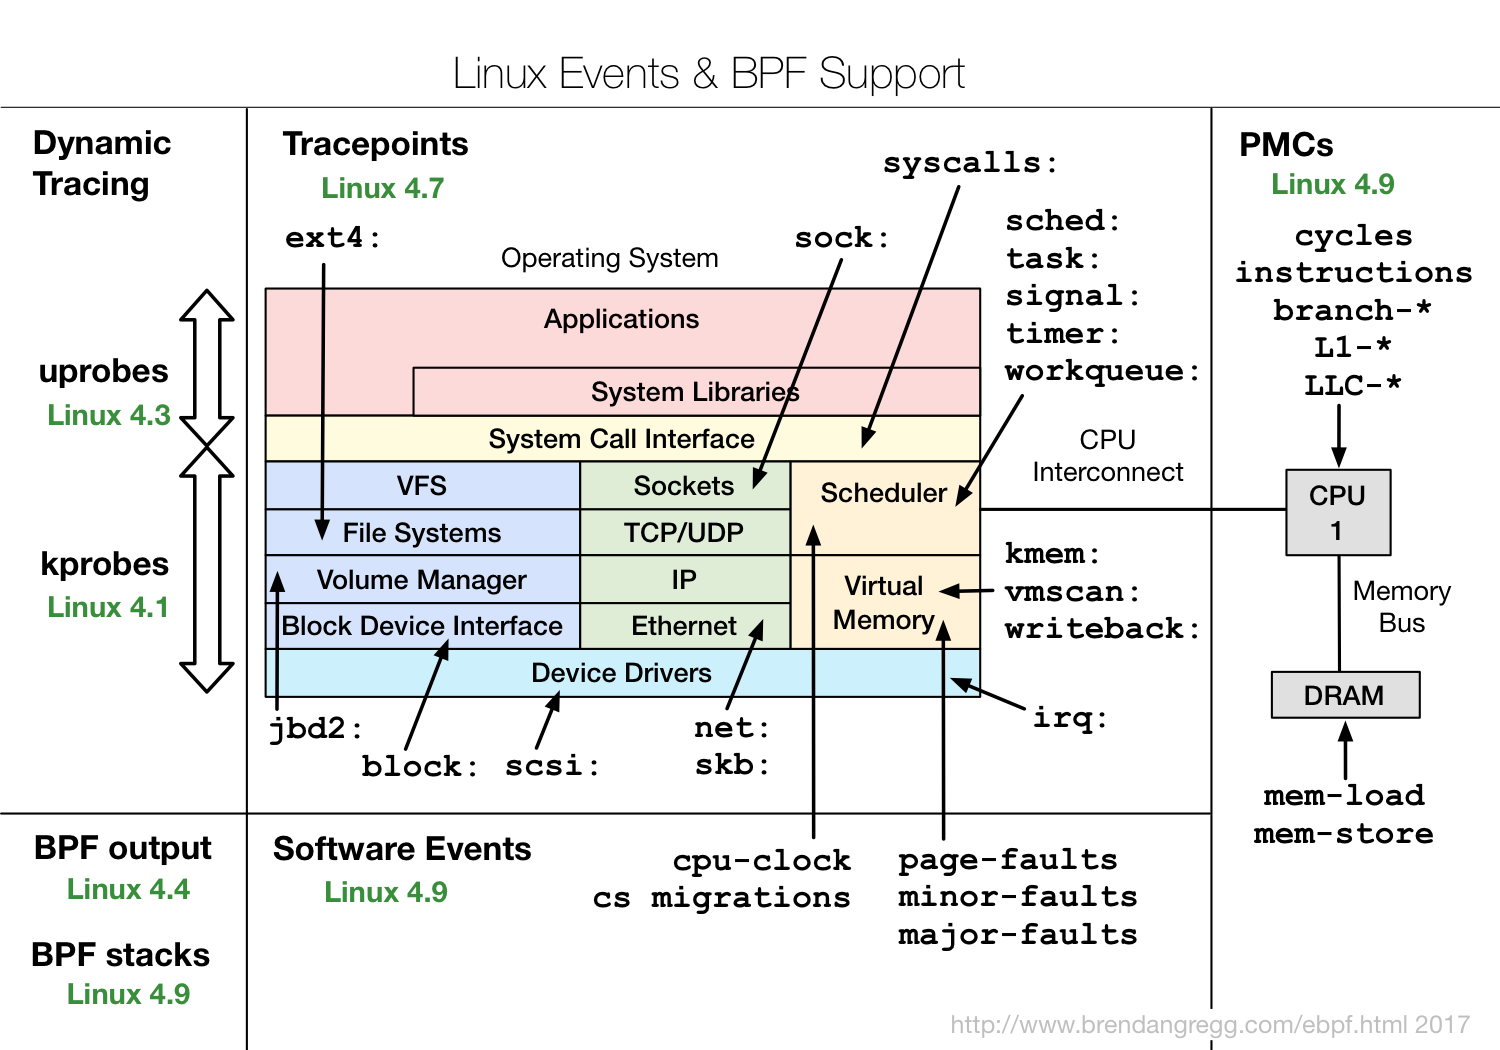
These tools can generally be directly used. And in the preparation of other dynamic tracking script, they are also the best reference. However, one thing you need to pay special attention, a lot of new features eBPF, we need a relatively new kernel version (shown below as
shown). If some tools can not run, it is probably because of the use of the current kernel does not support features.
Four, SystemTap and sysdig
In addition ftrace, perf, eBPF BCC and the aforementioned, SystemTap and sysdig dynamic tracking tools are also commonly used.
1、SystemTap
SystemTap is a kind of freedom can be extended dynamic tracking script. Before eBPF appear,
SystemTap is a Linux system, the functions of the closest DTrace dynamic tracing mechanism. Note, however, SystemTap in a long time have drifted away from the kernel (and since eBPF since its birth, has been rooted in the kernel).
So,, SystemTap is only easy to use from the stability in RHEL system is prone to all kinds of unusual problems in other systems. Of course, in turn, support the old version 3.x and other kernel, SystemTap is relative to
a eBPF great advantage.
2, sysdig
sysdig is with the popularity of the birth of container technology, mainly used for container dynamic tracking. sysdig brings together some of the advantages of column performance tools, it can be said to be set 100 of the director. I used this formula to represent the characteristics sysdig:
sysdig strace + = + htop tcpdump lsof + + + iftop the Inspect Docker.
In the latest version (kernel version> = 4.14), sysdig also can be extended by eBPF, it can also be used to track a variety of functions and events in the kernel.
Fifth, how to choose tracking tool
Here, you may also feel a big head, so many dynamic tracking tools, in the end how to choose the actual scene it? Again, select a specific performance tool, it is necessary to start from the specific works.
These two classes, we have the principle of common tools and features are introduced, you can start to think for themselves distinguish between what the tool of choice for different scenes. such as:
- In the scenario does not require high flexibility, performance events using perf sampled, and then analyzed with the aid of FIG flame, is the most common method;
- The need for an event or function call for statistical analysis (such as observation of different sizes of I / O distribution), you must use SystemTap or eBPF, data processing is performed by some custom scripts.
Here, I summarize several common dynamic tracking usage scenarios, and are recommended for tools. You can save this table, easy to find and use their own.
VI Summary
Today, I take you to learn the perf, eBPF BCC and other dynamic tracking method, and summarizes the different scenarios how to select the dynamic tracking method
On Linux systems, common dynamic tracking methods, including ftrace, perf, eBPF SystemTap and so on. In most performance problems using perf with flame chart is a good way. If you can not meet these requirements, then:
In the new version of the kernel, eBPF BCC is the most flexible and dynamic tracking method; but in the old version of the kernel, especially in the RHEL system, since eBPF support is limited, SystemTap is often the better choice.
In addition, when using dynamic tracking technology, a detailed analysis of the target in order to get information, the general need to debug the kernel symbol table, and applications. Dynamic tracking actually carried out on these symbols (including functions and events), it is easy to read and understand the symbol
number, help speed up the process of dynamic tracking.