iperf is another section for the flow of software testing, mainly running on Windows systems and Android hand Machine / PAD ( IOS system download surcharge) .
A work in Server mode, additionally a work in Client mode, the input Server 's test ip address can be tested from the Client to the Server the direction of flow , the test apparatus by changing the operating mode, to complete the vertical lines of the flow test.
1. Iperf installation
1.1 Download: https://iperf.fr/iperf-download.php
1.2 linux environment installation , use the command to install
#gunzip –c iperf-<version>.tar.gz | tar –xvf -
#cd iperf-<version>
#./configure
#make
#make install
1.3 windows environments , directly extract from the iperf.exe and cygwin1.dll copied to the % systemroot% directory (the root directory) can be , but also into the iperf current folder type commands.
2. Iperf main function
2.1.TCP
Measuring network bandwidth
Report size and observations MSS / MTU value
Support TCP window value by the socket buffer
When a P threads or Win32 threads are available to support multithreading. The client and server simultaneously support multiple connections
2.2.UDP
Clients can create the specified bandwidth UDP stream
Measurement loss
Measure the delay
Multicast support
When a P thread is available to support multithreading. The client and server support simultaneous multiple connections (not supported by Windows)
2. 3. Other
Where appropriate, the options can be used in K (kilo-) and M (mega-). 131072 bytes can be replaced with, for example, 128K.
You can specify the total run time, or even the total amount of data transmission can be provided.
In the report, choose the most suitable for the data unit.
The server supports multiple connections, rather than waiting for a single-threaded test.
Duplicated network bandwidth, packet loss and the fluctuation in the specified time interval.
The server can run as a background process.
Server-side as a running Windows service.
Typical test data stream using link-layer compression impact available bandwidth.
Support the transmission of specified files, qualitative and quantitative tests.
2 .4 parameters introduced
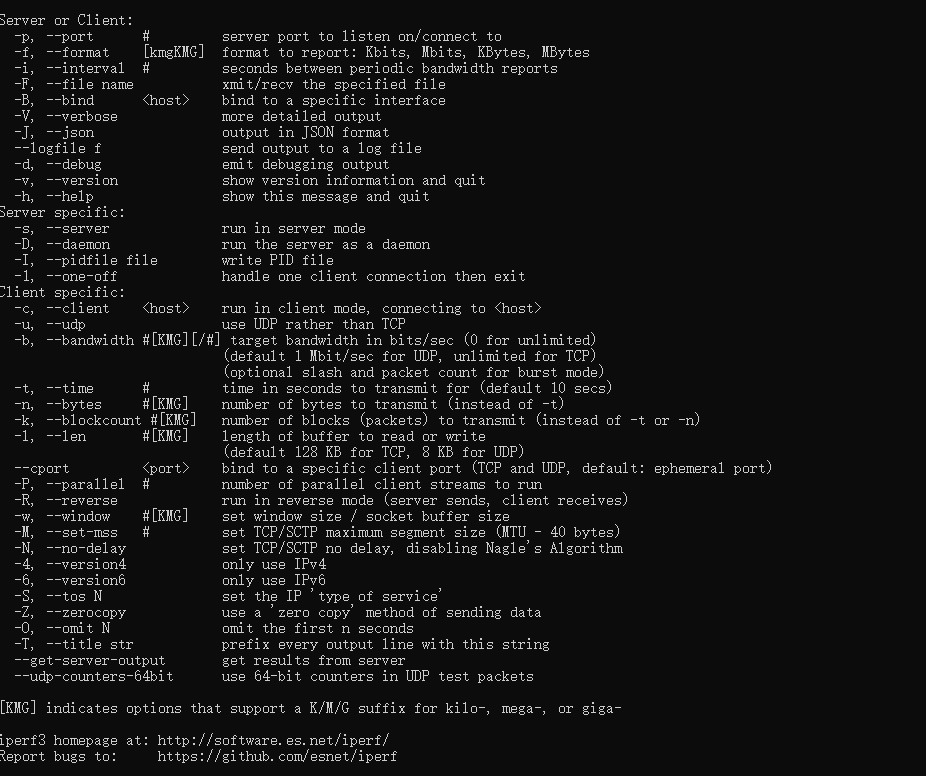
Note: The parameters are case sensitive
3. Network Bandwidth Test
Use iperf3 test, at the same time to have a program implementing server-side and client-side, so that they transmit messages to each other for testing. Contract testing needs into UDP and TCP test test, which requires a server -u command to distinguish between listening agreement. Test TCP protocol can not be calculated delay and packet loss rate, but also transmission bandwidth can not be specified.
3.1 Testing single-threaded TCP transmission speed
Server start: iperf3 -s -p 54321 -i 1
Start Client Input: iperf3-c 10.101.70.247 -p 54321-i 1 -t 10 -w 10K
-c: client mode, followed by server ip
-p: followed by the server listening port
-i: setting the bandwidth reporting interval, in seconds
-t: setting the test duration in seconds
-w: set tcp window size, generally can not set, the default can
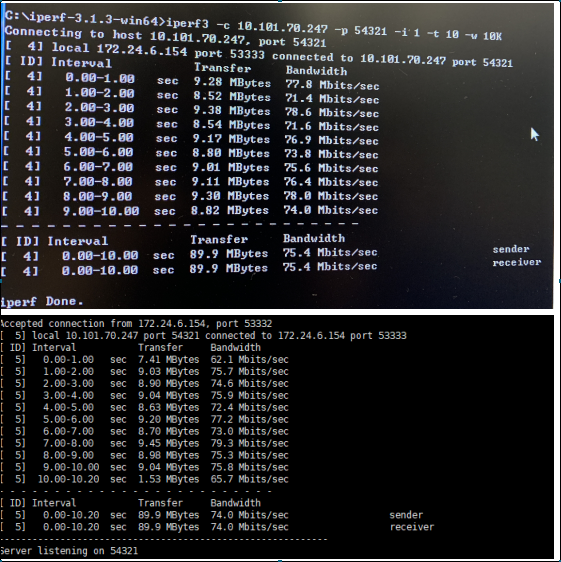
Interval indicates the time interval. Transfer time interval represents the amount of transferred data inside. Bandwidth is the time interval in the transmission rate. The last line is this test statistics. Bandwidth test shows an average of 74.0Mbit / sec.
Parameters : - T change the operation time , - I change the output frequency
(Network speed unit conversion https://wenku.baidu.com/view/bab6102dbd64783e09122b1d.html )
3.2 testing multi-threaded TCP transmission speed
Start Client Input: iperf3-c 10.101.70.247-i 1 -t 5 -P 3
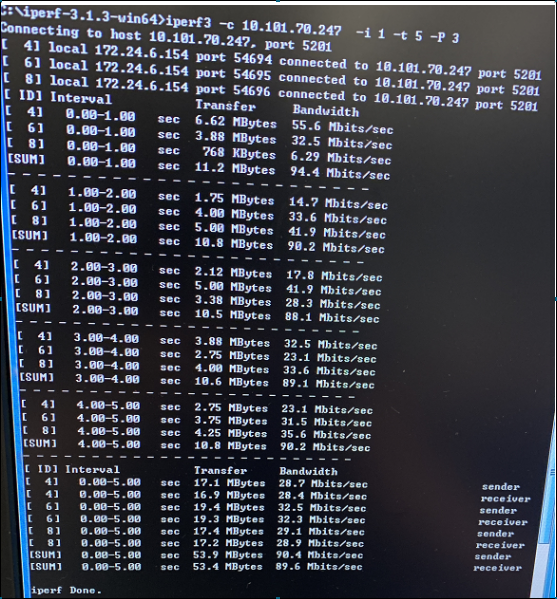
Parameters : -P parameter to set the number of multi-threaded, multi-threading by using, network throughput can be increased to some extent ; -n specify the amount of data to be transmitted. Using the parameter -n, -t parameter failure After the specified size transport packets is ended automatically.
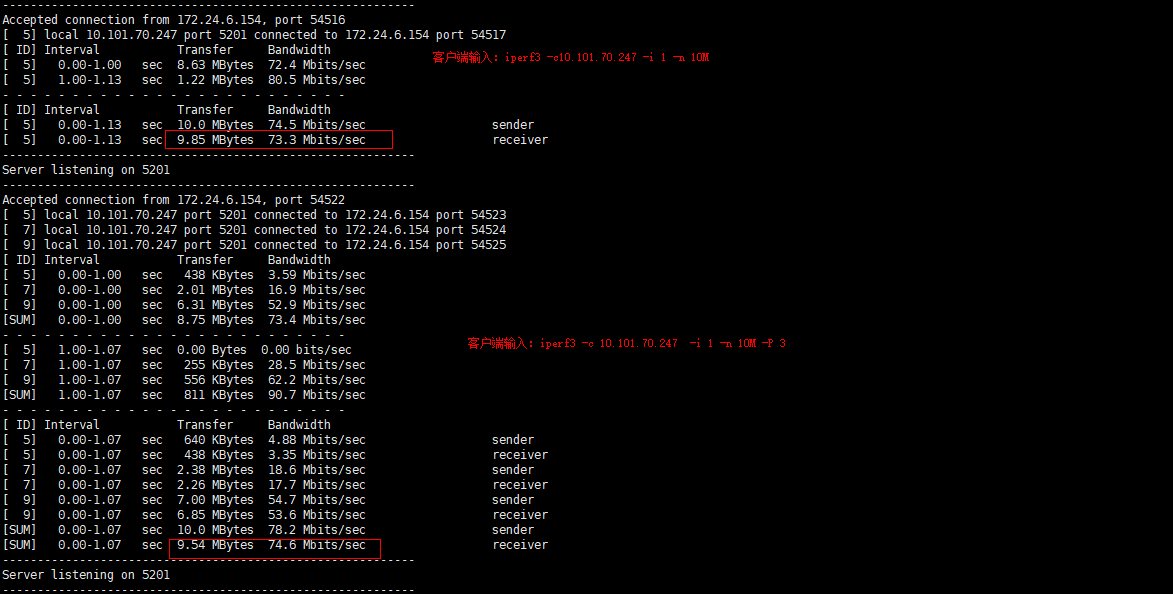
By opening the three threads -P parameter, the transmission time point of view, the transmission data 10M, the elapsed time of 1.07 seconds, drop a little before the transmission time than single-threaded , on average bandwidth rate, from the previous single-threaded 73.4Mbits / sec up to 73.4Mbits / sec, can be seen from this result, multithreading improve transmission performance.
. 3 . . 3 Test threaded UDP transmission speed
Server start: iperf3 -s -i 1
Start client input: iperf3 -c 10.101.70.247 -i 1 -t 5 -u -b 50M
-c: client mode, followed by server ip
-p: After receiving the server listening port
-i: set the bandwidth reporting interval in seconds
-t: test set length of time, in seconds
-b: Set udp transmission bandwidth, the unit 'bit / S
-u: UDP provided
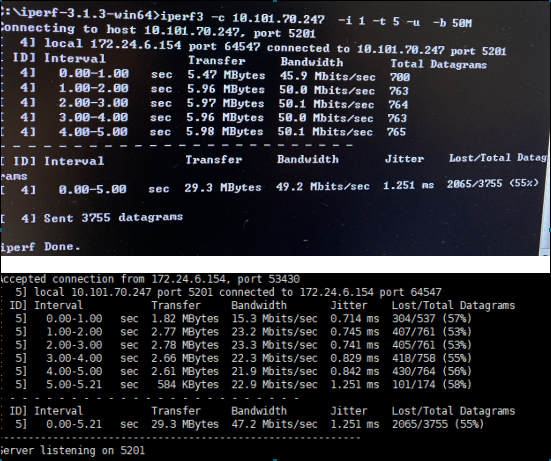
To obtain the bandwidth data, need -b constantly increased bandwidth value of the bandwidth of the client to the server side until a slight loss occurs up, then the server side shown is the throughput of the system under test.
Interval indicates the time interval. Transfer time interval represents the amount of transferred data inside. Bandwidth is the time interval in the transmission rate. Jitter is a jitter, lost / total number of packet loss, Datagrams for the number of packets.
3 . 4 test multithreaded UDP transmission speed
Start Client Input : iperf3 -c 10.101.70.247 -p 54321 -i 1 -t 4 -u -P 3 -b 30M

4. Test UDP packet loss and delay
iperf may also be used UDP packet throughput, packet loss rate and delay metrics, but since the UDP protocol is a lightweight non-oriented transport protocol connection, and does not provide reliable data transmission services, so the UDP concerns applications how fast is not transmitting data, but its packet loss and latency indicators. By -u parameters can test UDP transmission performance applications .
l Iperf test UDP -time performance, the client can specify the UDP data flow rate. When the client sends the data transmission delay between data packets will be calculated based on the rate provided by the client.
l client may also specify the size of the datagram transmission. Each packet comprises a data transmission ID number to uniquely identify packets, based on the server ID to determine the loss of data packets and scrambled number.
l when the UDP packet size of the entire packet can be set into the IP packet layer (Packet) within the time, then the UDP measured data packet loss is the IP layer packet loss, which provides an effective methods of test packet loss situation.
l datagram transmission delay jitter (the Jitter) tests performed by the server, the client sends a data packet sent with a time stamp, the server calculates a transmission delay jitter based on the time information and the time stamp of the received message. Reflect transmission delay jitter during transmission is smooth. Since it is a relative value, and so does not require client server time synchronization
Start client input : iperf3 -c 10.101.70.247 -u -b 100M -n 2G
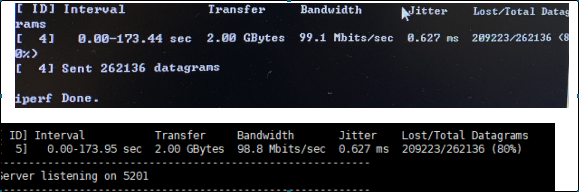
Jitter columns represent time jitter, otherwise known transmission delay, Lost / the Total column indicates the number of lost packets and the total data packet, the latter 80% is the ratio of the average packet loss, Datagrams column shows the total number of transmitted datagrams .
5 . Iperf works
Iperf main function is to test the performance of TCP-based connection to a particular path, we know the most basic measures to adjust the TCP connection is to adjust the TCP window size, window size to control the size of the data at any node in the network may exist. If the value is too small, the sender will be in an idle state at a certain time, thus affecting the performance of the transmission. Theoretical value of the TCP window size and the round trip delay link bottleneck bandwidth product of:
TCP_Window=Bottleneck_Bandwidth*Round_Trip_Time
E.g. bottleneck link bandwidth is 45Mbps, 42ms for the round-trip delay (may be tested by ping), then the theoretical value of the window:
45Mbps*42ms=(45*e6)*(42*e-3)=1890000 bits=230KByte
I.e., the window size can be adjusted reference theoretical value, gradually increase or decrease in the value, the best results can be obtained.
Principle Iperf test TCP bandwidth is relatively simple, that is, the connection is established (three-way handshake), the client sends packets of a certain size, and note the time in sending or client sends data within a certain time on the client side and server side and note the total data transmitted. The total time is equal to the total data size of the bandwidth of the transmission divided by the transmission. For the server side, that is, the time the connection is established, the received data is divided by the total bandwidth of the server side is the time measured flowers. MSS size directly by TCP kernel interface function.
When testing the performance of UDP Iperf, clients can specify a rate of UDP data stream. When the client sends the data packet transmission delay between the data rates calculated according to the customer. In addition customers can also specify the size of the datagram to send. For each transmitted datagram containing an ID number used to uniquely identify the message. The server determines the data packet loss and disorder based on the ID number. When the size of the UDP packet can be disposed into the entire packet IP layer packet (Packet) within, the UDP measured data packet loss is the loss of data packets IP layer. This provides an effective method of testing packet loss situations. Datagram transmission delay jitter (the Jitter) tests performed by the server, the client sends a data packet sent with a time stamp, the server calculates a transmission delay jitter based on the time information and the time stamp of the received message. Reflect transmission delay jitter during transmission is smooth. Since it is a relative value, and so it does not require client server time synchronization.
Parameter Description
-s start in server mode, eg: iperf -s. Server is the receiver of the data.
-c host to start the client mode, host server is the remote address, eg: iperf -c 222.35.11.23. Client-side end of the data sent.
General parameters
-f [kmKM] respectively display the report Kbits, Mbits, KBytes, MBytes, Mbits in default units, eg: iperf -c 222.35.11.23 -f K
-i sec displayed in seconds reporting interval, eg: iperf -c 222.35.11.23 -i 2
-l buffer size, default is 8KB, eg: iperf -c 222.35.11.23 -l 16
-m mtu show tcp maximum value
-o The output report and error messages to a file eg: iperf -c 222.35.11.23 -o ciperflog.txt
Eg -p port side port used by the specified server or client connected: iperf -s -p 9999; iperf -c 222.35.11.23 -p 9999
-u using udp protocol
-w Specifies the TCP window size, default is 8KB
-B binding address or a host interface (host using the parameter when a plurality of addresses or interfaces)
-C compatible with older versions (when the client-side and server-side version is not the same when used)
-M set the maximum value of the TCP packet mtu
-N not set the TCP delay
Ipv6 packet transmission -V
server -specific parameters
-D as a service run ipserf, eg: iperf -s -D
-R iperf stop service for -D, eg: iperf -s -R
client terminal specific parameters
-d simultaneous two-way transmission test
-n specified number of bytes transferred, eg: iperf -c 222.35.11.23 -n 100000
-r bi-directional transmission test alone
-t test time, 10 seconds by default, eg: iperf -c 222.35.11.23 -t 5
-F specifies the need to transfer files
-T ttl specified value
Example:
Use iperf -s command Iperf start as server mode, client mode to start using iperf -c on the client.
iperf -c 59.125.103.56 -f K -i 2 -w 300K
Reporting interval is set to 2 seconds, the server and client of the TCP window are open to 300KB
iperf -c 59.125.103.56 -f K -i 2 -w 300K –n 1000000
Test data transmission from 1MB
iperf -c 59.125.103.56 -f K -i 2 -w 300K –t 36
Test lasts 36 seconds
iperf -c 59.125.103.56 -f K -i 2 -w 300K -n 10400000 –d
Bi-directional transmission test
iperf -c 59.125.103.56 -f K -i 2 -w 300K –u
UDP test
Wherein the meaning -i parameter is periodic reporting interval (interval The), seconds; in the above example, a report every 2 seconds represents the bandwidth information.