Original link: http://tecdat.cn/?p=6322
When we include continuous variables as covariates in the regression model, it is important that we use the right (or approximately correct) functional form. For example, results for continuous continuous covariates X and Y, may be the expected value of Y is X ^ and X 2 is a linear function instead of a linear function of X. A simple but nonetheless often effective approach is to simply view the X-Y scatter plot to visually evaluate.
For binary outcomes we usually use logistic regression modeling, things are not so easy (at least try to use the graphical method). First, the information X Y scattergram now no correlation between the shape of the Y and X, and therefore a logistic regression model should contain X. To illustrate how, using R let mimics some (X, Y) data, wherein Y follows the logistic regression, wherein in X into the linear model:
set.seed(1234)
n < -  1000
x < -  rnorm(n)
xb < -  -2 + x
pr < -  exp(xb)/(1 + exp(xb))
y < -  1 *(runif(n)<pr)
Now, if we map the Y to X, we get the following results


Due to the nature of Y is two yuan, which is no information on how X, Y-dependent.
LOWESS technical chart
A method for solving this problem is to draw a single (Y, X) values, instead of the average value of Y plotted with X varying smooth line. The simplest type of smoothing is a running average, which at a given value of X = x, the line is equal to the average Y values (possibly weighted in some way). The average value of each value of X is then connected together to obtain a smooth line.
The LOWESS technique is slightly more sophisticated version, wherein, instead of a (possibly weighted) average of a neighborhood of X = x Y calculated value, we fit regression line (e.g., linearly) to the data about the X = X. By doing so, we assume that the local association YX is linear, but do not assume it is a global linear. The advantage over a simple mean is that we need less data to get a good estimate of X depends on Y.
Logistic regression function in the form of checks
This gives the figure shows that the average value in the X-Y is not linear, but may be quadratic. How do we coordinate this with us from the fact that X into the linear model-generated data? Explained in logistic regression, we'll probability of Y = a logit model as a function of the predictors, rather than probability itself. For the probability is not close to zero or one, logit function is actually very close to linear, but the probability is not close to zero or a data set, which is not a problem.
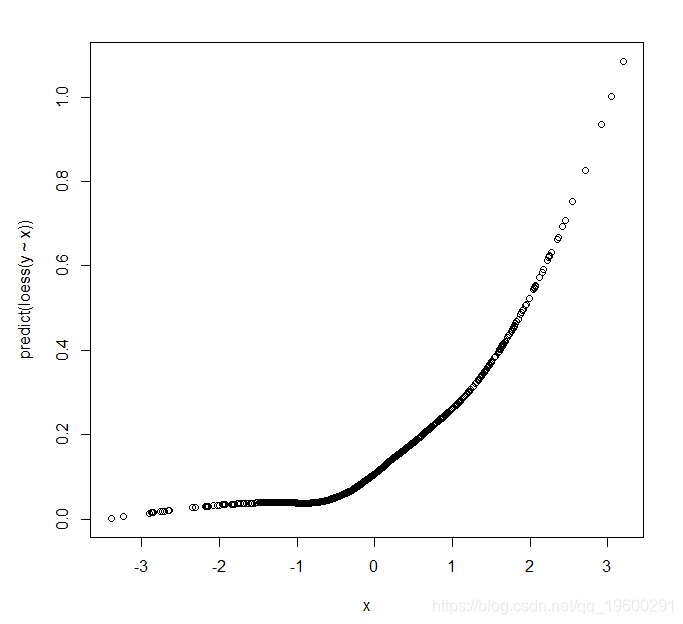
![]()
We can overcome this problem by plotting the estimated probability (Y average value) for our calculations of logit. In Stata in , there is a logit LOWESS command options, which gives a smooth logit plots of X a. In R we can write a short function to do the same thing:
logitloess < -  function(x,y,s){

logit < -  function(pr){
 }

if(missing(s)){
	locspan < -  0.7
} else {
	locspan < -  s
}

 pi < -  pmax(pmin(loessfit,0.9999),0.0001)
logitfitted < -  logit(pi)

plot(x,logitfitted,ylab =“logit”)

}
In order to generate smooth logit plots, we now call our only function with the X and Y:
logitloess (X, Y)
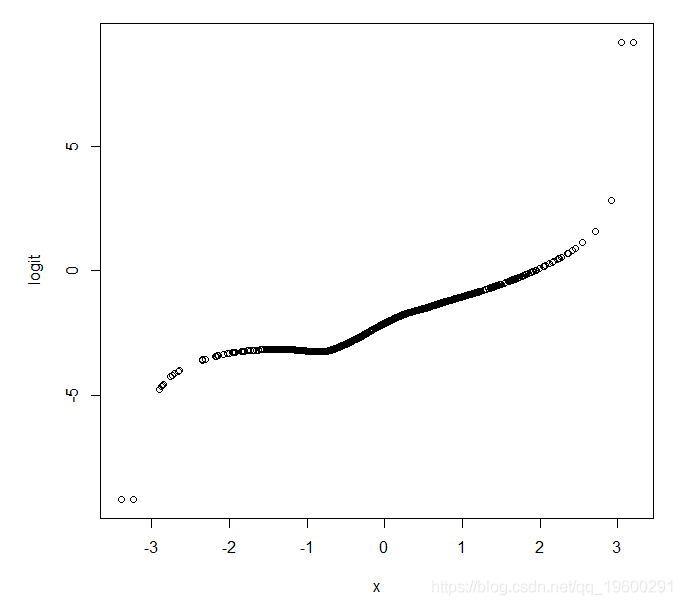
![]()
Also note that in the few areas X value, the estimated logit will be more accurate. Here we generate a normal distribution of X, we can see only a small X value is greater than or less than -2 +2 from the drawing (as we expect!). Therefore, we should not be overly concerned about the estimated logit values of these areas in the X space.
Test case has a secondary effect of X
As another example, we now re-simulated our data, but the probability of Y = logit specified covariates X is a quadratic function, rather than linear:
set.seed(12345)
n < -  1000
x < -  rnorm(n)
xb < -  -2 + x ^ 2
pr < -  exp(xb)/(1 + exp(xb))
y < -  1 *(runif(n)<pr)
logitloess(X,Y)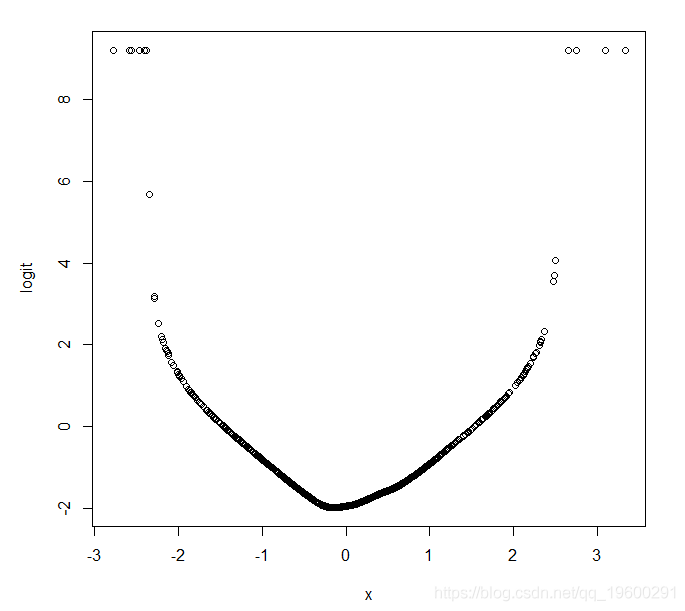
![]()
Precautions
We see here the approach is clearly not perfect, there will be more or less used in different situations. For small data set (e.g., n = 50), there is not enough data to actually nonparametric estimate depends on how the average value of Y X, and therefore not really useful. Even with large data sets, loess figure proposed functional form may seem strange, purely because of imprecise because some part of the space X / distributions do not have much data.
Thank you for reading this article, you have any questions please leave a comment below!
Big Data tribe - Chinese professional third-party data service providers to provide customized one-stop data mining and statistical analysis consultancy services
Statistical analysis and data mining consulting services: y0.cn/teradat (Consulting Services, please contact the official website customer service )
![]()
QQ:3025393450
![]()
[Service] Scene
Research; the company outsourcing; online and offline one training; data collection; academic research; report writing; market research.
[Tribe] big data to provide customized one-stop data mining and statistical analysis consultancy

Welcome to elective our R language data analysis will be mining will know the course!

Big Data tribe - Chinese professional third-party data service providers to provide customized one-stop data mining and statistical analysis consultancy services
Statistical analysis and data mining consulting services: y0.cn/teradat (Consulting Services, please contact the official website customer service )
![]()
QQ:3025393450
![]()
[Service] Scene
Research; the company outsourcing; online and offline one training; data collection; academic research; report writing; market research.
[Tribe] big data to provide customized one-stop data mining and statistical analysis consultancy
Welcome to elective our R language data analysis will be mining will know the course!