Original Address: http://tech.it168.com/a2017/1031/3177/000003177130.shtml
Recently, Google released a Chrome user experience reports on the Chrome developer summit, designed to help developers understand the performance of their Web applications by providing data collected from 10,000 sites.
Chromium blog post, said:
While current tools allow developers to understand the real world how users experience their own websites, but they never provided insight to be compared with macro trends user experience on other sites or Web.
Chrome user experience report is to achieve such a comparison exists, it is a public data set on the Google BigQuery, including page load indicators, including the user experience associated with the measure, in particular First Paint , First Contentful Paint , DOMContentLoaded and the onload .
All performance data contained in the report are from the actual circumstances've chosen to sync your browsing history and enable its use Chrome user statistics report summary. The original version contains a sample ten thousand websites. If you want to access the data set, you need a Google account, and created a Google Cloud Project.
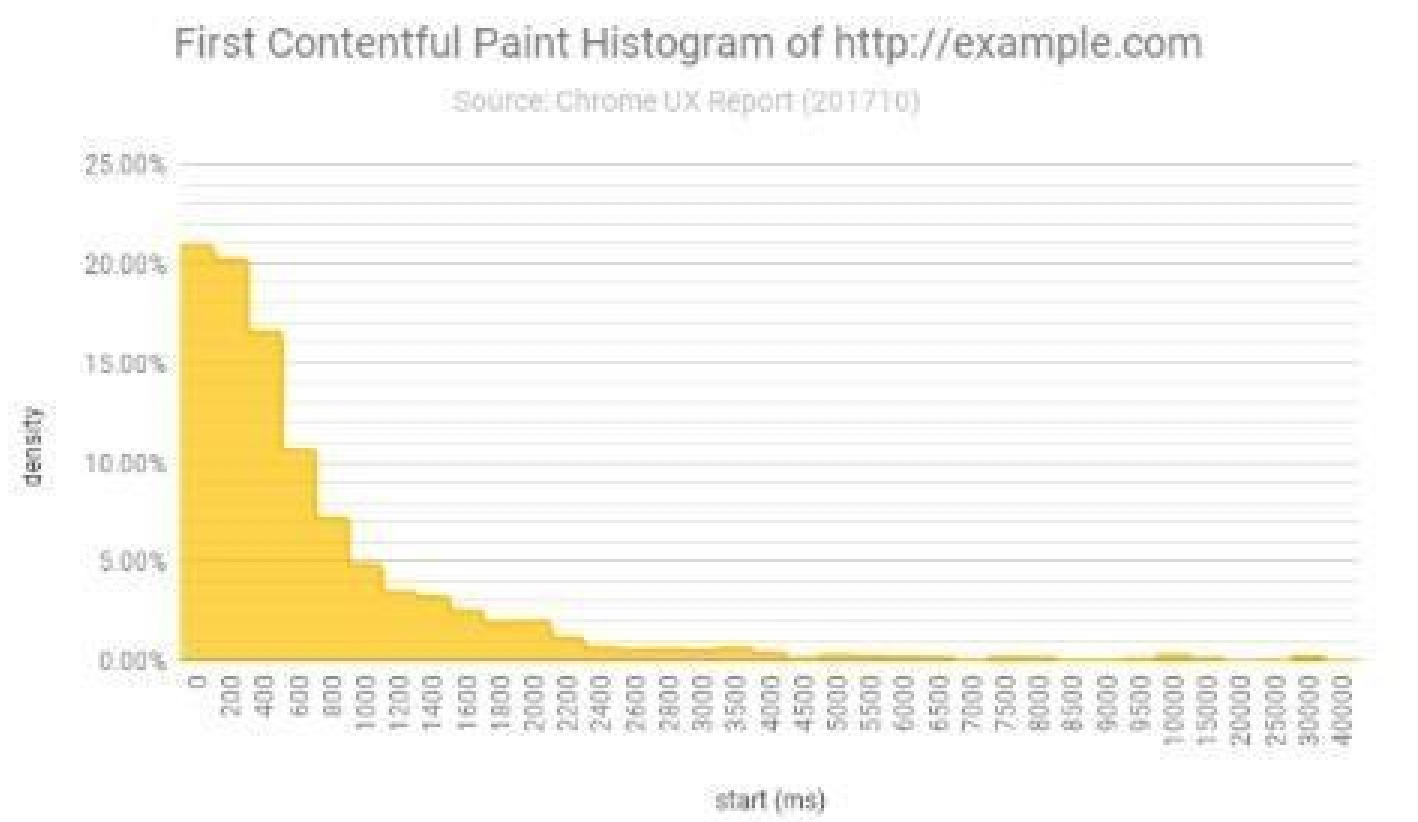
Chrome Paint Timing API information is provided for the user experience is very important, and is included in the data set. Two important indicator is the first paint (FP) and First contentful Paint (FCP) , the difference between them is that, FP marked the start of the browser renders the page , but FCP is the first browser to render content from the DOM, occur when the user first started using the page content .
The difference between these two time points may not always be so obvious. Client-based architecture for a given site, first paint and first contentful paint may no difference. If a site uses a faster and lighter structure, the two usually almost the same (or even exactly). For client architecture includes a lot of resources of large sites (or the connection is slow), time of occurrence of these two measurements may vary.

It indicates that this query, the mobile device in "4G" connection load a website, 12.3% of the page is loaded in 1000-1200 ms - FP inner achieved (12 seconds).
Time shown below is connected to a website, FCP it takes:
Chrome user experience through information obtained reports, Web developers will be able to find better measure their own websites and applications.