After learning Numpy, data scientific computing, why should we use Pandas? Actually, the reason is the high efficiency, then why Pandas efficient than numpy it? In fact, Pandas and Numpy still have a great relationship, Pandas itself is dependent on numpy, and ndarray occupy this section of contiguous memory space in memory, nothing changed ndarray length are bound to make the positions of all value changes in memory and therefore To some extent, Numpy operating efficiency is relatively slow. But Pandas not handle all the data are very efficient, the process generally more friendly following data:
Pandas suitable for handling various types of data:
- Having a table data (DataFrame) columns of different data types , such as an Excel spreadsheet, or an SQL table.
- Ordered or disordered (not fixed frequency) of time-series data.
- Arbitrary matrix with rows and columns of labels.
- Any other form of observation / statistical data sets.
- Pandas includes three main data structures, namely Series (one-dimensional), DataFrame (two-dimensional), Panel (D). Series and DataFrame which can be used to deal with typical problems of the vast majority of financial, statistical, engineering and social sciences of many.
Pandas library is an ideal tool for statistical scientists at the time of data analysis, is very suitable for data cleaning, analysis / modeling , and then analyze the results organized into a form suitable for drawing or displaying all forms of process. So one of the advantages which it?
Advantage
- It can easily handle missing values of non-floating point and floating point data type
- Variable size: DataFrame and Panel can be removed and inserted
- Flexible and powerful grouping function, may be combined to split the data set
- Slicing operation, easy to index, data access
data structure
Series : one-dimensional array of similar objects, a set of data from the data structure and a set of related data labels thereof. Series can be thought of as a fixed-length ordered dictionary, because it is the index value is mapped to a data value.
-
- Creating Series method --pd.Series
-
- Gets an array representation --obj.values
-
Gets the index of the object --obj.index
eg:
# 第一种创建series的方式:
    s1 = pd.Series([1,2,3,4,5,6,7,8,9])
    print(s1)
    print(s1.values)    # series的值
    print(s1.index)  # 索引信息

# 第二种创建series方式:
    s2 = pd.Series(np.arange(10))
    print(s2)

#  第三种通过字典的方式创建series:
    s3 = pd.Series({"cecilia":90,'cc':89,'abc':97})
    print(s3)
    print(s3.index)
    s4 = pd.Series(s1.to_dict()) # 转字典
    print(s4)
    s5 = pd.isnull(s3)
    s5.index.name = "name score" # 给列名添加名称
    print(s5)
-
By indexing accessors
>>>obj2 = pd.Series([4, 7,-5,3], index=['d','b','a','c']) #还能自定义index进行创建Series
>>>obj2
d    4
b    7
a   -5
c    3
dtype: int64
>>> obj2.index
Index([u'd', u'b', u'a', u'c'], dtype='object')

## 通过索引存取元素和修改元素值
>>>obj2['d']= 6 # 修改index='d'的索引值
d    6
b    7
a   -5
c    3
dtype: int64
>>>obj2[['c','a','d']]  ## 选取index='c' 'a' 'd'的元素值
c    3
a   -5
d    6
dtype: int64

## 按照索引条件获取元素
>>>obj2[obj2>0]
d    6
b    7
c    3
dtype: int64
-
- Detecting missing data and pd.notnull --pd.innull
DataFrame : is a table data type, contains a set of ordered columns, each column may be a different value types, both row index has DataFrame column index, the dictionary can be regarded as composed of a Series. dataFrame data in one or more two-dimensional block is stored, instead of lists, dictionaries and the like.
-
Creating DataFrame
eg:
>>> data = {'a':[1,2,3],
       'b':[4,5,6],
       'c':[7,8,9]}
>>> df = pd.DataFrame(data)
>>> print(df)
   a  b  c
0  1  4  7
1  2  5  8
2  3  6  9
注意:结果DataFrame会自动加上索引(跟Series一样),且全部列会被有序悱列!!!

## 如果指定了列序列,则DataFrame的列就会按照指定顺序迸行排列,如果指定的列不存在,那么结果是一个空的dataframe
>>>pd.DataFrame(data, columns=['b', 'a', 'c'])
   b  a  c
0  4  1  7
1  5  2  8
2  6  3  9
Access elements (actually a Series)
note:
- Back Jiong Series have the same index of the original DataFrame, and whose name attribute has also been set up accordingly. Line can also be obtained by way of location or name.
- If a non-integer mode selected slice of data, then the end of the data corresponding to the index is included, and an integer of slice index, index data corresponding to the end of its "post-containing precursor free."
## 通过字典标记或者属性来获取Series
>>> data = {'state':['Ohio','Ohio','Ohio','Nevada','Nevada'],
      'year':[2000, 2001, 2002, 2001, 2002],
      'pop':[1.5, 1.7, 3.6, 2.4, 2.9]}
>>> df= pd.DataFrame(data, columns=['year', 'state', 'pop'])
>>> print(df['state'])
0      Ohio
1      Ohio
2      Ohio
3    Nevada
4    Nevada
Name: state, dtype: object
ix, place, Ilocos
-
ix-- by row number index, it can also index the row labels (from pandas 0.20.0 release, the official .ix method is not recommended, but the use of .iloc and .loc method)
loc - loc [ 'd'] denotes an index of the first 'd' line (index character) index row by row tag data, the index may be a column in a row
iloc-- data acquisition line by line number or multiple rows of data, but the acquisition by the row labels will complain
## 承接上面的df
>> print(df.loc[1]) # 选取第一行的数据
state    Ohio
year     2001
pop       1.7
Name: 1, dtype: object
>> print(df.loc[0:2]) # 选取index=0到index=2行的数据,总共三行数据
  state  year  pop
0  Ohio  2000  1.5
1  Ohio  2001  1.7
2  Ohio  2002  3.6
## 可以锁定行,按照特征属性多列选取元素
>> num_cols = ['RT_user_norm', 'Metacritic_user_nom', 'IMDB_norm', 'Fandango_Ratingvalue', 'Fandango_Stars']
>> bar_heights = norm_data.loc[0, num_cols].values
>> print(bar_heights)
[4.3 3.55 3.9 4.5 5.0]

## 重置索引index,通过行号获取数据
>> df.reset_index(inplace=True)
>> df.head()
>> print(df.iloc[2:4]) # 获取第2行、第3行数据
   index   state  year  pop
2      2    Ohio  2002  3.6
3      3  Nevada  2001  2.4
Rebuild the index --reindex () function : will be rearranged according to the new index. If an index value of the current is not present, the introduction of missing values, filling methods can be used for handling missing values
There are several arguments:
参数           说明
index        用作索引的新序列。既可以是index实例,也
               可以是其他序列型的Python数据结构。Index
               会被完全使用,就像没有任何复制一样。
method     插值(填充)方式。
fill_value  在重新索引的过程中,需要引入缺失值时使用
               的替代值 .
limit        前向或后向填充时的最大填充量.
level        在Multiindex的指定级别上匹配简单索引,否
                则选取其子集
copy           默认为True,无论如何都复制;如果为False,
               则新旧相等就不复制

其中method方法的参数如下:
参数                     说明
ffill或pad         前向填充(或搬运)值
bfill或backfill        后向填充(或搬运)值
fill_value = 0, 0 directly filled
-
- Remove any axis index value --drop (index, axis = 1/0)
-
apply function - the function is applied to a one-dimensional array formed by the rows or columns, such as the sum, and the like mean
eg:
# 将求最大值和最小值之间的差得函数运用在某一轴上
>>>f = lambda x: x.max() - x.min()
>>>frame.apply(f)
>>>frame.apply(f, axis=1)
Ranking and sorting
-
- sort_index - sorted (lexicographic order) of the row or column index
- the Order - sorted by value for Series
- Rank - Rank, by default, rank by "average for the group is assigned a ranking," the same level way undermine relations
eg:
>>>frame = DataFrame(np.arange(8).reshape((2, 4)),
    index=['three', 'one'], columns=['d','a','b','c'])

>>>frame.sort_index()

>>>frame.sort_index(axis=1)

## 默认的是升序排列,但也可以降序排列
>>>frame.sort_index(axis=1, ascending=False)

## 根据一个或多个列觉得值进行排序,采用**by选项**
>>>frame.sort_index(by=['three', 'one'])


## 如要按照值对Series 进行排序,那么可以order
>>>obj = Series([4, 7, -3, 2])
>>>obj.order()
2   -3
3    2
0    4
1    7
>>>obj = Series([4, np.nan, 1, np.nan, -3, 2])
>>>obj.order() #在排序时,缺失值默认都会被放到Series的末尾.
4    -3
2     1
5     2
0     4
1   NaN
NaN
Note: Rank (Series.rank (method = 'average' , ascending = True)) differs from action sort that would replace his object to rank values (from 1 to n). Then the only question is how to handle the same level item, the method in the method parameter is the play this role, he has four selectable values: average, min, max, first .
-
- Is_unique-- verify whether the property is unique
Summary and Statistics
-
- sum (axis = 1/0) - axis = 1 in accordance with the row summation
-
- mean (axis = 1, skipna = False) - skipna option to avoid the presence of the ranks calculated NA Found
-
- idxmin and idxmax, reaches the minimum or maximum index
-
- describe-- for a one-time summary statistics
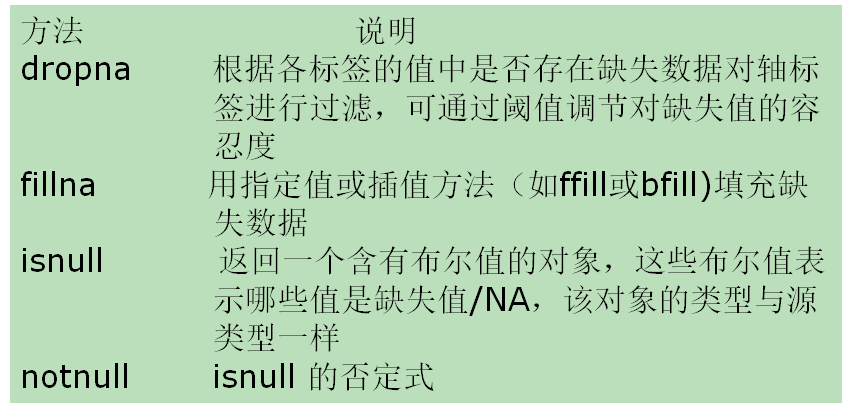
Obtained missing data processing mode
Removal
filling