First, the concept
Canny operator is a very important edge detection operator, is the best step edge detection operator. Its optimality mainly in the following three aspects;
good detection: Canny operator can identify as much as possible the actual edge in the original image.
Good positioning: it marked the edge as much as possible to give you real close to the edge of the actual image.
Minimum response: edges in the image can only be identified once, and can not identify the presence of an edge image noise.
Two, Canny operator specific implementation steps are as follows:
① to Noise: Any edge detection algorithm can not handle well without through the processing of the original image, the original image data on the first two-dimensional Gaussian filter templates volume product operation, and original images obtained with light compared fuzzy hair, which can eliminate the noise
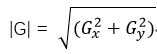
② gradient calculation using a derivative operator (e.g., Sobel operator and Prewitt operator) to find the image intensity in both directions derivative G, G, then the gradient magnitude and direction can be obtained are:

③ gradient direction determination: obtaining the direction of the edge, the gradient direction can be roughly divided into several edge angle (e.g. 0 °, 45 °, 90 ° and 135), and adjacent pixels can be found that the pixel gradient direction.
④ traversal image: If the gray value of a pixel is compared with the gray values of two pixels before and after its gradient direction is not the maximum, then the grayscale pixel value is set to 0, i.e. it is not an edge.
⑤ cumulative histogram calculated with two thresholds: Any large draft given threshold is an edge) is usually less than the low threshold is not constant edge. If the test result is between two threshold values, then it has a pixel according to the printed pixel does not exceed a high threshold for determining an edge pixel, if any, is an edge; otherwise it is not an edge.
Three, MATLAB code implementation
% 去噪声
clear all;
clc;
image = imread('Lena.jpg');
image = rgb2gray(image);
subplot(221);
imshow(image);
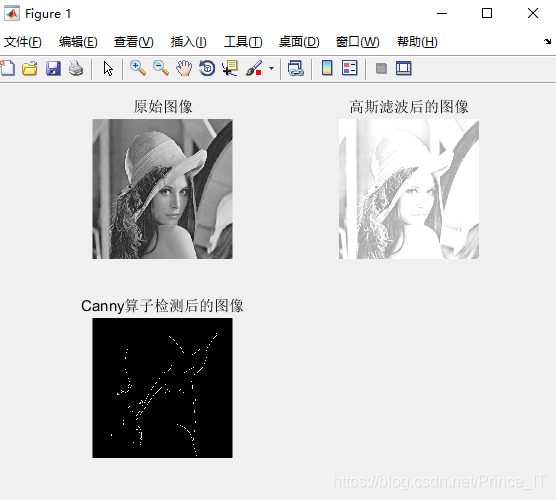
title('原始图像');
image = double(image)/256;
[m,n] = size(image);
w = fspecial('gaussian');
image_1 = imfilter(image,w,'replicate');
subplot(222);
imshow(int8(256*image_1));
title('高斯滤波后的图像');
% 梯度计算
op = fspecial('sobel')/4; % 用Sobel算子来求导数
x = op';
y =op;
bx = imfilter(image_1,x,'replicate');
by = imfilter(image_1,y,'replicate');
b_abs = sqrt(bx.*bx+by.*by); % 求梯度的幅值
b_angle = angle(by-i*bx);
b_ang = b_angle/3.1416*180; % 求梯度的方向
% 梯度方向确定
for r = 1:m
for c = 1:n
if((b_ang(r,c)>=22.5 & b_ang(r,c)<67.5)...
| (b_ang(r,c)>=-157.5 & b_ang(r,c)<-112.5))
dir(r,c) = 1;
elseif ((b_ang(r,c)>=67.5 & b_ang(r,c)<112.5)...
| (b_ang(r,c)>=-112.5 & b_ang(r,c)<-67.5))
dir(r,c) = 2;
elseif ((b_ang(r,c)>=112.5 & b_ang(r,c)<157.5)...
| (b_ang(r,c)>=-67.5 & b_ang(r,c)<-22.5))
dir(r,c) = 3;
else
dir(r,c) = 0;
end
end
end
% 遍历图像
b_ab = [zeros(m,1),b_abs,zeros(m,1)]; % 串联矩阵
b_ab = [zeros(1,n+2);b_ab;zeros(1,n+2)];
for r = 2:m+1
for c = 2:n+1
switch dir(r-1,c-1)
case 0
if((b_ab(r,c)<b_ab(r+1,c))| (b_ab(r,c)<b_ab(r-1,c)))
b1(r-1,c-1) = 0;
else
b1(r-1,c-1) = b_ab(r,c);
end
case 1
if((b_ab(r,c)<b_ab(r+1,c-1))| (b_ab(r,c)<b_ab(r-1,c+1)))
b1(r-1,c-1) = 0;
else
b1(r-1,c-1) = b_ab(r,c);
end
case 2
if((b_ab(r,c)<b_ab(r,c-1))| (b_ab(r,c)<b_ab(r,c+1)))
b1(r-1,c-1) = 0;
else
b1(r-1,c-1) = b_ab(r,c);
end
case 3
if((b_ab(r,c)<b_ab(r-1,c-1))| (b_ab(r,c)<b_ab(r+1,c+1)))
b1(r-1,c-1) = 0;
else
b1(r-1,c-1) = b_ab(r,c);
end
end
end
end
for r = 1:m
for c = 1:n
if (b1(r,c)>0.24)
b2(r,c) = 1;
else
b2(r,c) = 0;
end
end
end
for r = 1:m
for c = 1:n
if(b1(r,c)>0.36)
b3(r,c)=1;
else
b3(r,c) = 0;
end
end
end
image_2 = b3;
for k = 1:10
for r = 2:m-1
for c = 2: n-1
if (b2(r,c)==1 & (image_2(r,c)==1|image_2(r+1,c)==1 ...
|image_2(r+1,c-1)==1|image_2(r+1,c+1)==1|image_2(r,c-1)==1 ...
|image_2(r,c+1)==1|image_2(r-1,c-1)==1|image_2(r-1,c)==1 ...
|image_2(r-1,c+1)==1))
image_2(r,c) = 1;
else
image_2(r,c) = 0;
end
end
end
end
subplot(223);
imshow(image_2);
title('Canny算子检测后的图像');
Fourth, the results are as follows