What is industry wheeled strategy?
Wheeled industry is the use of an active market trend trading strategy to profit, its essence is the use of different investment products offset a strong time for the industry to switch varieties to achieve the objective of maximizing return on investment. Popular speak is to be wheeled configured according to differences in the performance range of different industries, and strive to seize the good performance of the industry within the interval, excluding the underperforming sectors, while judging the poor market, lower equity positions, improve the proportion of bonds or currency.
Details and characteristics of wheeled industry
Our industry can be divided into the following categories:
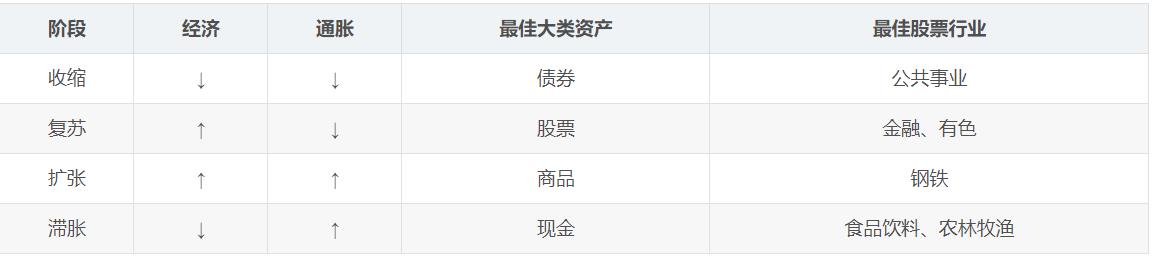
Periodic : When accelerating growth, good performance of equities and commodities, cyclical industries such as automotive, real estate, steel stocks beat the market; when growth slows, bonds, cash and defensive stocks beat the market.
Growth : When the inflation rate decreased, decreased the discount rate, good performance of financial assets, growth stocks beat the market; when inflation rises, commodities and other real assets and cash the best performance, pricing becomes strong, value stocks beat the market.
Interest rate sensitivity : banking and consumer stocks are interest rate-sensitive "early cycle" performers, the recession and the recovery phase, the best performance when the central bank to ease policy and the economic growth rate began to rise.
Assets varieties : some industries and the performance of the assets it owns are closely related, banking and insurance often bond and stock prices sensitive to the recession and recovery phases of good behavior; mining stocks on the metal price-sensitive, in hot stage a good performance; petroleum and sensitive to oil and gas industry, to beat the market in stagflation phase.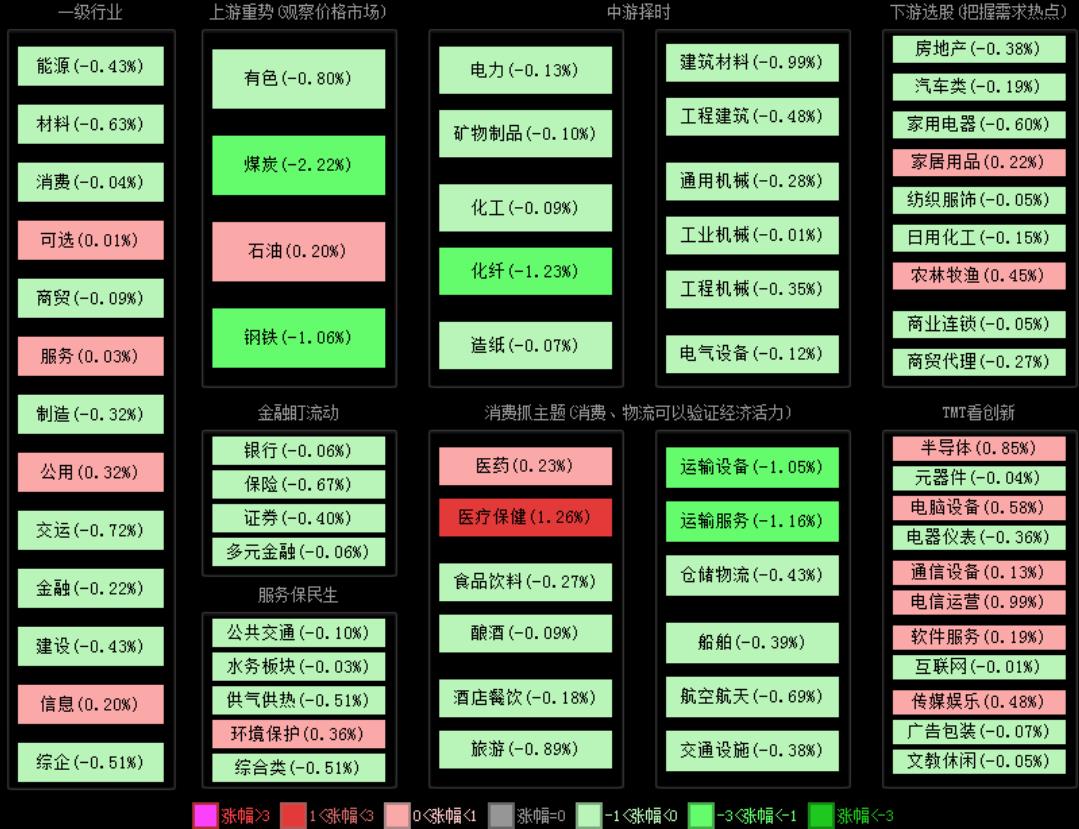
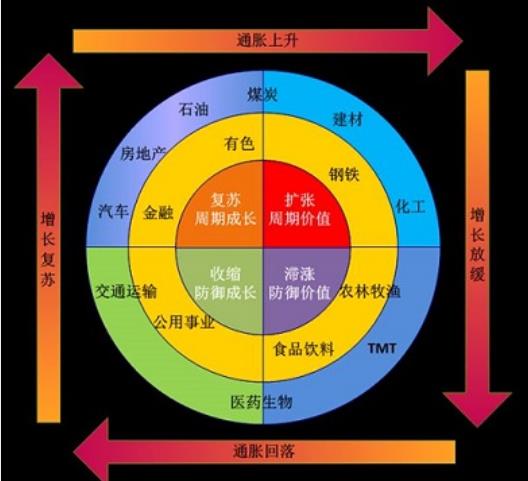
The figure from "accessible information sector map" interface, combined with recent years, the basic situation of China's A-share market wheeled industry point of view, cycles usually along the chain in a certain order in sequence occurs: housing and car consumption is leading the economy business cycle and start of the main pilot power, these industries performed well in the economic upswing (recovery period) will gradually led to the rise of the middle reaches of manufacturing machinery and equipment, chemicals, building materials, and to conduct nonferrous metals, steel, coal, oil, etc. the upstream resource products industry, this time reaching the overheating of the economy. Starting from the recession also downstream industry, to gradually transfer the upstream industry. At the height of the economic boom, the business thriving, this time the protagonist is a non-essential consumer goods, such as cars, high-end clothing, luxury goods, consumer electronics and tourism industries, enjoy the last economic cycle feast. When the economic downturn (stagflation, recession), cyclical industry performance is affected, and medicine, and other mandatory consumer non-cyclical industries due to small demand elasticity, subject to little macroeconomic impact, performed relatively well; the price is relatively Bank stable, fluctuations in demand is also smaller, and as the interest rate-sensitive "early cycle" performers, the rise in the late recession. Of course, taking into account the different historical backgrounds, industry wheeled cycle is not a simple repeat, can not be directly applied to determine the historical experience of cycle turning point, but should be based on empirical analysis of specific circumstances.
Wheeled industry policy implementation (Denver-based quantification platform)
strategy thought
a month to periodically trigger computing "300 Industries" every "300 material", "optional 300", "300 consumer", "300 medicine", "300 financial "these industry index returns over the past 20 trading days.
Then select the highest rate of return index constituent stocks of the smallest market capitalization of five stocks.
Not in stock pool of stocks such as the right to open and configure the underlying stock pool.
The main steps to implement strategies
to get the current trading day date
= context.now now
= context.now
direct call context.now function returns "datetime.datetime" format
Gets the previous day's date
last_day = get_previous_trading_date(exchange='SHSE', date=now)
= get_previous_trading_date(exchange='SHSE', date=now)
获取上一交易日可调用get_previous_trading_date函数,返回值为字符串格式:
exchang需要设置交易市场代码。
date需要设置指定日期。
固定月初调仓
schedule(schedule_func=algo, date_rule='1m', time_rule='09:40:00')
(schedule_func=algo, date_rule='1m', time_rule='09:40:00')
固定时间调仓可使用schedule函数进行定时任务配置:
参数schedule_func为调用的策略函数。
date_rule可设为1m(一月)。
time_rule为开仓日的开仓时间,这里设为每月第一个交易日的09:40:00。
获取过去交易日的历史信息
return_index_his = history_n(symbol=symbol, frequency='1d', count=20, fields='close,bob',fill_missing='Last', adjust=ADJUST_PREV, end_time=last_day, df=True)
= history_n(symbol=symbol, frequency='1d', count=20, fields='close,bob',fill_missing='Last', adjust=ADJUST_PREV, end_time=last_day, df=True)
获取历史信息需要调用histor_n函数,默认返回值为“字典“格式,如果参数df设为True,则返回"dataframe"格式
symbol设置所需获取的标的代码。
frequency获取历史信息的频率,如日线数据设置为1d。
count需要设置获取的bar的数量。
fileds设置返回值的种类。
fill_missing需要设置对于空值的填充方式, None- 不填充,NaN- 用空值填充, Last- 用上一个值填充,默认 None。
adjust需要设置对于复权的处理,ADJUST_NONE or 0: 不复权, ADJUST_PREV or 1: 前复权, ADJUST_POST or 2: 后复权, 默认不复权。
end_time需设置获取历史信息的结束时间。
获取指数成分股
symbols = get_history_constituents(index=index_symbol, start_date=last_day, end_date=last_day)[0]['constituents'].keys()
= get_history_constituents(index=index_symbol, start_date=last_day, end_date=last_day)[0]['constituents'].keys()
获取指数成分股可调用函数get_history_constituents或者get_constituents,返回值类型为list[dict],这里调用get_history_constituents是因为再回测时需要获取上一交易日的成分股,而get_constituents只能获取最新的成分股:
index需要设置获取指数的代码。
start_date和end_date需设置获取成分股的开始与结束日期,这里需要调成上一交易日以获取上一交易日的成分股信息。
获取当天有交易的股票
not_suspended_info = get_history_instruments(symbols=symbols, start_date=now, end_date=now)
not_suspended_symbols = [item['symbol'] for item in not_suspended_info if not item['is_suspended']]
= get_history_instruments(symbols=symbols, start_date=now, end_date=now)
not_suspended_symbols = [item['symbol'] for item in not_suspended_info if not item['is_suspended']]
获取当天有交易的股票,即非停牌的股票,首先需获取停牌信息,这里需调用get_history_instruments函数,返回值类型为list[dict],之后就是将所提取的“字典”转换为”list“:
symbols需要设置订阅的标的代码。
start_date和end_date需设置获取成分股的开始与结束日期,这里需要调成上一交易日以获取上一交易日的成分股信息。
获取财务(市值)信息
fin = get_fundamentals(table='tq_sk_finindic', symbols=not_suspended_symbols, start_date=last_day,end_date=last_day, limit=5, fields='NEGOTIABLEMV', order_by='NEGOTIABLEMV', df=True)
= get_fundamentals(table='tq_sk_finindic', symbols=not_suspended_symbols, start_date=last_day,end_date=last_day, limit=5, fields='NEGOTIABLEMV', order_by='NEGOTIABLEMV', df=True)
获取财务数据使用get_fundamentals函数,返回值类型为list[dict]:
table需填写所需获取指标所在表格的代码。
fields设置返回值的种类。
orde_by需设置数据的排序方式,默认 None。 TCLOSE 表示按 TCLOSE 升序排序。 -TCLOSE 表示按 TCLOSE 降序排序。TCLOSE, -NEGOTIABLEMV 表示按 TCLOSE 升序, NEGOTIABLEMV 降序综合排序。
limit表示返回值的个数。
策略回测分析
分析
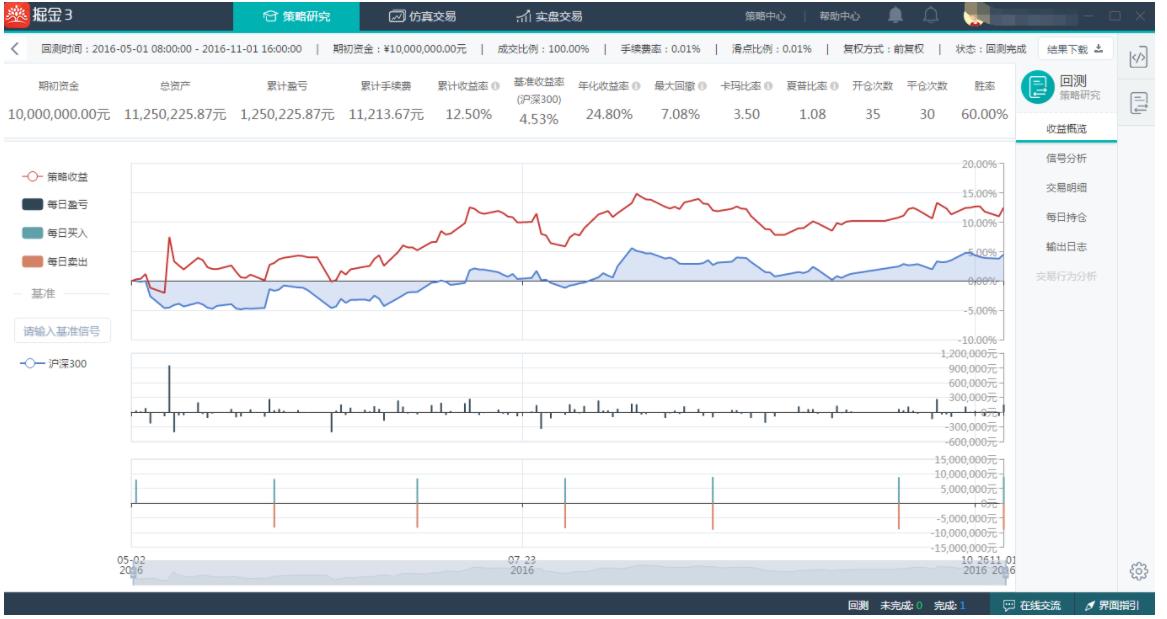
我们选取了2016年5月至2016年11月作为回测周期,可以看出:
胜率(具有盈利的平仓次数与总平仓次数之比)达到了60%。
卡玛比率(年化收益率与历史最大回撤之比)是使用最大回撤率来衡量风险。采用最大回撤率来衡量风险,关注的是最极端的情况。卡玛比率越高表示策略承受每单位最大损失获得的报酬越高。在这里卡玛比率超过了3.5。
夏普比率(年化收益率减无风险收益率的差收益波动率之比)超过1,也即承受1单位的风险,会有超过1个单位的收益回报
策略收益曲线较为稳定,在无止损条件的情况下,最大回撤控制在承受范围,并成功跑赢沪深300指数。
相关阅读: 行业轮动策略python源码