In modern deep learning development, we usually rely on other modules to build complex software systems like building blocks. This process is often fast and effective. However, how to quickly locate and solve problems when encountering them has always troubled deep learning system designers and maintainers due to the complexity and coupling of the system.
As a member of iQiyi’s back-end technical team, we have recorded in detail the process of solving deep learning training memory-related issues, hoping to provide some inspiration to peers who are working hard to solve thorny problems.
background
Over the past quarter, we have been observing random CPU memory OOM phenomena in the A100 cluster. With the introduction of large model training, oom became even more unbearable, which made us determined to solve this problem.
Looking back at where I came from, I felt suddenly enlightened. In fact, we were once very close to the truth of the problem, but we lacked enough imagination and missed it.
process
At the very beginning, we conducted an inductive analysis of the historical logs. Several rules were discovered, which have very good guiding significance for the final solution:
-
This is a new problem encountered in the A100 cluster and has not been encountered in other clusters.
-
The problem is related to pytorch's ddp distributed training; other training modes using pytorch have not been encountered.
-
This OOM problem is quite random, some occur within 3 hours, and some only occur after more than a week.
-
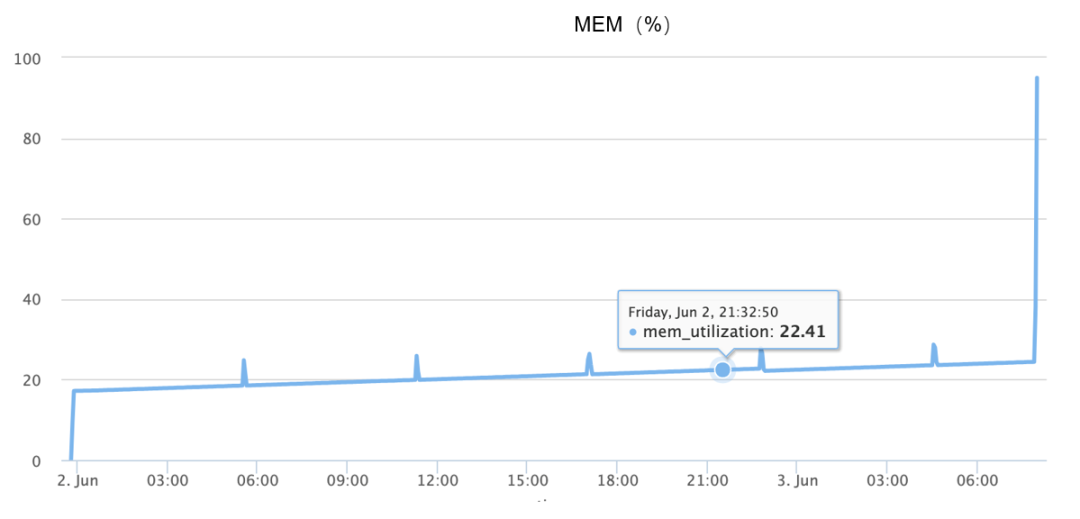
Memory surge occurs during OOM, basically completing the increase from 10% to 90% within 1 and a half minutes, as shown in the figure below:
Although the above information is available, since the problem cannot be reproduced reliably, at the beginning, I relied entirely on divergent imagination; I guessed many possible causes, such as:
-
Could it be a code problem, because the object is not recycled, causing continuous memory leaks?
-
Could it be a problem with the underlying memory allocator, similar to the fact that glibc's PTMALLOC allocator has too many fragments, so at a certain moment, sudden memory requests lead to continuous memory allocation?
-
Could it be a hardware problem?
-
Could it be a bug in a specific version of the software?
Below we introduce the first two assumptions in detail.
-
Is it a problem with the code?
In order to determine whether it is a code problem, we added debugging code to the scene where the problem occurred and called it periodically. The following code will print out all objects that cannot be recycled by the current python gc module.
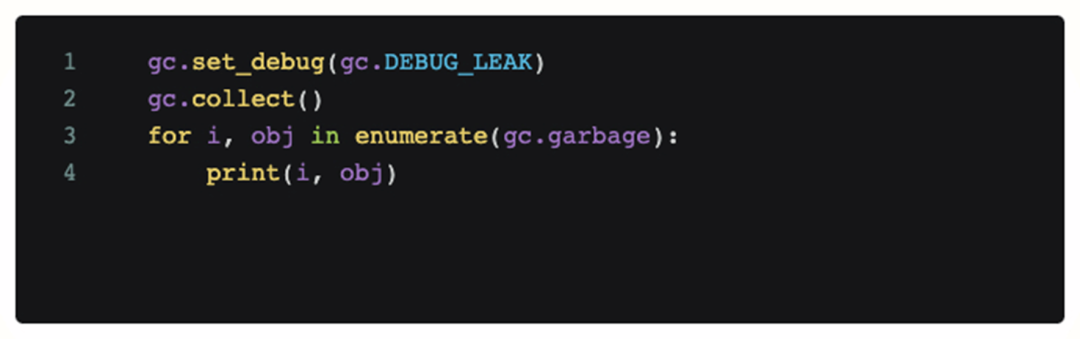 However, after adding this code, the obtained log analysis shows that there is no unreachable object that takes up a lot of memory during OOM, and continuous gc cannot alleviate OOM itself. So at this point our first guess is bankrupt, the problem is not caused by the code (memory leak).
-
Is it caused by the memory allocator?
At this stage, we introduced the jemalloc memory allocator. Compared with glibc's default PTMALLOC, its advantage is that it can provide more efficient memory allocation and better support for debugging the memory allocation itself. This can be achieved:
-
Could it be a problem with the default memory allocator?
-
Better debugging and analysis tools
In order to directly view the current status of jemalloc in python without modifying the torch code itself, we used ctypes to expose the jemalloc interface directly in python:
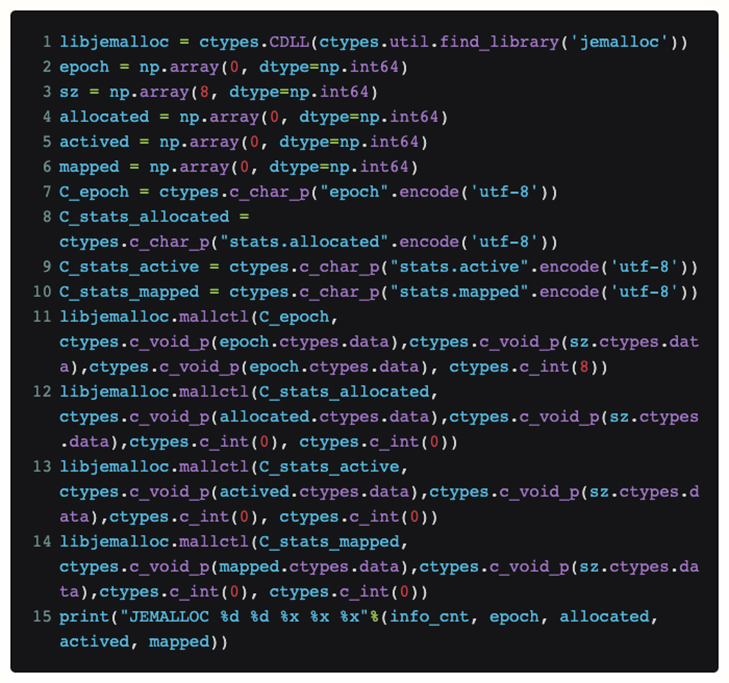
In this way, if we put this code into a function, we can periodically know the request [allocated] currently received by jemalloc from the upper layer, and the actual physical memory size [mapped] it requests from the system.
After the actual reproduction process, it was finally found that the two values allocated and mapped are very close when OOM occurs. So our hypothesis about memory fragmentation goes bankrupt.
-
What exactly caused the problem?
When we were at the end of our rope, we once again sorted out the existing OOM logs, and found that there was a direction that had not been focused on before: that is, we had multiple machines operating at similar times (1-2 minutes adjacent) several times. ) OOM occurs.
So what logical explanation is there for this magical synchronicity? Ordinary bugs should not cause such coherence to reoccur. So there may be some inevitable connection between them.
So where does this correlation come from? To explore this issue, the analytical perspective shifts to network communication in distributed training.
The initial suspicion about communication was focused on machines that experienced OOM. It was suspected that they were communicating with each other for some reason, which would cause problems with each other. Therefore, tcpdump was added to daily training to monitor network traffic.
Finally, after joining tcpdump, I caught the most questionable communication during an OOM. That is, the OOM machine received security scan traffic a few minutes before the problem occurred.
final positioning
After catching the security team scanning the suspected object, we collaborated with the security team to conduct analysis, and finally found that the OOM problem could be stably reproduced based on the scan, so the triggering cause was almost certain. However, at this point, we can only reproduce and change the security scanning strategy to avoid the OOM problem. We also need to further analyze the code and finally locate it.
After analyzing and positioning the code, it was finally determined that the problem lies in pytorch’s DDP distributed training protocol. The relevant code is as follows:
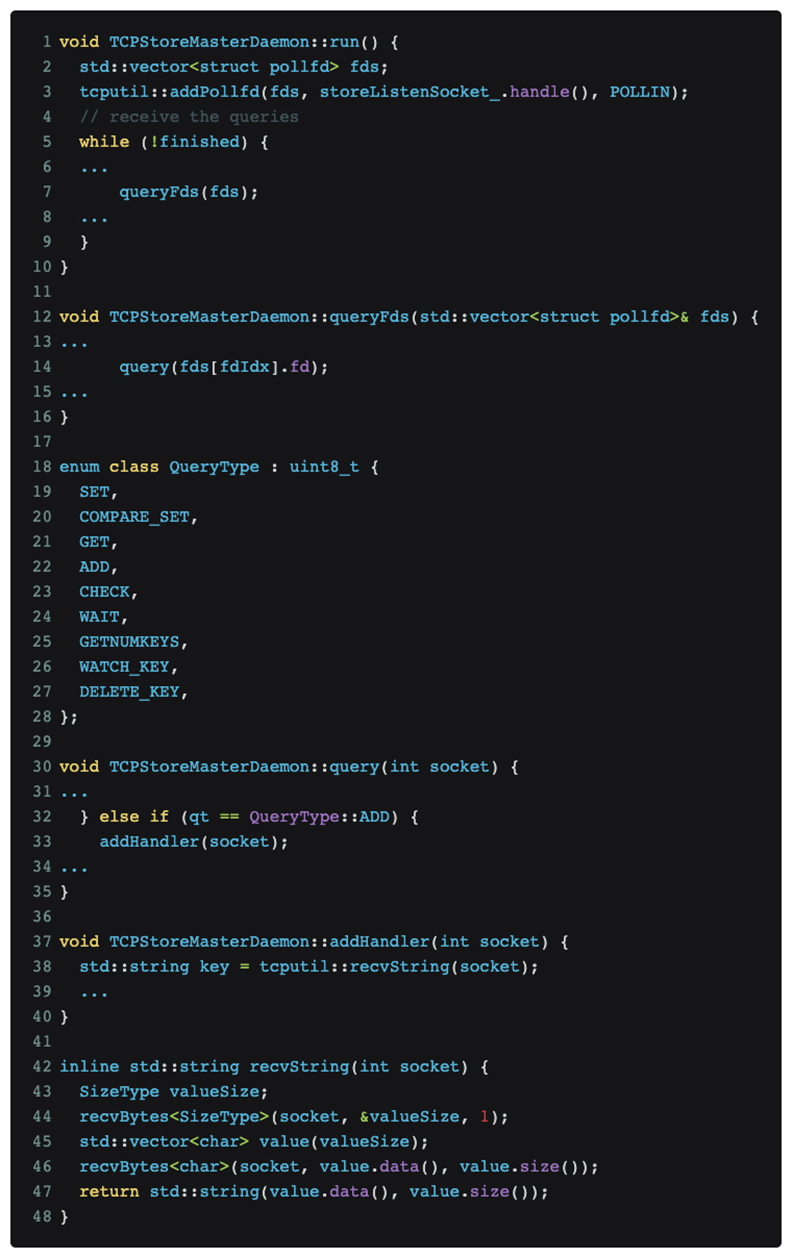
As shown in the figure above, pytorch distributed training continues to listen for messages on the master port.
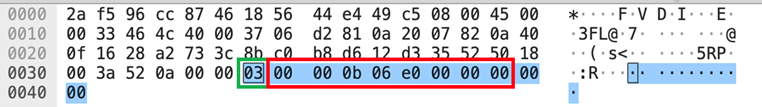
The Nmap scan [nmap -sS -sV] happened to trigger the QueryType::ADD message type, which is the green box number [03] in the data part shown in the tcpdump picture above, which caused pytorch to try to use the recvString function to pre-allocate a buffer. to receive what it considers to be follow-up messages. But this buffer length is parsed using a uint64_t[little-endian] type after [03], which is the red box number [e0060b0000], which is 962174058496 bytes. This value is understood to mean that 1T data will be received, and pytorch will After the memory allocator requests the corresponding memory, the memory allocator further requests the corresponding physical page from the kernel. Since our GPU training cluster is not configured with a huge page table, Linux can only gradually satisfy the 1T memory request of the memory allocator in page missing interrupts according to 4K granularity, which means it takes about 1 minute to allocate all memory, and The OOM observed earlier probably occurs in response to rapid memory growth of about 1 minute.
solution
After knowing the cause and effect, the solution becomes natural:
1. Short-term: Change security scanning policy to avoid
2. Long-term: communicate with the community to strengthen the robustness [ 1 ]
Summarize
After completing the backtracking of the OOM problem investigation process, we found that during this process, we had actually conducted an effective round of testing on memory-related tools and debugging methods.
During this process, we discovered that there are some common points that can be used for reference in subsequent research and development:
-
Jemalloc can provide a very effective quantitative analysis of memory problems and can capture underlying memory-related issues in hybrid programming systems such as python+C.
-
Memray. We had high expectations for it during the debugging process, but in the end we found that the area where memray can perform best is still on the pure python side, and it is not capable of hybrid programming systems such as pytorch DDP.
Sometimes we still need to think about problems from a larger dimension. For example, if the communication process with external unrelated services is not included in the consideration, the real root cause will not be discovered.
Maybe you also want to see