Virtual machine performance monitoring
When locating problems in a system, knowledge and experience are the key foundations, data is the basis, and tools are the means to use knowledge to process data. The data mentioned here include: running logs, exception stacks, GC logs, thread snapshots (threaddump/javacore files), heap dump snapshots (heapdump/hprof files), etc. Regular use of appropriate virtual machine monitoring and analysis tools can speed up our ability to analyze data, locate and solve problems
jps displays virtual machine processes
 You can see that the opened Liuma program virtual machine process is 9808.
Options

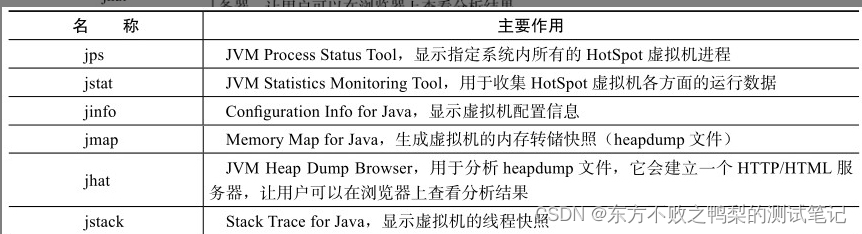
jstat virtual machine statistics monitoring tool
jstat (JVM Statistics Monitoring Tool) is a command line tool used to monitor various running status information of virtual machines. It can display the class loading, memory, garbage collection, JIT compilation and other operating data in the local or remote [illustration] virtual machine process. On a server that does not have a GUI graphical interface and only provides a plain text console environment, it will be the best way to run The first choice tool for locating virtual machine performance problems.
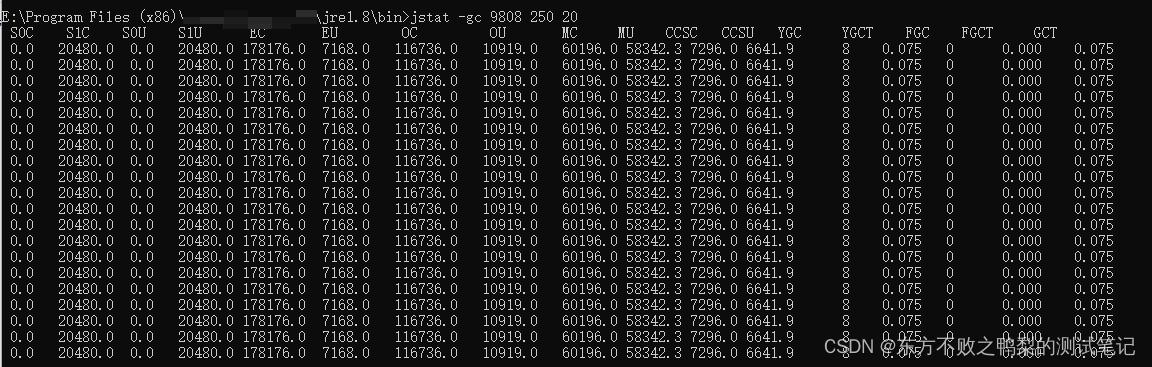
jstat -gc 9808 250 20
The garbage collection status of process 9808 is queried every 250 milliseconds, a total of 20 times.
Options

jstat -gcutil 9808
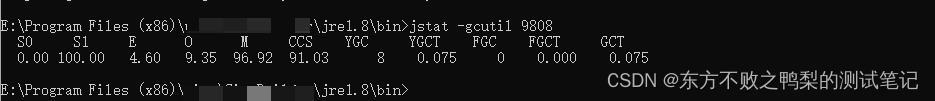
S0S1: Indicates two survivor areas.
E: Indicates 4.6% of the space used by the new generation eden area.
O: Indicates 9.35% of the space used by the old generation.
M: The metaspace metaspace accounts for the space used by users to store metadata and static variables.
CCS: Compressed class space, which is a supplement to metaspace. Users store classes loaded by other class loaders.
YGC: Minor GC has occurred 8 times since the program was run, and the total time consuming is 0.075 seconds.
FGC: Full GC has occurred 0 times
. GCT: The total time consuming for all GCs is 0.075 seconds.
What does it mean that M is 96.2?
In the output of jstat -gcutil, M represents the usage of metaspace. This value is a percentage, so an M of 96.92 means that the metaspace is used 96.92% of the time. Metaspace is used to store metadata and static variables of a class. When a class is loaded into the JVM, memory is allocated for it in the metaspace. If the metaspace usage is too high, it may mean that there are many classes being loaded into the JVM and it may be approaching or already exhausting the metaspace capacity. This may cause class loading failures or degraded system performance. Generally, if the metaspace usage exceeds 80%, you need to consider increasing the capacity of the metaspace to prevent memory overflow.
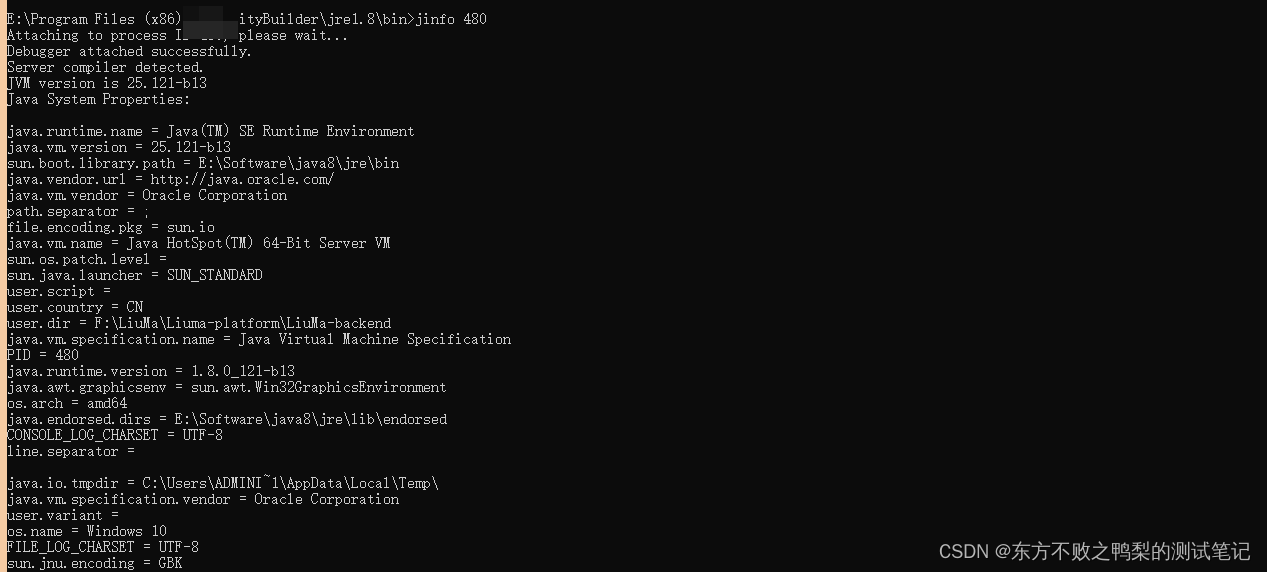
jinfo: Java configuration information tool
View and adjust virtual machine parameters in real time
jinfo command format:
jinfo [option] pid

-flag can view the value of a certain configuration
jinfo -flag InitialHeapSize 480
\jre1.8\bin>jinfo -flag InitialHeapSize 480
-XX:InitialHeapSize=268435456
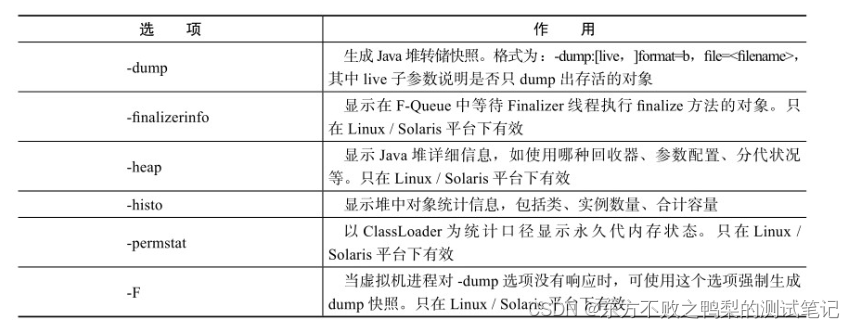
jmap: Java memory mapping tool
The jmap (Memory Map for Java) command is used to generate a heap dump snapshot (commonly known as heapdump or dump file)
jmap [ option ] vmid
Options
jmap is a command-line tool for the Java Virtual Machine (JVM) that is used to generate a heap dump (Heap Dump) file, which is a snapshot of the memory used by a Java application while it is running. This snapshot can be used to analyze memory usage and identify problems such as memory leaks.
The basic command format for using jmap to generate a heap dump snapshot is as follows:
bash
jmap -dump:format=b,file=<heap-dump-path> <process-id>
其中:
<heap-dump-path> is the path and file name where you wish to save the heap dump file.
<process-id> is the ID of the Java process you need to dump.
For example, if you want to generate a heap dump for a Java application with process ID 12345, and want to save the file in /tmp/heapdump.hprof, then you can use the following command:
jmap -dump:format=b,file=/tmp/heapdump.hprof 12345
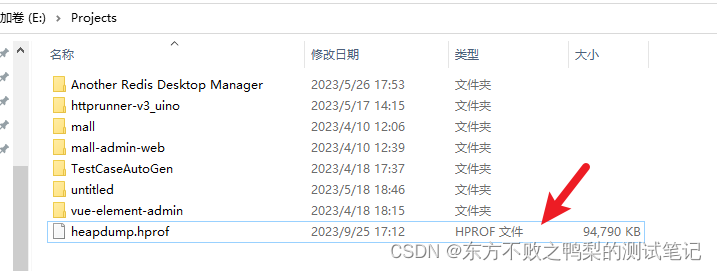
After executing this command, jmap will generate a heap dump file for the specified Java process.

You can see that the dump file has been generated
jhat: Virtual machine heap dump snapshot analysis tool
Unless there are really no other tools available, you generally will not use the jhat command directly to analyze dump files.
VisualVM, as well as tools such as Eclipse Memory Analyzer and IBM HeapAnalyzer [illustration] that are professionally used to analyze dump files, can achieve more powerful and professional analysis functions than jhat.
\jre1.8\bin>jhat /Projects/heapdump.hprof
Reading from /Projects/heapdump.hprof...
Dump file created Mon Sep 25 17:12:05 CST 2023
Snapshot read, resolving...
Resolving 870410 objects...
Chasing references, expect 174 dots..............................................................................................................................................................................
Eliminating duplicate references..............................................................................................................................................................................
Snapshot resolved.
Started HTTP server on port 7000
Server is ready.
After the screen displays the prompt "Server is ready.", the user can see the analysis results by typing http://localhost:7000/ in the browser
jstack: Java stack tracing tool
The jstack (Stack Trace for Java) command is used to generate a thread snapshot of the virtual machine at the current moment (commonly called a threaddump or javacore file). A thread snapshot is a collection of method stacks being executed by each thread in the current virtual machine. The main purpose of generating a thread snapshot is to locate the causes of long pauses in threads, such as deadlocks between threads, infinite loops, and long pauses caused by requesting external resources. Waiting, etc. are common causes of long thread pauses. When a thread pauses, you can use jstack to view the call stack of each thread to know what the unresponsive thread is doing in the background or what resources it is waiting for.
jstack [option] vmid

JDK visualization tool
In addition to providing a large number of command line tools in the JDK, there are also two powerful visual tools: JConsole and VisualVM
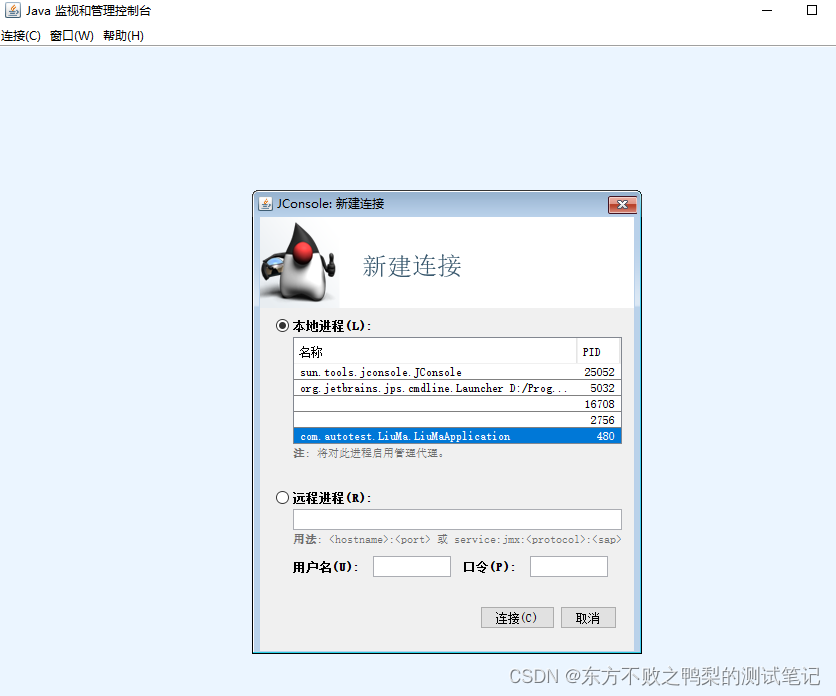
jconsole
After starting JConsole through "jconsole.exe" in the JDK/bin directory, all virtual machine processes running on the local machine will be automatically searched. There is no need for the user to use jps to query. If the connection fails, the jdk version may not be the same as the program version. correspond

The "Memory" tab is equivalent to the visual jstat command, used to monitor the changing trend of virtual machine memory (Java heap and permanent generation) managed by the collector.
The function of the "Thread" tab is equivalent to the visual jstack command. You can use this tab for monitoring and analysis when a thread is paused.
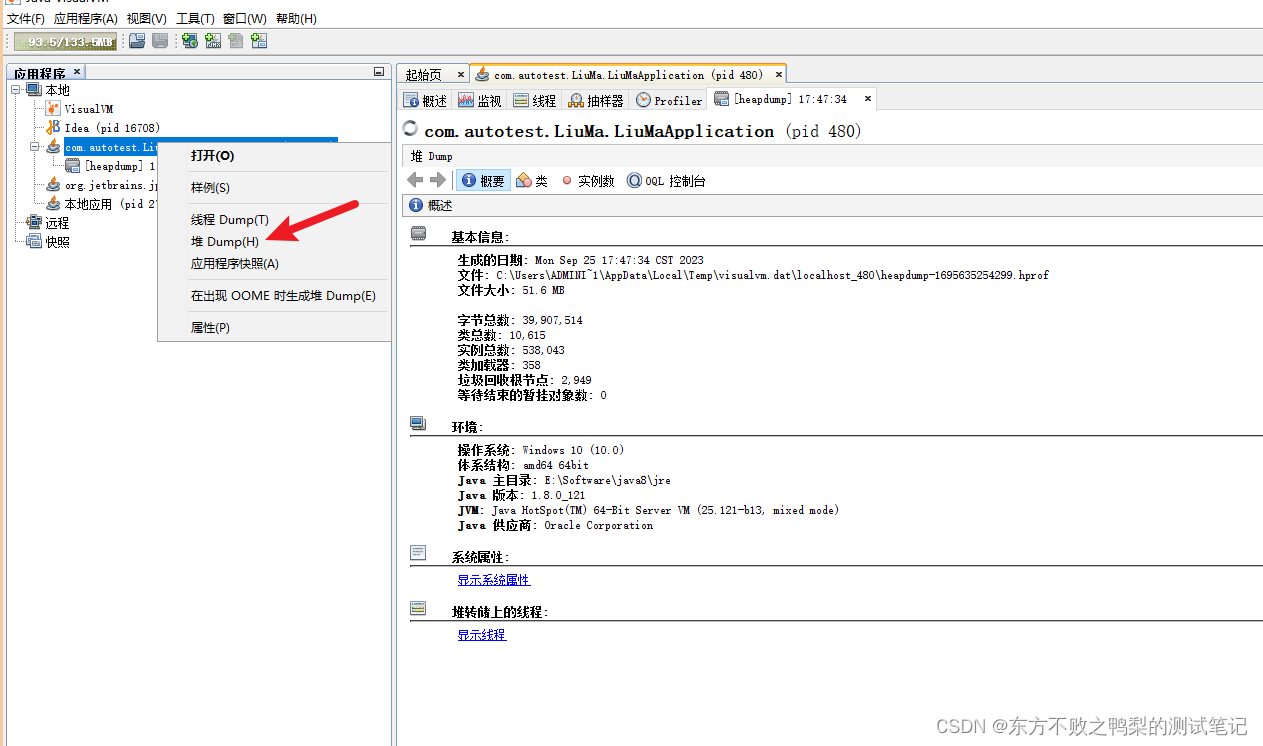
VisualVM: All-in-one troubleshooting tool
Find jvisualvm.exe and run

Generate and browse heap dump snapshots
You can also click File-Load to load the dump file
Profiler tab can analyze program performance
First select one of the "CPU" and "Memory" buttons, and then switch to the application to operate the program. VisualVM will record the methods executed by the application during this period. If it is CPU analysis, the number of execution times and execution time of each method will be counted; if it is memory analysis, the number of objects associated with each method and the space occupied by these objects will be counted.
linux side
jps command not found because openjdk-devel is not installed on the virtual machine
The Linux virtual machine jps command cannot be found - Zhihu
yum install java-1.8.0-openjdk-devel.x86_64
solve

The content of this article is excerpted from "In-depth Understanding of Java Virtual Machine: JVM Advanced Features and Best Practices"