Java virtual machine
Java Virtual Machine (JVM for short) is a virtual computer used to execute Java bytecode. It is a key component of the Java platform and is responsible for compiling Java source code into bytecode that can be executed on different computer architectures.
JVM plays the role of a middle layer, allowing Java programs to run on different operating systems and hardware, realizing the feature of "write once, run anywhere". JVM provides memory management, garbage collection, security mechanism, thread management and other functions, which greatly simplifies the development and deployment of Java programs.
When you run a Java program, the JVM loads the Java bytecode into memory and interprets it line by line for execution or compiles it into machine code on the fly. This combination of interpretation and compilation makes Java have good cross-platform performance and efficient performance.
In short, the Java virtual machine is the running platform for Java programs, which makes the Java language cross-platform, efficient, and safe.
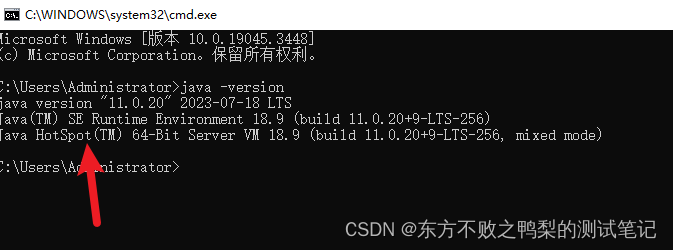
The version of this virtual machine is Sun's Hotspot.
reference:
Jvm knowledge that all test engineers can understand (qq.com)
Jvm knowledge that all test engineers can understand (qq.com)
Jvm knowledge that all test engineers can understand (qq.com)
Automatic memory management
During the execution of a Java program, the Java virtual machine divides the memory it manages into several different data areas.

Heap
The Java heap is a memory area shared by all threads and is created when the virtual machine starts. The only purpose of this memory area is to store object instances, and almost all object instances allocate memory here.
Java heap can be in physically discontinuous memory space
Implemented as extensible (controlled by -Xmx and -Xms). If there is no memory in the heap to complete the instance allocation and the heap cannot be expanded, an OutOfMemoryError exception will be thrown.
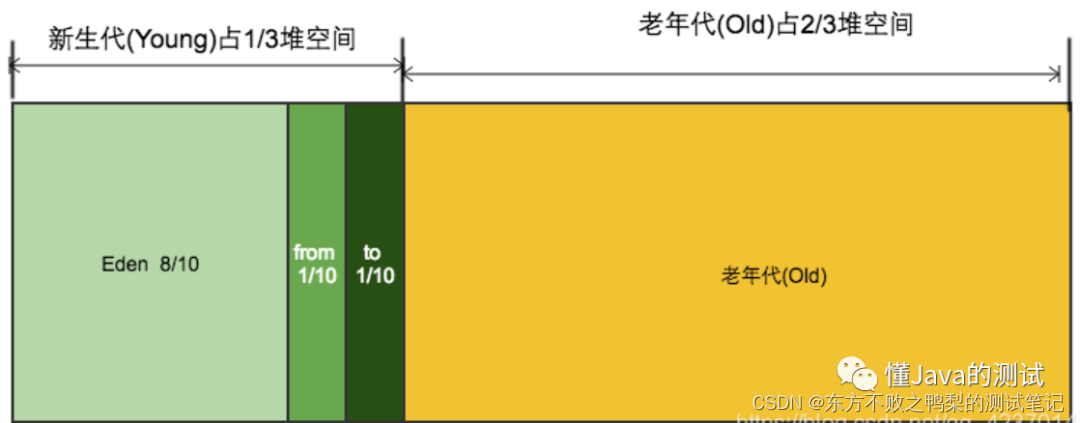
Heap memory classification
The Java heap can also be subdivided into: new generation and old generation; more detailed ones include Eden space, From Survivor space, To Survivor space, etc.
The space ratio between Eden and Survivor is the default value 8:1
This distinction is to use different recycling algorithms to recycle memory.
jvm garbage collection
Heap memory resources are precious and limited. If a large number of such objects accumulate, it will inevitably lead to memory leaks or even overflows. What should we do? Garbage collection, JVM comes with a garbage collection thread, which constantly checks some instance objects that are not referenced by local variables, static variables, or some constants, marks these objects as recyclable "garbage", and cleans them up regularly to save memory resources.
Young Gc is the garbage collection that occurs in the new era, Major Gc is the garbage collection that occurs in the old era, also known as OldGc, and Full Gc is the garbage collection that occurs in the new era, old era, permanent generation and other areas. Full means all. . Regardless of whether it is Young Gc, Full Gc or other Gc, it will cause the Stop the World phenomenon and cause system lag, but the lag time caused by each Gc is different.
Cenozoic GC (Minor GC): refers to the garbage collection action that occurs in the new generation. Because most Java objects have the characteristics of being born and destroyed, Minor GC is very frequent and the recovery speed is generally relatively fast.
Old generation GC (Major GC / Full GC): refers to the GC that occurs in the old generation. When Major GC appears, it is often accompanied by at least one Minor GC (but not absolutely, in the collection strategy of the Parallel Scavenge collector). Perform the strategy selection process for Major GC). The speed of Major GC is generally more than 10 times slower than Minor GC.
(There is some doubt as to whether Full Gc refers to old GC or all GC.)
Full GC is a global garbage collection in Java. It performs garbage collection in the entire heap space and cleans up the memory space occupied by all objects that are no longer referenced. Full GC is usually triggered under the following circumstances:
- When calling System.gc, the system recommends executing Full GC, but it is not necessarily executed.
- There is insufficient space in the old generation.
- There is not enough space in the method area.
- The average size of the old generation after passing Minor GC is greater than the available memory of the old generation.
- When the Eden area and survivor space1 (From Space) area are copied to the survivor space2 (To Space) area, if the object size is larger than the available memory of To Space, the object will be transferred to the old generation, and the available memory of the old generation is smaller than the object size.
- Full GC will also be triggered when the permanent generation is full, which will lead to the uninstallation of Class and Method meta-information.
It should be noted that Full GC will suspend application threads, which will have a greater impact on system performance. Therefore, the response strategy is usually to avoid the occurrence of Full GC as much as possible, or to choose the appropriate time to perform Full GC when necessary.
GC causes program to stall
Sometimes when troubleshooting problems, you need to pay attention to the fact that GC will cause the program to pause. You can add logs to view.
Add parameters -XX:+PrintGCApplicationStoppedTime -XX:+PrintGCDateStamps-Xloggc:gclog.log
OutOfMemoryError
In addition to the program counter, several other runtime areas of virtual machine memory may have OutOfMemoryError (hereinafter referred to as OOM) exceptions.
OutofMemortError
OutOfMemoryError is an error that a Java program may encounter when trying to allocate more memory. This usually happens when a program tries to create a large number of objects or large objects, and the Java Virtual Machine (JVM) cannot allocate enough memory space for them.
There are several possible reasons that may cause an OutOfMemoryError:
JVM out of heap memory: This is the most common cause. Java programs create objects in heap memory when they run. If there is insufficient heap memory, the JVM will throw OutOfMemoryError.
Insufficient space in the permanent generation (PermGen) or metaspace (Metaspace): The permanent generation is where the metadata and static variables of the class are stored. The metaspace is a concept introduced in Java 8 to replace the permanent generation. If there is insufficient space in these two areas, an OutOfMemoryError will also be thrown.
Stack depth is too large: Each thread has its own stack in the JVM for storing local variables and method calls. If the stack depth is too large and exceeds the JVM limit, OutOfMemoryError will also be thrown.
Methods to solve OutOfMemoryError:
Increase the heap memory size of the JVM: This can be achieved by adjusting the parameters for starting the JVM, such as using the -Xmx parameter to set the maximum heap memory size.
Optimize code: avoid creating a large number of objects or large objects, reuse objects as much as possible, and reduce memory consumption.
Check for memory leaks: A memory leak can cause a program to gradually consume more and more memory over a long period of time. Using Java memory analysis tools (such as VisualVM, MAT, etc.) can help detect memory leaks.
Use a more suitable data structure or algorithm: Some data structures or algorithms may consume more memory than others. Trying to use a more memory-efficient data structure or algorithm may help solve the problem.
Adjust other memory parameters of the JVM: for example, adjust the size of the permanent generation or metaspace, or adjust the stack size, etc.
Note: When dealing with OutOfMemoryError, the most important thing is to determine the cause of the problem. This may require using a memory analysis tool, or carefully reviewing the code to determine if there are memory leaks or other issues. Merely increasing the memory size of the JVM may only be a temporary solution and the problem may reoccur if the root cause of the problem is not addressed.
Java heap overflow
The Java heap is used to store object instances. As long as objects are continuously created and there is a reachable path between GC Roots and objects to prevent the garbage collection mechanism from clearing these objects, memory will be generated after the number of objects reaches the maximum heap capacity limit. Overflow exception. The following example code limits the size of the Java heap to 20MB and cannot be expanded (setting the minimum value of the heap -Xms parameter and the maximum value of the -Xmx parameter to the same value can avoid automatic expansion of the heap). The virtual machine can be enabled through the parameter -XX:+HeapDumpOnOutOfMemoryError. When a memory overflow exception occurs, Dump the current memory heap dump snapshot for subsequent analysis.
HeapDumpOnOutOfMemoryErrorIt is a parameter of the Java Virtual Machine (JVM). When the JVM occursOutOfMemoryError, it will automatically generate a heap dump file (Heap dump file). This file is usually used for subsequent memory analysis.Add in the JVM parameters
-XX:+HeapDumpOnOutOfMemoryError, for example:java -XX:+HeapDumpOnOutOfMemoryError -jar yourApp.jarWhen the program runs , a heap dump file named (where is the ID of the Java process)OutOfMemoryErrorwill be generated in the project directory .java_pid<pid>.hprof<pid>It should be noted that this approach does not solve
OutOfMemoryErrorthe problem itself, but only provides a convenient way to perform subsequent memory analysis to find out the cause of memory exhaustion.
import java.util.List;
import java.util.ArrayList;
public class HeapOOM {
    static class OOMObject {
    }
    public static void main(String[] args) {
        List<OOMObject> list = new ArrayList<OOMObject>();
        while (true) {
            list.add(new OOMObject());
        }
    }
}
VM Args:-Xms20m -Xmx20m -XX:+HeapDumpOnOutOfMemoryError

Configure parameters in the edit configurations of idea.
Run method
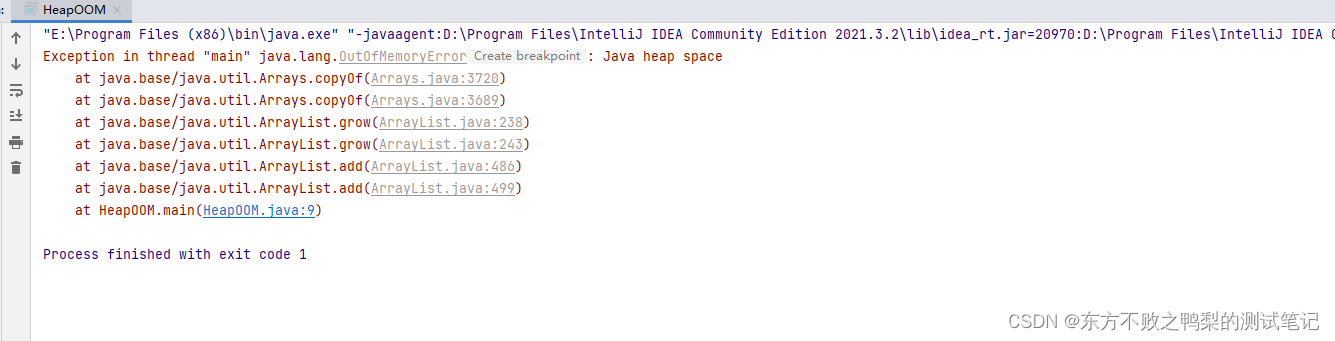
You can see that a memory overflow occurred.
The OOM exception of Java heap memory is a common memory overflow exception in practical applications. When a Java heap memory overflow occurs, the exception stack information "java.lang.OutOfMemoryError" will be followed by a further prompt of "Java heap space".
To solve the anomaly in this area, the general method is to first analyze the heap dump snapshot from the Dump through a memory image analysis tool (such as Eclipse Memory Analyzer). The focus is to confirm whether the objects in the memory are necessary, that is, first Distinguish whether there is a memory leak (Memory Leak) or a memory overflow (Memory Overflow)
If it is a memory leak, you can further use tools to view the reference chain from the leaked object to GC Roots. Then we can find out how the leaked objects are associated with GC Roots and prevent the garbage collector from automatically recycling them. Once you master the type information of the leaked object and the information of the GC Roots reference chain, you can more accurately locate the location of the leaked code. If there is no leak, in other words, the objects in the memory must still be alive, then you should check the virtual machine's heap parameters (-Xmx and -Xms) and compare it with the machine's physical memory to see if it can still be increased. Check the code to see if some objects have a too long life cycle or hold state for too long, and try to reduce the memory consumption during program running.
Garbage collection
Garbage Collection (GC)
The Java heap and method area are the memory areas that the garbage collector focuses on.
3 things the GC needs to do
What memory needs to be reclaimed?
When to recycle?
How to recycle?
Reachability analysis algorithm
Reachability Analysis (Reachability Analysis) to determine whether the object is alive. The basic idea of this algorithm is to use a series of objects called "GC Roots" as the starting point, and search downward from these nodes. The path traveled by the search is called the reference chain. When an object reaches the GC When the Roots are not connected by any reference chain (in graph theory terms, this object is unreachable from the GC Roots), it proves that the object is unavailable.
Garbage collection algorithm
Mark-and-sweep algorithm
Replication algorithm
Mark-collation algorithm
Generational collection algorithm
Generally, the Java heap is divided into the new generation and the old generation, so that the most appropriate collection algorithm can be used according to the characteristics of each generation. In the new generation, every time a garbage collection is performed, it is found that a large number of objects have died and only a few survive. Then use the replication algorithm, and only need to pay the cost of copying a small number of surviving objects to complete the collection. In the old generation, because the object survival rate is high and there is no extra space to guarantee its allocation, the "mark-clean" or "mark-clean" algorithm must be used for recycling.
garbage collector
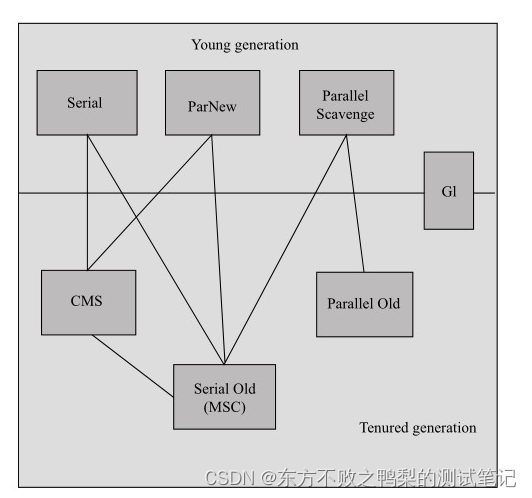
Collector based on HotSpot virtual machine after JDK 1.7 Update 14
If there is a connection between two collectors, they can be used together. The area where the virtual machine is located indicates whether it belongs to the new generation collector or the old generation collector.
There is no best collector, and there is no universal collector, so we only choose the most suitable collector for specific applications.
serial collector
While it is collecting garbage, all other worker threads must be paused until it is done collecting. Advantages: Simple and efficient, the Serial collector is a good choice for virtual machines running in Client mode.
ParNew collector
In fact, it is a multi-threaded version of the Serial collector.
The number of collection threads enabled by default is the same as the number of CPUs
Parallel Scavenge Collector
The goal is to achieve a controllable throughput
Parallel Scavenge collector is also often called "throughput first" collector
CMS collector
For the first time, the garbage collection thread and the user thread (basically) work at the same time.
The CMS (Concurrent Mark Sweep) collector is a collector that aims to obtain the shortest collection pause time. At present, a large part of Java applications are concentrated on the servers of Internet websites or B/S systems. Such applications pay special attention to the response speed of the service and hope that the system pause time will be the shortest to provide users with a better experience.
CMS is an excellent collector, and its main advantages are reflected in its name: concurrent collection, low pauses
Serial Old Collector
It is also a single-threaded collector that uses a "mark-and-sort" algorithm. The main significance of this collector is also to be used by virtual machines in Client mode.
Parallel Old Collector
Parallel Old is the old generation version of the Parallel Scavenge collector, using multi-threading and the "mark-compact" algorithm
G1 Collector
The G1 (Garbage-First) collector is one of the most cutting-edge achievements in the development of collector technology today.
The G1 collector has parallel concurrent collection, generational collection, space sorting, and predictable pauses.
Memory allocation strategy
Objects are allocated in Eden first. In most cases, objects are allocated in the new generation Eden area. When the Eden area does not have enough space for allocation, the virtual machine will initiate a Minor GC.
Large objects directly enter the old generation. The so-called large objects refer to Java objects that require a large amount of continuous memory space. The most typical large objects are long strings and arrays (the byte[] array in the example listed by the author is Typical large object
Long-lived objects will enter the old generation
Memory recycling and garbage collectors are often one of the main factors that affect system performance and concurrency capabilities. The reason why virtual machines provide a variety of different collectors and a large number of adjustment parameters is because they can only be implemented according to actual application requirements. Only by choosing the optimal collection method can you obtain the highest performance. There is no fixed collector, parameter combination, and optimal tuning method, so the virtual machine has no inevitable memory recycling behavior. Therefore, to learn virtual machine memory knowledge, if you want to reach the practical tuning stage, you must understand the behavior, advantages and disadvantages, and adjustment parameters of each specific collector.
Memory usage
In addition to the Java heap and permanent generation, we noticed that the following areas will also occupy more memory. The sum of all memory here is limited by the maximum memory of the operating system process.
Direct Memory: The size can be adjusted through -XX:MaxDirectMemorySize. When there is insufficient memory, OutOfMemoryError or OutOfMemoryError: Direct buffer memory is thrown.
Direct Memory mainly involves Java's NIO library. It is not part of the virtual machine runtime data area, nor is it a memory area defined in the Java virtual machine specification. It is a memory area outside the Java heap and applied directly to the system. Native memory is usually operated through the DirectByteBuffer stored in the heap. .
Because the read and write performance of direct memory is usually higher than that of the Java heap, you may consider using direct memory if there are frequent reads and writes. Java's NIO library allows Java programs to use direct memory for data buffers.
Thread stack: The size can be adjusted through -Xss. When there is insufficient memory, a StackOverflowError (cannot be allocated vertically, that is, a new stack frame cannot be allocated) or OutOfMemoryError: unable to create new native thread (cannot be allocated horizontally, that is, a new thread cannot be created) will be thrown. .
Socket buffer area: Each Socket connection has two buffer areas, Receive and Send, which occupy approximately 37KB and 25KB of memory respectively. If there are many connections, this memory usage will also be considerable. If the allocation cannot be made, an IOException: Too many open files exception may be thrown.
JNI code: If JNI is used in the code to call the local library, the memory used by the local library is not in the heap.
Virtual machine and GC: The code execution of virtual machine and GC also consumes a certain amount of memory.
The content of this article is excerpted from "In-depth Understanding of Java Virtual Machine: JVM Advanced Features and Best Practices"