Observium is a network monitoring tool based on Python and MySQL available for free as a Community Edition. It provides real-time information about detected devices, including their health and traffic through selected ports. Observium can utilize SNMP, WMI, or agents for monitoring devices.
Install Observium on Ubuntu
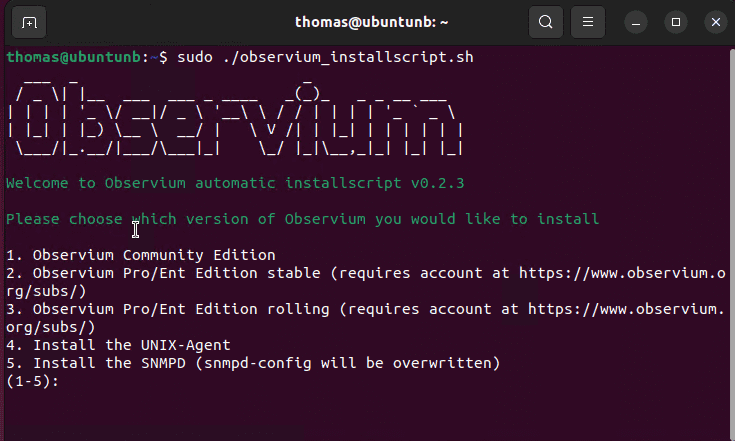
It's straightforward to install using a script on Ubuntu/Debian:
wget http://www.observium.org/observium_installscript.sh
chmod +x observium_installscript.sh
./observium_installscript.sh
Root permissions are required to execute the script. It launches a setup assistant guiding you through the entire process. Once deployed, Observium operates on an Ubuntu computer just as when running as a container.
Installation of Observium via setup script on Ubuntu
To install the free Community Edition, select option 1. Then set the password for the MySQL database and complete the installation.
After installing, create a user for administration. Additionally, the Unix agent for monitoring the local server can be installed during setup. It consists of a collection of scripts.
Getting started with Observium
After installation, open the web interface via the host's IP address. Use the username 'admin' and the password set during the setup.
Observium presents its data in a web interface
Under Devices, the local server or container should already be displayed. Clicking on the server, Observium displays CPU and memory usage, disk activity, server information, network traffic, and event logs.
Connecting devices to Observium
No agent is required on end devices for connectivity. Observium can also read data via SNMP if activated on the end device. For SNMP, ensure that the "Community String" label on clients and Observium matches.
To add new devices to Observium, go to Devices => Add Device. Enter either the device name (if DNS resolution is correctly configured) or the IP address.
To connect multiple devices, it's simpler to use the CLI. Use the script add_device.php located in the Observium installation directory. The script syntax is:
./add_device.php <hostname> [community] [v1|v2c] [port] [udp|udp6|tcp|tcp6]
Integration of Linux machines
To allow Observium to read data from Linux computers, install an SNMP daemon on the client. For Ubuntu/Debian:
sudo apt-get install snmpd -y
SNMP settings can be controlled with the configuration file snmpd.conf located in /etc/snmpd.
Collecting data from Windows via WMI
Besides SNMP, Observium can also use WMI to read data from Windows Server, including monitoring workloads such as Exchange or SQL Server. To do this, install WMIC in Observium:
wget https://www.observium.org/files/wmic_1.3.16_static_64bit.tar.gz tar zxvf wmic_1.3.16_static_64bit.tar.gz mv wmic winexe /usr/bin
To check if WMI works, use:
./wmic --version
To allow Observium to read Windows data, appropriate permissions must be granted. The developers detail the required steps in the documentation.
Display information
If properly configured, Observium will display all data captured from a device, like a network printer, and can be found under Devices => All Devices.
Clicking on the new device displays information through the menu items Overview, Graphs, Logs, and Alerts.
After some time, clicking on devices under Graphs will display data on availability, uptime, running processes, logged-in users, and other information.
Grouping ports
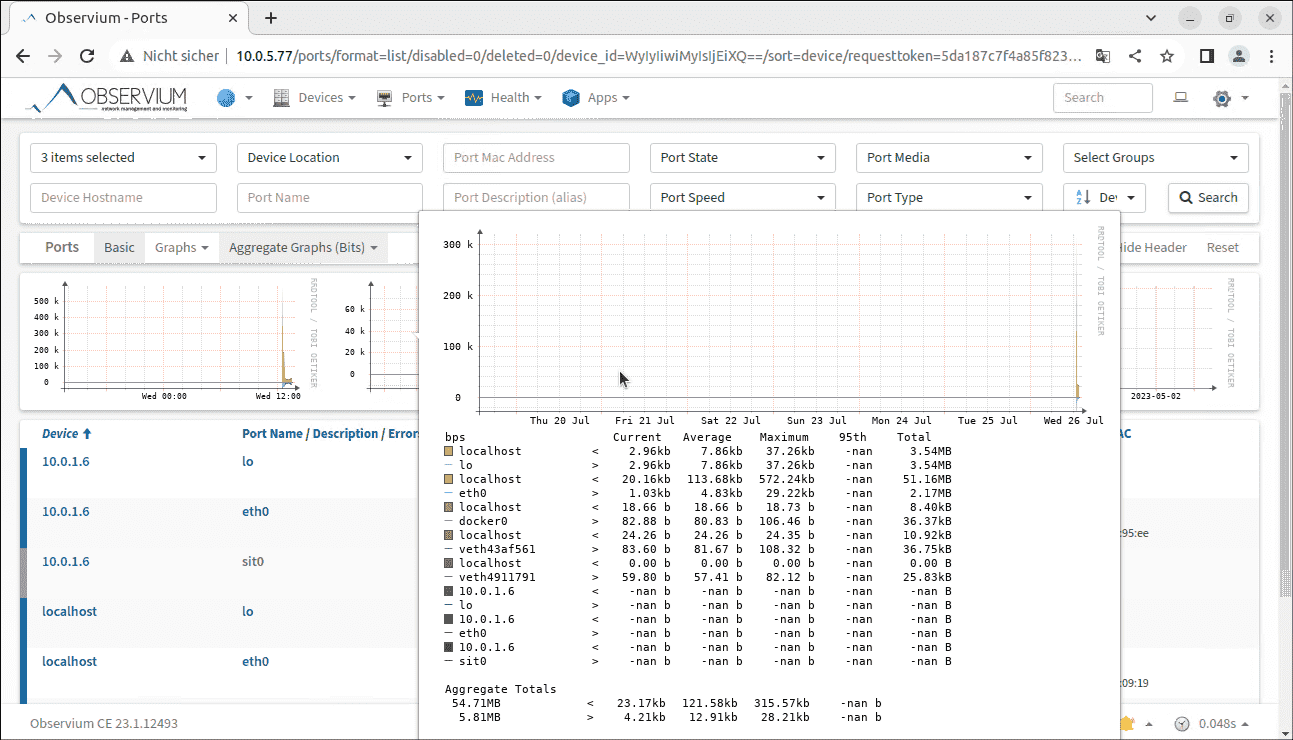
Observium can also group specific areas. For instance, it can display certain ports across multiple or all devices, including their traffic. This makes identifying packet losses with Observium relatively straightforward. The project's excellent documentation aids in setup and management.
For such a comprehensive port view, select the devices whose ports should be monitored at the top right under Devices.
Monitoring ports of multiple devices
Retrieving health information
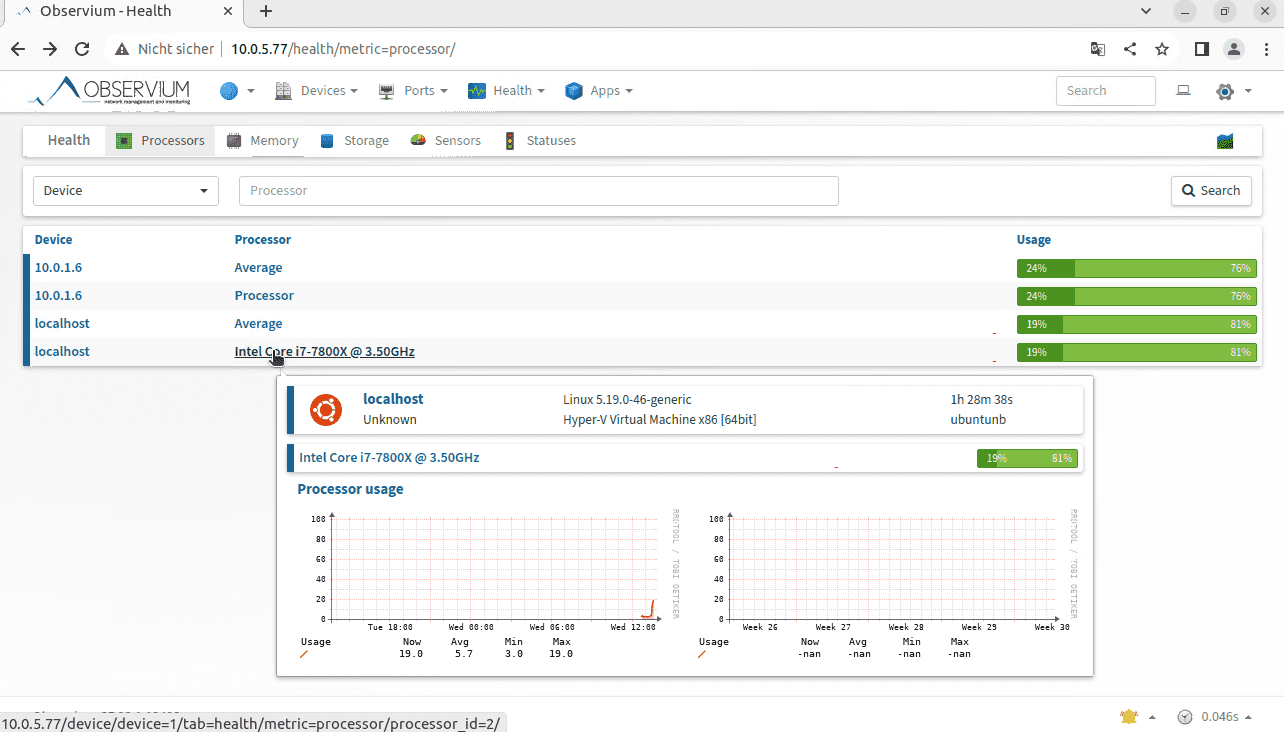
The Health menu displays CPU or memory utilization for all desired devices. If Observium can determine the processor's name and version, they will also be displayed.
Under the health information, you can also see metrics such as CPU metrics.
Among other things the CPU metrics can be found under the health information
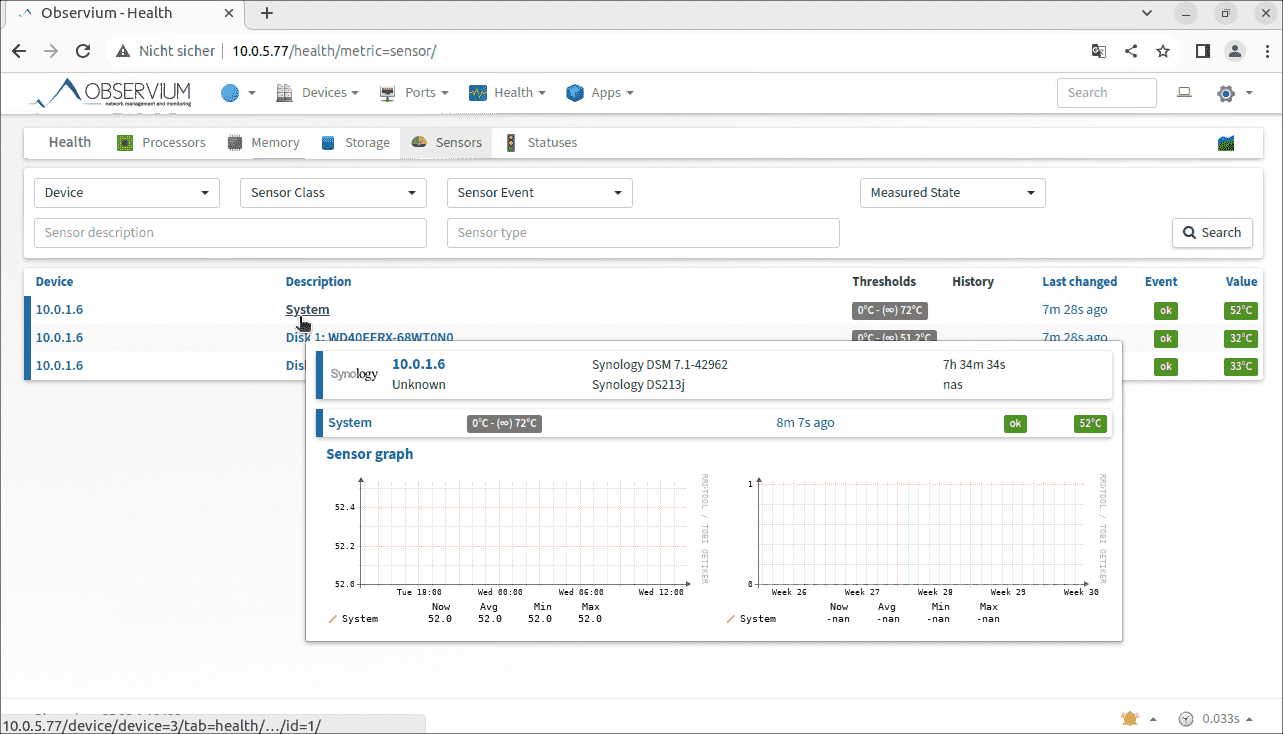
You can also collectively read sensor data that sends data via agent, SNMP, or WMI.
Display of data for specific sensors
When you hover the mouse over one of the sensors, the web interface displays the associated graphs. In the example of the screenshot above, you can see the utilization of a Synology NAS that is connected via SNMP.
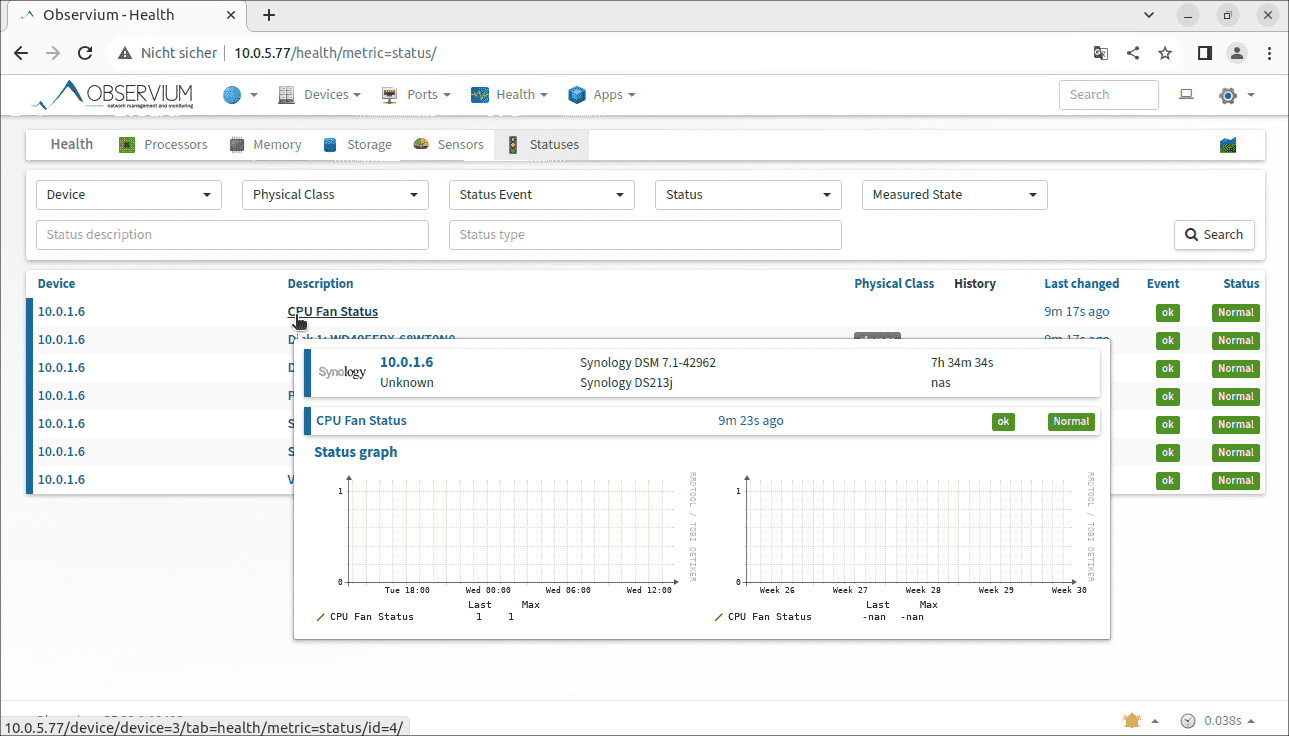
Observium also displays data on the status of the device's system components.
Monitoring the CPU fan on a Synology NAS
Configure alarms and alerts
An important feature of monitoring software is that it can notify admins about impending or existing problems. Observium is capable of this too.
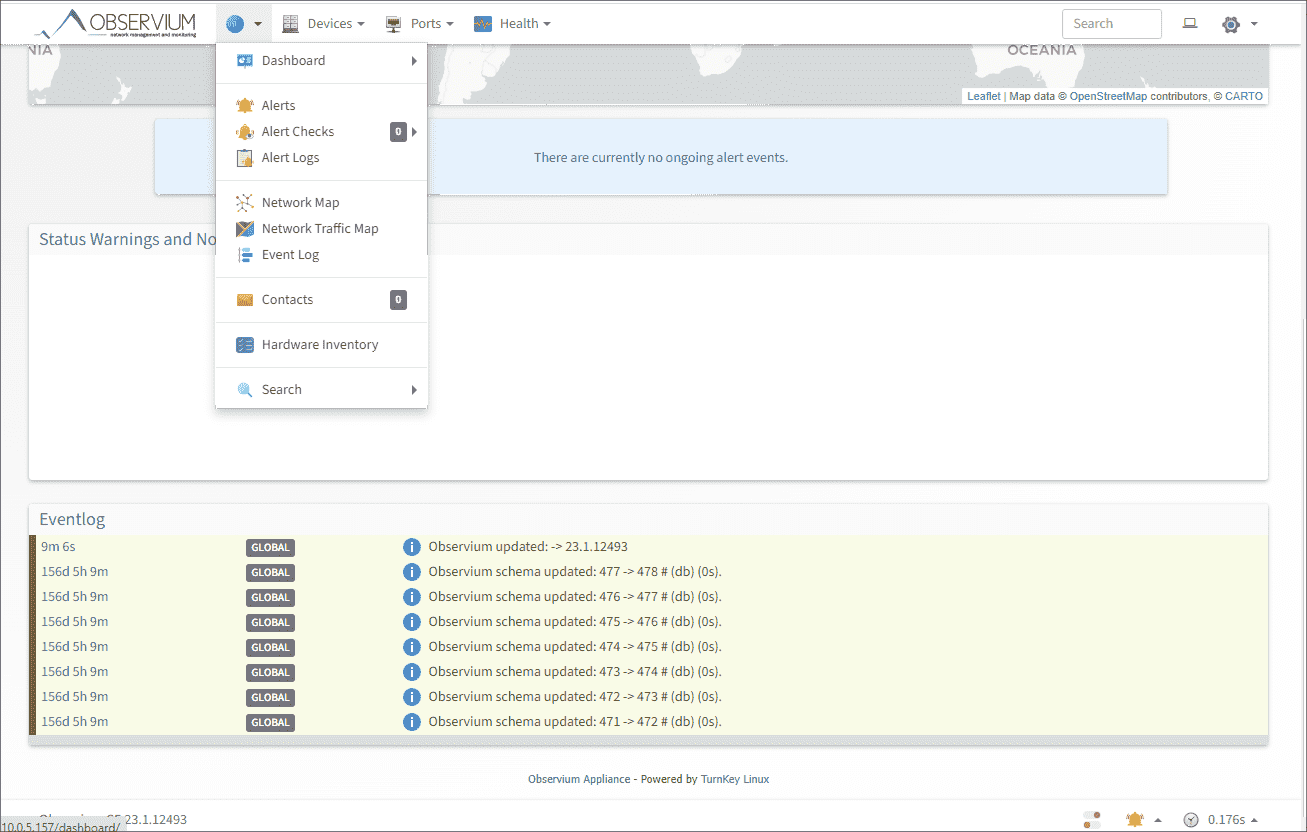
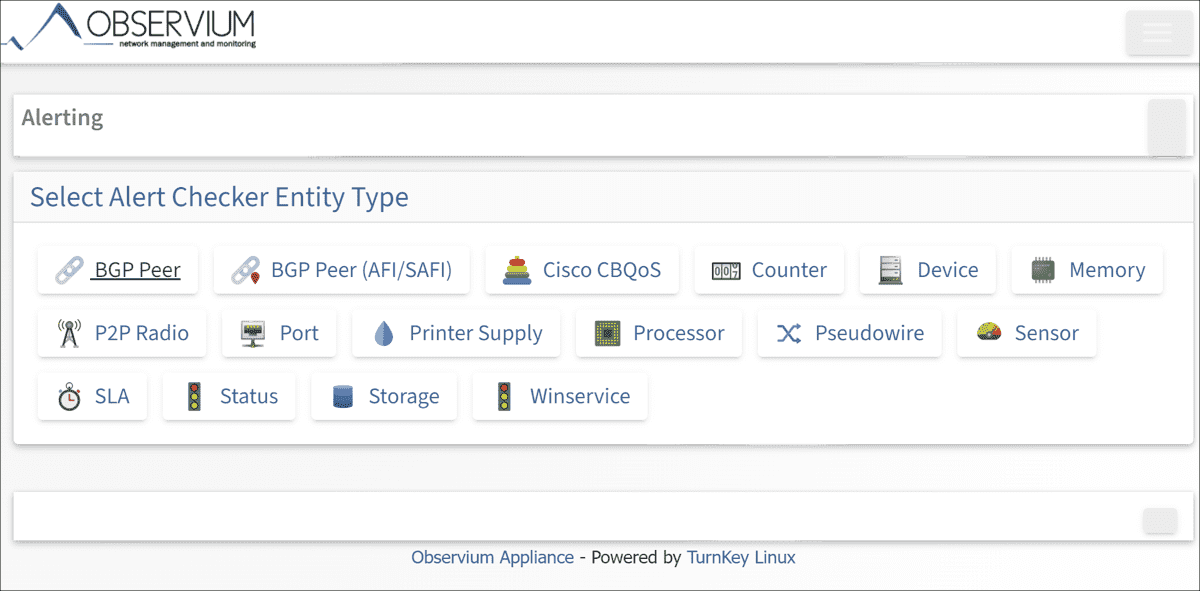
By clicking on the icon in the top left, you can access the relevant menu items. New alarms are created with Alert Checks => Create New Checker. After that, you choose what the alarm should monitor.
Selection of options for setting up an aler
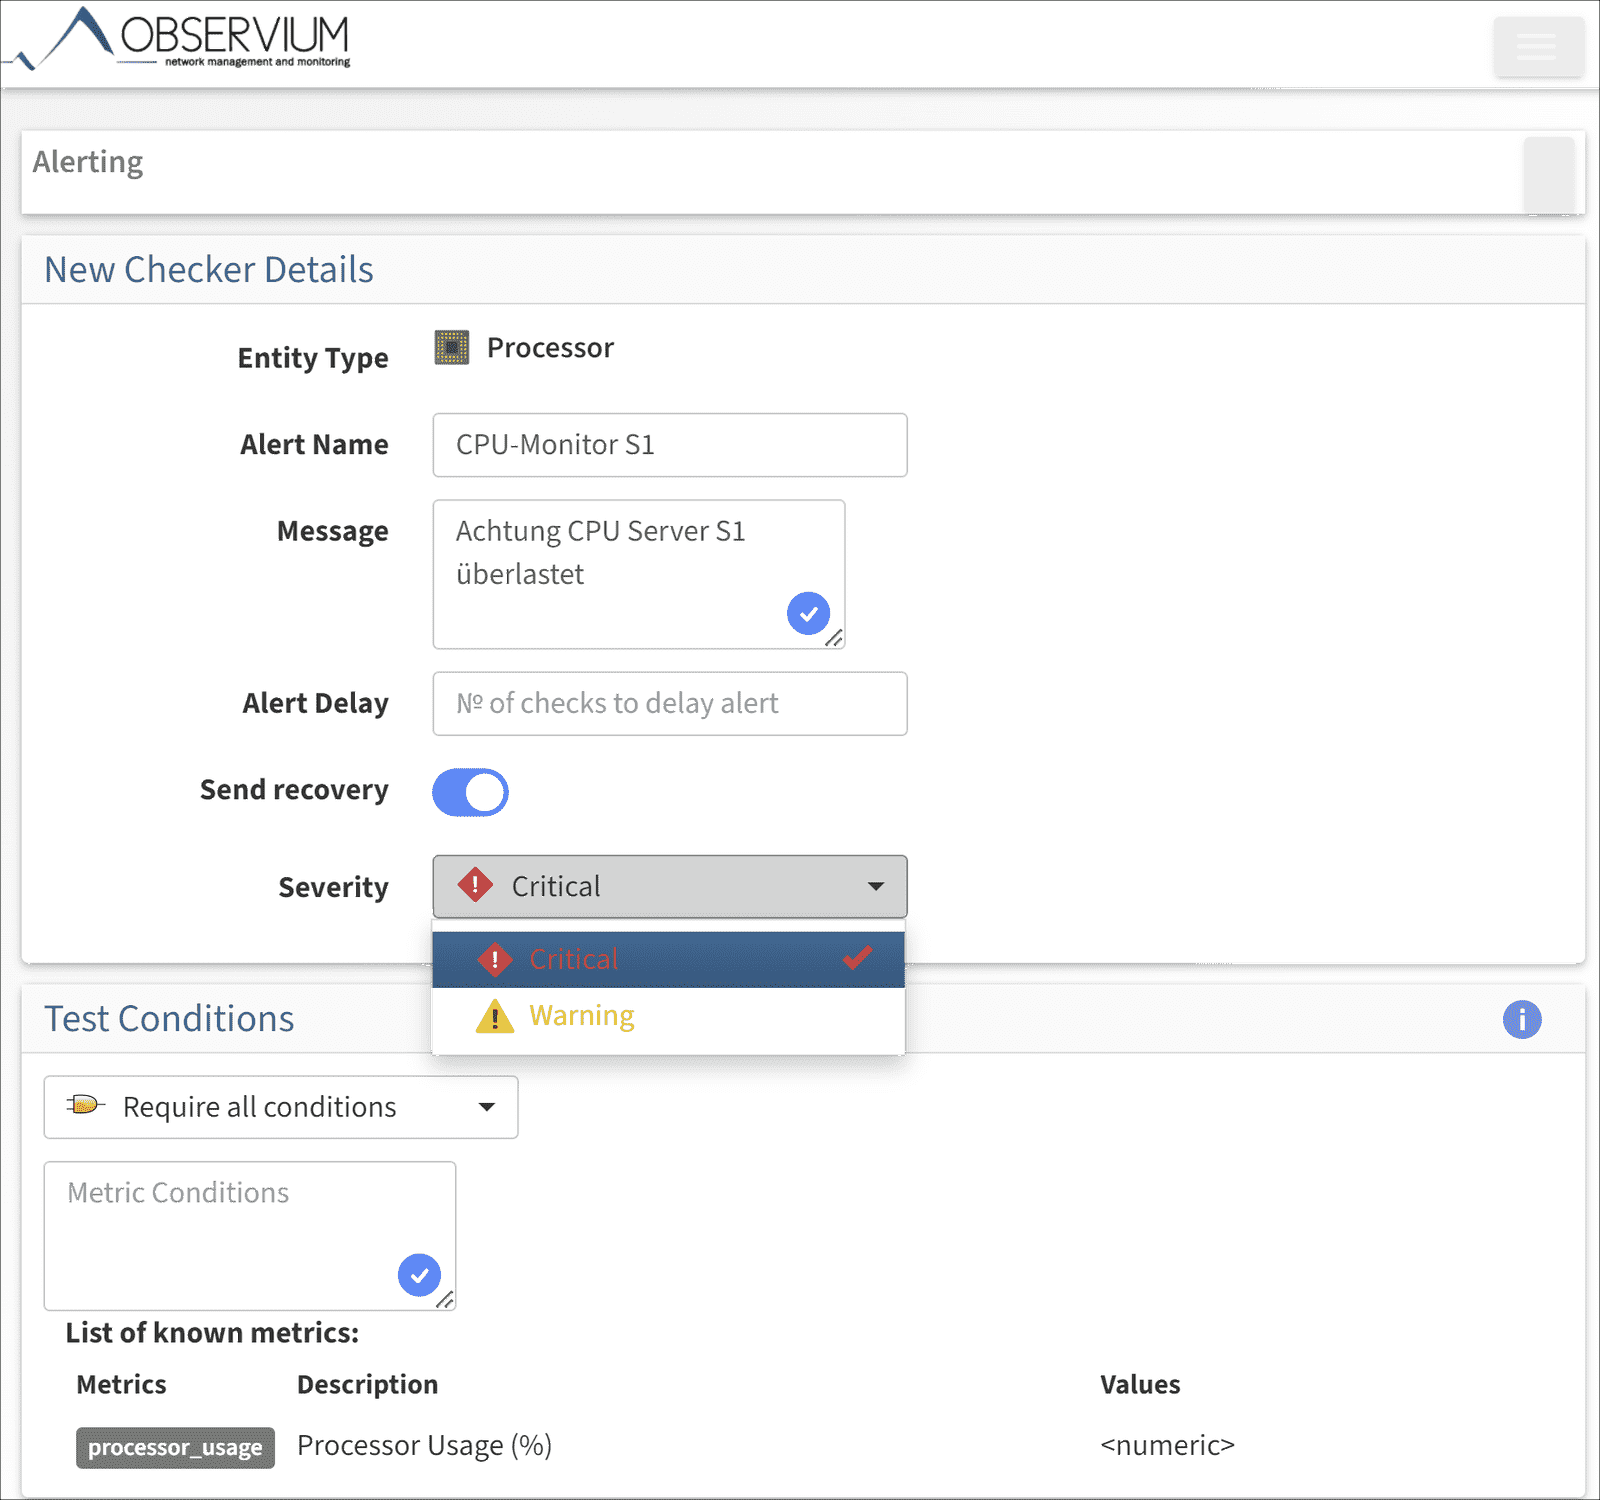
When configuring the alert, using the processor monitoring as an example, you determine at what load Observium should notify the admin. The comprehensive setting options are documented here.
Configure an alarm based on CPU usage
Availability
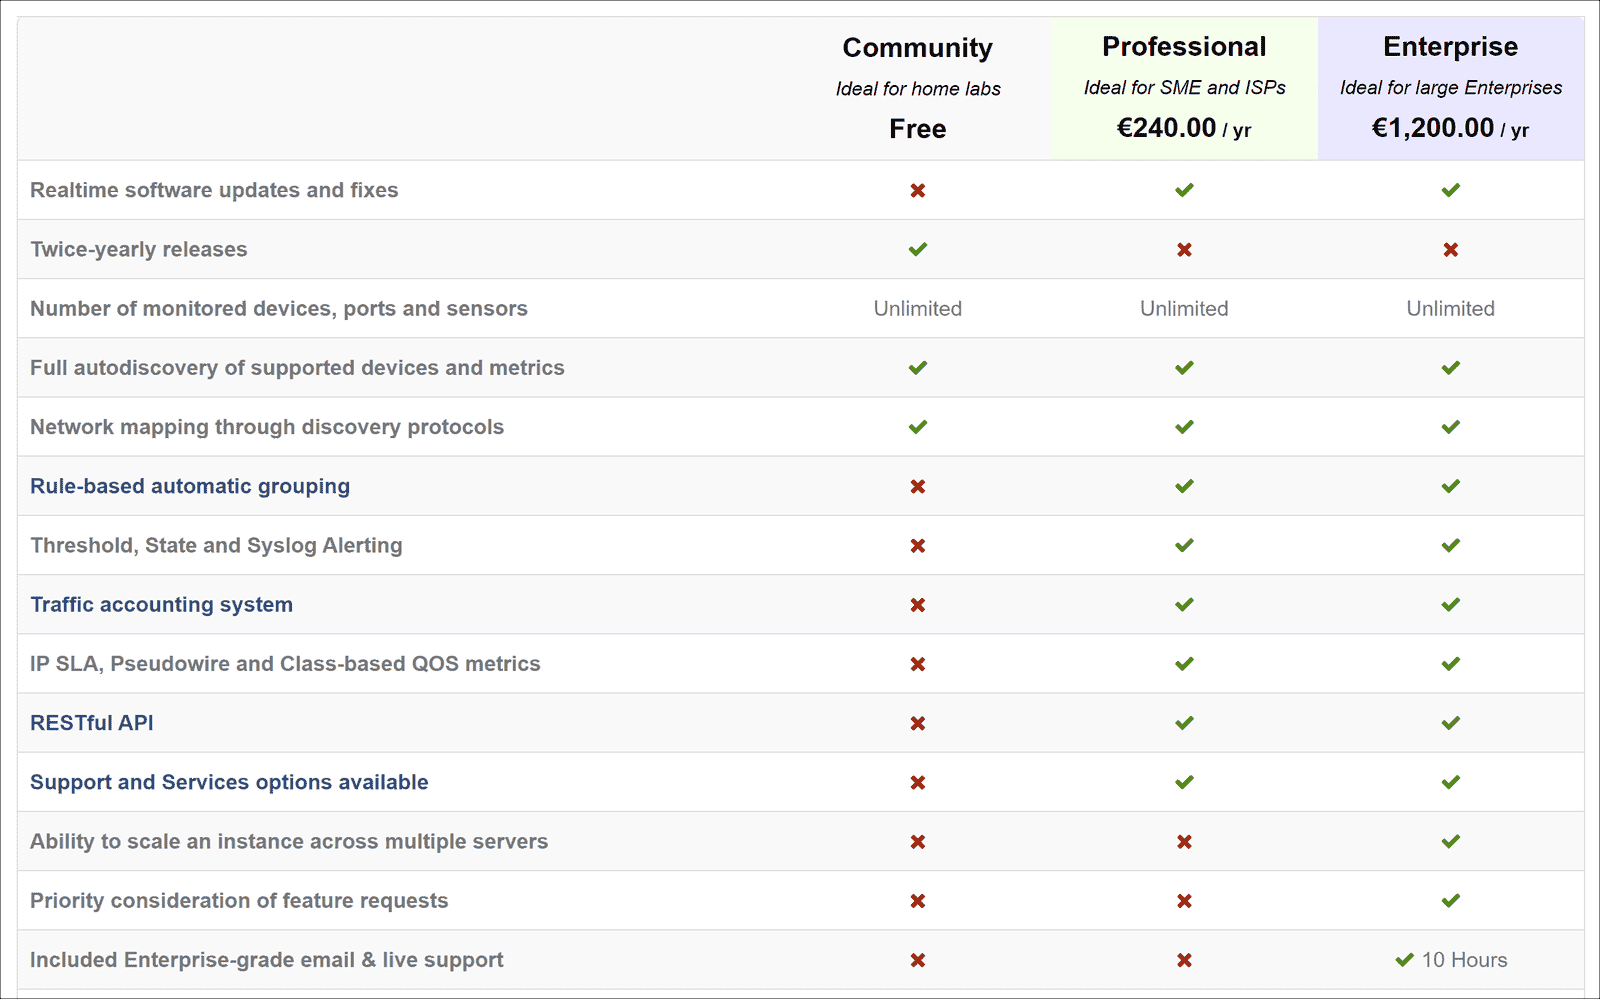
The free Community Edition of Observium can be downloaded from the project's website. In addition, there are the Professional editions for 240 euros per year and Enterprise for 1,200 euros per year.
Subscribe to 4sysops newsletter!
Comparison of Observium editions
Those who want to try out the software without installing it can do so in the online demo environment. It is available here.
