Experiment 1: Implementing DC motor system model identification
1. Experimental equipment and software
1. Hardware equipment: computer, NI ElvisⅡ experimental platform, Quanser QNET DC motor.
2. Software system: Win7 system, Labview2015 development software.


Read "Automatic Control Principle Experiment Guide" P38-2.1.2 to learn about Quanser QNET DC motor.
2. Experimental steps
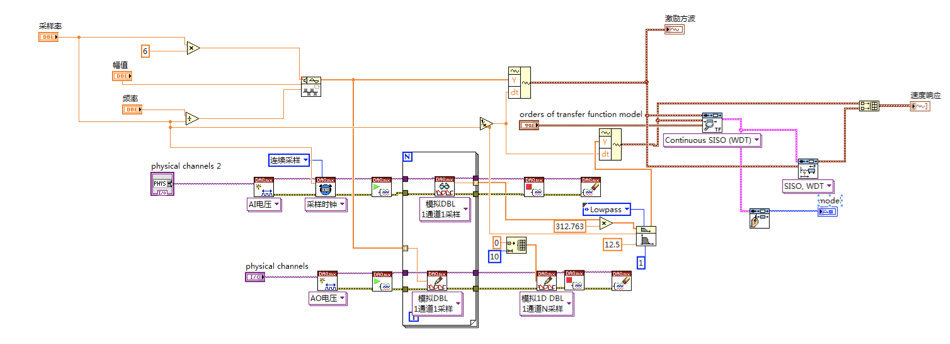
1. Study the routines and become familiar with LabVIEW and controls such as square wave, filter, waveform generation, and system identification. Program to realize system identification of Quanser QNET DC motor and obtain the model parameters of the motor. Physical port: input AI#4, output AO#0.
2. After debugging the system, save and record the curve graphs and identification results at the initial values of amplitude, frequency, and sampling rate, and then compare and record the curve changes and identification results when the amplitude, frequency, and sampling rate increase or decrease.
3. Labview program design diagram
Design ideas
When using LabView for control, the program block diagram is designed according to the experimental purpose and experimental equipment, and a hardware circuit is built to assist in completing the experiment. After the circuit is built, explore it according to the experimental design and analyze the experimental phenomena. According to the block diagram of the program block diagram, it is divided into the waveform generation part and the waveform measurement part. When designing, pay attention to the device requirements and differences between the front panel and the rear panel to ensure that the program block diagram is correct.
The greater the voltage of a given square wave, the greater the motor speed. However, because the square wave contains infinite frequency components, it is difficult to achieve a standard square wave in actual operation, and most of them are approximate square waves. Due to the effects of damping, rise time, etc., there is a certain difference between the actual speed and the theoretical speed. First, you need to set the frequency and amplitude parameters of the square wave, and set the sampling rate of the system. By adjusting these three parameters and the identified motor model.
4. Experimental results and analysis
Measurement results of initial set value
Sampling rate=250Hz, amplitude=3V, frequency=0.5HZ
Measurement results after changing the voltage amplitude
Under the condition of fixed sampling rate = 250Hz and frequency = 0.5Hz, change the amplitude and observe the experimental phenomenon.


As can be seen from the above figure, the increase in amplitude obviously leads to an increase in the proportion coefficient of the motor model and an increase in parameter T. When the amplitude is small, the model fitting effect is poor. This is because when the amplitude is small, the external interference is relatively large, and the error will be more obvious.
Measurement results after changing the sampling rate
Under the condition of fixed frequency = 0.5Hz and amplitude = 3V, change the sampling rate and observe the experimental results.


Sampling rate 300 Sampling rate 250 Sampling rate 200
It can be seen from the above figure that the higher the sampling rate, the more accurate the speed curve obtained, the better the fitting effect of the model, and the closer the speed response is to the square wave. According to the Nyquist sampling theorem, the signal can be reconstructed as long as the sampling rate is greater than the band limit of the excitation waveform. However, the velocity response cannot be a standard square wave because the square wave contains infinite frequency components, and the square wave cannot be restored at any high sampling rate.
Measurement results after changing the frequency
Under the condition of fixed sampling rate = 250Hz and amplitude = 3V, change the frequency and observe the experimental results.


It can be seen from the above figure that frequency affects the response time. The greater the frequency, the smaller the zero point of the transfer function and the shorter the response time. That is, the waveform period of the speed response changes inversely with the frequency, and the motor model does not change much.
4. Problems encountered in the experiment and their solutions
During the experiment, it was found that the results of this group were slightly different from the experimental result curves of other groups. After consulting the teacher, I understood that the experimental results have a lot to do with the motors of each group. Because the experiment samples actual motors, the degree of fitting of the model is related to the motors.
5. Experiment summary
Experimental results show that parameters such as amplitude, sampling rate, and frequency affect the system transfer function and the fitting effect of the model to a certain extent. When the amplitude is slightly larger, the system sampling rate is high enough, and the frequency is large, the fitting of the model is better. The effect is better. In this experiment, based on the routines provided by the teacher, we recalled how to use LabView, and used program block diagrams and hardware circuits to complete the experiment content. Some problems were encountered during the experiment. Finally, through consulting the teacher, I understood that there is a great relationship between the experiment and the hardware. We cannot take it for granted that the same result will be obtained if the program is correct.