1. Background

Because in our daily use of the Linux system, we will encounter system crashes from time to time, but at this time, in addition to displaying a warning character, the system interface does not perform any other operations, leaving us to either restart or wait in embarrassment. instruction. So in the face of this situation, is there any room for maneuver? Not necessarily, maybe we can find a way out of desperate situations.
Resource links: Linux memory management subsystem , centos7 tuning
2. Linux system crashes
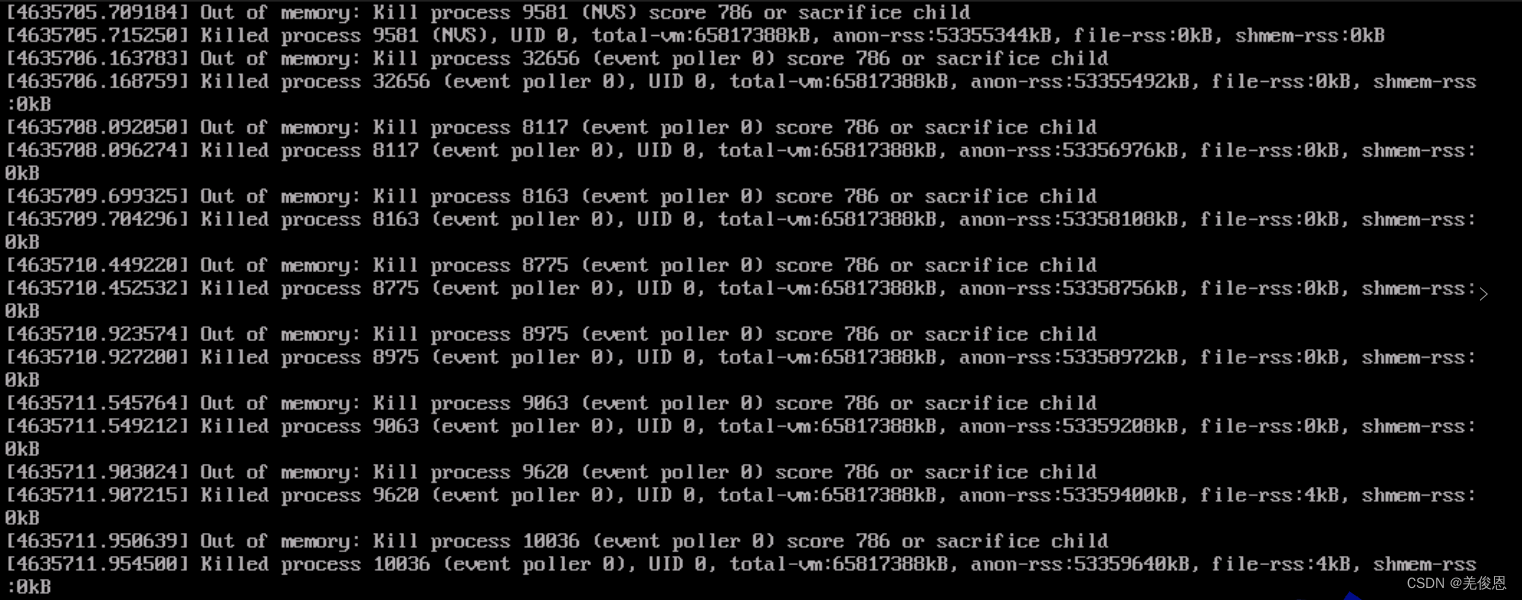
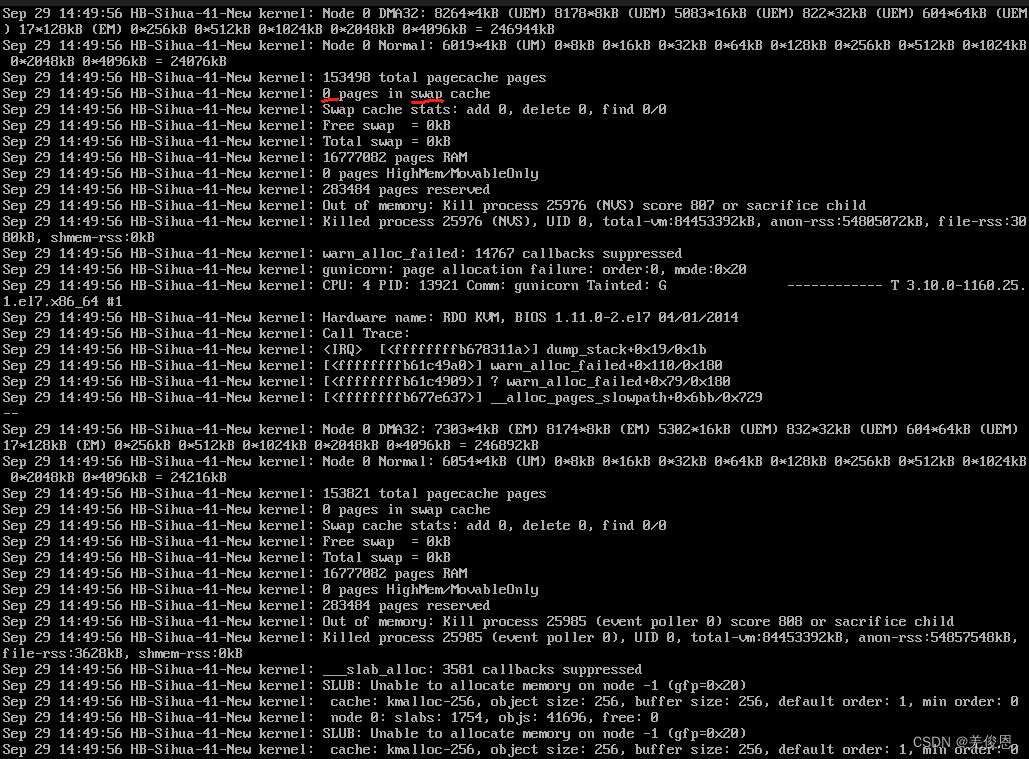
2.1、OOM
OOM is the abbreviation of Out of Memory, which means insufficient memory. It is a mechanism by which the Linux kernel forcibly releases process memory when the system memory is seriously insufficient. Possible reasons include system bugs and memory leaks. Sometimes the service is overloaded, such as the number of connections soaring in a short period of time, the large amount of data causing the memory to soar, and OOM downtime; in addition, it is caused by Java programs, the most common of which are four categories: Heap overflow (Heap), Stack overflow (Stack) ), permanent generation overflow (constant pool/method area), direct memory overflow.
For cloud hosts, when the global memory of the instance or the memory of the cgroup within the instance is insufficient, the Linux operating system will first trigger the memory recycling mechanism to release memory, and allocate this part of the released memory to other processes. If the memory recycling mechanism cannot handle the situation of insufficient system memory, the system will trigger the OOM Killer to force the release of the memory occupied by the process.
2.2. Memory structure

In the Linux kernel, how to manage the allocation, recycling, exception triggering and processing of all memory resources in the system and other related logic implementations? This involves the memory management subsystem , which uses nodes and zones. And page (page)** three-level structure describes physical memory. Memory node (Node) is the top-level structure of "memory management". The lower layers are regions and pages; the memory management subsystem will manage memory according to a certain algorithm and provide a calling interface to users to handle user memory allocation and reallocation. , release and creation, initialization, and deletion of memory partitions (objects), including the implementation of virtual memory and request paging, memory allocation of kernel internal structures and user space programs, mapping files to process address space, etc. Users do not need to worry about memory management, but only need to call the calling interface provided by the memory management mechanism. Most of its configuration is available through the /proc file system and can be queried and tuned using sysctl. The memory management subsystem supports 3 memory models:

(1) Flat Memory : The physical address space of the memory is continuous and has no holes.
(2) Discontiguous Memory : There are holes in the physical address space of the memory. This model can handle holes efficiently. The system contains multiple physical memories, and there is a hole between the physical address spaces of the two memories. Of course, there may also be holes in the physical address space of a piece of memory. If the physical address space of the memory is continuous, it will not incur additional overhead and reduce performance like the discontinuous memory model, so the smooth memory model performs better.
(3) Sparse Memory : There are holes in the physical address space of the memory. If you want to support memory hot-plugging , you can only choose the sparse memory model.

☛ Memory management model diagram:


In the NUMA non-uniform memory access architecture, the CPU is divided into multiple nodes. Each node has its own "memory controller" and "memory slot". The CPU accesses the memory on its own node very quickly, but accesses other nodes. The memory of the CPU is very slow; UMA (Uniform Memory Access) unified memory access architecture/SMP symmetric multi-processor architecture is a system with a NUMA architecture as one node; the "memory node" in the NUMA non-uniform memory access structure, according to " The distance between the processor and the memory "divides" memory nodes; in the NUMA architecture of discontinuous memory, "memory nodes" are divided according to "whether the physical address is continuous", and each memory block with continuous physical address is a "memory node"; In the code structure, node_zones is the memory area array; nr_zones is how many "memory areas" the "memory node" contains; node_id is the node identifier; node_start_pfn is the starting physical page number of the "memory node"; node_present_pages is the physical page The total number; node_spanned_pages is the total size of the range of physical pages, which includes the size of "memory holes";
1. Page : Sometimes also called page frame. In the kernel, the memory management unit MMU (the hardware responsible for converting virtual addresses and physical addresses) uses the physical page as the basic unit of memory management. Different architectures support different page sizes. Each page will correspond to an instance of struct page. Generally 4KB. Generally speaking, 32-bit architectures support 4KB pages, and 64-bit architectures generally support 8KB page sizes. The MIPS64 architecture host I am currently using supports a page size of 16KB. If the host system you are using is Linux. We can use the following command to check the memory page size of the current host: getconf PAGE_SIZE; if the content of the page has changed compared with the data on the hard disk, it is set to PG_dirty. The page with this flag set is called a dirty page.
2. Area: It is a larger concept than page. Zones are used in the kernel to group pages with similar characteristics. Linux mainly uses four zones:
ZONE_DMA: The pages in this zone can perform DMA operations.
ZONE_DMA32: The function is the same as ZONE_DMA. The difference is that the pages in this zone can only be accessed by 32-bit devices.
ZONE_NORMAL: Normally addressable pages. General-purpose memory can allocate the required pages from this zone
ZONE_HIGHEM: generally to solve the address mapping when the physical memory is greater than the amount of virtual memory. For example, on an IA-32 system, the amount of physical memory that can be directly managed does not exceed 896MiB. Memory above this value can only be addressed through upper memory. At present, most large chips have a 64-bit architecture and can manage a huge address space, so ZONE_HEGHEM is basically not used.
In the NUMA model, a storage node Node node is associated with a processor in the system and is represented as an instance of pg_data_t in the kernel. From the perspective of system architecture, hosts can be divided into the following categories:
UMA(Consistent memory access) structure: Each CPU shares the same physical memory, and the time required for each CPU to access any address in the memory is the same. Therefore, this type of structure is also called: Symmetric Multiprocessor Structure (SMP).
NUMA (Non-Uniform Memory Access): Each CPU has local memory that supports extremely fast access. Each CPU is connected through a bus to support local memory access to other CPUs, which is of course slower than accessing local memory. In the kernel of NUMA architecture, memory is divided into nodes. It can be easily understood: each node is associated with a processor in the system; one CPU or multiple CPUs correspond to one node Node, one node can be divided into multiple zones, one zone manages multiple pages, and the pages are managed by the kernel. the smallest unit.
3. Page table (pgtable): The data structure used to map virtual address space to physical address space is called page table.
4. Slab allocator: Usually the problem we face is that a certain data structure (or object) will be allocated and released frequently. The two problems this will bring are memory fragmentation and low efficiency. The way to solve this problem is to use caching mechanism (caching). It means to pre-allocate a relatively large space, and every subsequent memory application and release is an operation on this memory space. This cache can be composed of multiple slabs. The slab is composed of one or more physically continuous pages (usually a slab consists of only one page), which stores multiple objects with the same data structure.
5. Memory nodes: The main reason why Linux divides memory into nodes is to support the NUMA (Non-Uniform Memory Access) architecture. In a NUMA architecture, the processor can access local memory much faster than remote memory. Therefore, dividing the memory into multiple nodes, each of which has a certain amount of local memory and some local processors, can improve the efficiency and performance of memory access. In a UMA system with discontinuous memory, node represents a memory area with a higher level than the area. It is divided according to whether the physical address is continuous. Each piece of memory with continuous physical address is a memory node. It uses a pglist_data structure to describe the memory layout. ;Generally, there are as many nodes as there are CPU cores. Node consists of a continuous piece of physical memory hung under the same CPU, and is abstracted using pg_data_t in the kernel.


In NUMA storage mode, you can run the cat /proc/buddyinfo or numactl -H command to view memory node-related resource information.

☛ Related concepts:
1) Virtual memory: It is a memory management technology that allows programs to use more memory than actual physical memory. When a program needs to use memory, virtual memory copies a portion of the data from the hard disk into memory so that the program can continue executing. The Linux kernel uses a mechanism called page tables to manage virtual memory. Each process has its own page table , which contains virtual addresses and corresponding physical addresses. When a process needs to access a virtual address, the Linux kernel converts it into the corresponding physical address and loads it into memory.

2) Page replacement algorithm : It is an algorithm used for virtual memory management. When memory is low, the page replacement algorithm removes certain pages from memory and loads new pages into memory. Common page replacement algorithms include FIFO, LRU, LFU, etc. A module called the "pager" is used in the Linux kernel to select the page replacement algorithm. The page scheduler will select the most appropriate page replacement algorithm based on factors such as system load and memory pressure.
3) Memory fragmentation : refers to the existence of many small free blocks in the memory, but these free blocks cannot be combined into large enough contiguous blocks to satisfy large memory requests. The Linux kernel uses a technology called the "buddy system" to solve the problem of memory fragmentation.
4) Shared memory: It is a mechanism that allows processes to share the same physical memory. In the Linux kernel, shared memory is maintained by the kernel, and shared memory can be created and accessed through the system calls shmget() and shmat().
5) Swap space: It is a virtual memory technology that allows infrequently used memory data to be saved to the hard disk to free up physical memory. The Linux kernel uses a technology called "swap partitioning" to manage swap space.
6) How to allocate memory in the Linux kernel? A technique called the "buddy system" is used in the Linux kernel to allocate memory. The buddy system divides the available memory blocks into different size categories and uses a binary tree structure to manage these memory blocks. When memory needs to be allocated, the buddy system selects the most appropriate size category and allocates it to the process.
7) SLAB allocator : It is a memory management mechanism in the Linux kernel that is used to efficiently allocate and release small objects. The SLAB allocator uses three buffer pools to store free objects, partially occupied objects, and fully occupied objects. This mechanism can improve the efficiency of memory allocation and release.
8) When debugging memory problems in the Linux kernel, we can use some of the tools that come with the Linux kernel to debug memory problems, such as:
memtest86+: A tool for detecting memory errors.
kmemleak: A tool for detecting memory leaks.
slabtop: A tool for viewing the status of SLAB allocators.
vmstat: A tool for monitoring system memory usage.
In addition, you can also use debuggers such as gdb to track the process of memory allocation and release, as well as use print statements in the kernel code for debugging.
9) Memory mapping: It is a technology that maps files to the process address space. In the Linux kernel, the mmap() system call can be used to create memory mapped areas. Doing so allows the program to read and write the file contents directly without copying or using a buffer.
10) Huge page refers to a page whose size exceeds 4KB. In the Linux kernel, HugePages technology can be used to manage large pages. HugePages technology allows users to create a memory pool consisting of huge pages and allocate them to processes. This can improve the efficiency of memory allocation and access.
11) NUMA architecture? NUMA (Non-Uniform Memory Access) architecture is a multi-processor architecture in which each processor has its own local memory, while remote memory needs to be accessed through a network connection. In the Linux kernel, NUMA technology can be used to optimize memory access performance to better adapt to the NUMA architecture.
12) The Linux kernel uses some mechanisms to protect memory security, such as:
Address Space Layout Randomization (ASLR): Randomizes the address space layout to make it difficult for an attacker to guess the location of various parts of the system.
Stack Guard: Use stack guard technology to prevent buffer overflow attacks.
Kernel Address Space Isolation (KASLR): Allocates kernel code and data to different address spaces to improve system security.
13) Memory compression : It is a technology that compresses and saves part of the memory data to the memory when the memory is insufficient. In the Linux kernel, memory compression can be achieved using zswap technology. This avoids frequent page replacement and improves system performance.
14) Memory leak : refers to the situation where some memory resources in the program are not released correctly. If this happens more and more frequently, the system may exhaust all available memory, causing the system to crash or become very slow. In the Linux kernel, you can use tools such as kmemleak to detect and fix memory leaks.
15) DMA (Direct Memory Access) memory is a mechanism for direct access to physical memory , which allows external devices (such as network adapters, hard disk controllers, etc.) to directly read and write system memory. How to manage DMA memory in the Linux kernel? In the Linux kernel, DMA mapping technology can be used to manage DMA memory. DMA mapping technology can map system memory to the DMA address space, allowing external devices to directly access system memory.
16) Page recycling : In the Linux kernel, page recycling is an important mechanism that can help the system effectively manage memory resources. The Linux kernel uses a mechanism called the "page collector" to handle page reclamation. The page collector periodically scans the pages in the system and moves pages that are no longer used to the free list for subsequent memory allocation.
17) Memory locking : It is a mechanism to lock memory pages in physical memory. In the Linux kernel, memory locking can be implemented using the mlock() and mlockall() system calls. Doing so prevents page replacement or swap operations from affecting these memory pages.
18) Memory hot-swapping: refers to dynamically adding or removing memory devices during system operation. In the Linux kernel, ACPI (Advanced Configuration and Power Interface) technology can be used to handle memory hot plugging. ACPI technology can handle the addition and deletion of memory devices by notifying the kernel and automatically updating the memory mapping relationship.
19) How is memory protection handled in the Linux kernel? In the Linux kernel, some mechanisms can be used to protect memory security, such as address space layout randomization (ASLR), stack protection, kernel address space isolation (KASLR), etc. In addition, you can also use SECCOMP (Secure Computing Mode) mode to limit the system call permissions of the process, thereby improving system security.
20) Memory sharing: refers to a mechanism in which multiple processes share the same physical memory. In the Linux kernel, shared memory (Shared Memory) technology can be used to achieve memory sharing. Shared memory is maintained by the kernel and can be created and accessed through the system calls shmget() and shmat().
21) Memory mapping? In the Linux kernel, the mmap() system call can be used to create memory mapped areas. The memory mapped area can map files into the process address space, allowing the program to directly read and write file contents without copying or using a buffer.
22) NUMA architecture? In the Linux kernel, NUMA (Non-Uniform Memory Access) technology can be used to optimize memory access performance to better adapt to the NUMA architecture. NUMA technology can optimize memory access efficiency by adjusting memory allocation strategies and page replacement algorithms.
23) Memory isolation: Memory isolation is a mechanism to isolate the memory resources of different processes or users. In the Linux kernel, memory isolation can be achieved using cgroups (Control Groups) technology. cgroups can limit the memory resources of a process or user within a certain range to avoid resource competition or abuse problems.
24) Memory cache: In the Linux kernel, page cache (Page Cache) technology can be used to handle memory cache. Page cache is a mechanism that caches file contents into memory so that programs can read and write file contents faster. The page cache can optimize system performance by adjusting the cache size and page replacement algorithm.
25) Memory reservation refers to retaining some memory resources in the system and not allowing other processes or users to use them. In the Linux kernel, memory reservation can be achieved using the MAP_LOCKED flag of the mmap() system call. Doing so prevents page replacement or swap operations from affecting these memory pages.
26) Large number of small object allocations: In the Linux kernel, techniques such as SLAB allocator and SLUB allocator can be used to handle large number of small object allocations. The SLAB allocator is a mechanism specifically designed to efficiently allocate small objects, while the SLUB allocator is a simpler and more efficient allocator that is suitable for allocating small objects in most cases.
27) Memory monitoring refers to real-time monitoring of memory usage in the system and providing corresponding statistical information and alarm functions. In the Linux kernel, you can use tools such as vmstat, sar, and top for memory monitoring. In addition, some third-party tools can also be used to implement more advanced memory monitoring functions.
28) Huge page processing: In the Linux kernel, HugePages technology can be used to manage large pages. HugePages technology allows users to create a memory pool consisting of huge pages and allocate them to processes. This can improve the efficiency of memory allocation and access.
☛ Memory management software architecture:

The core work of kernel memory management is memory allocation and recovery management, which is divided into two systems: page management and object management . The page management system is a two-level hierarchy, and the object management system is a three-level hierarchy. The allocation cost and negative impact of operations on the CPU cache and TLB gradually increase from top to bottom.
1. Page management hierarchy: a two-level structure composed of hot and cold caches and partner systems. Responsible for caching, allocating, and recycling memory pages.
2. Object management hierarchy: a three-level structure composed of per-cpu cache, slab cache, and partner system (UME). Responsible for object caching, allocation, and recycling. The object here refers to a memory block smaller than the size of a page.

In addition to memory allocation, memory release also operates according to this hierarchy. If an object is released, it is first released to the per-cpu cache, then to the slab cache, and finally to the partner system.
2.3. OOM parameters
1、panic_on_oom
When the kernel encounters OOM, it has two options:
(1) Generate kernel panic (direct crash).
(2) Face it proactively, select one or several most "suitable" processes, start the OOM killer, kill those selected processes to release memory mitigation, and allow the system to continue to live and wait for further processing.
The panic_on_oom parameter controls how the system responds when OOM is encountered. When this parameter is equal to 0, it means choosing to face life positively and starting the OOM killer. When this parameter is equal to 2, it means that no matter what the situation is, kernel panic will be forced. When panic_on_oom is equal to other values, it means that specific situations need to be distinguished. For some situations, panic can be used, and in some cases the OOM killer can be activated. k
For UMA, oom_constraint is always CONSTRAINT_NONE, which means that OOM occurs in the system without any constraints. In the case of NUMA, there may be additional constraints that cause the system to encounter an OOM state. In fact, there is still sufficient memory in the system. These constraints include:
(1) CONSTRAINT_CPUSET : cpusets is a mechanism in the kernel through which a set of cpu and memory node resources can be allocated to a specific set of processes. At this time, if OOM occurs, it only means that the node where the process can allocate memory is in trouble. There are many memory nodes in the entire system, and other nodes may have sufficient memory resources.
(2) CONSTRAINT_MEMORY_POLICY : memory policy is a policy module in the NUMA system that controls how to allocate resources to each memory node. User space programs (NUMA-aware programs) can use the memory policy API to formulate policies for the entire system, for a specific process, and for a specific VMA of a specific process. OOM may also be caused by the addition of memory policy constraints. In this case, if it causes the entire system to panic, the policy needs to be adjusted in time.
(3) CONSTRAINT_MEMCG : MEMCG is the memory control group. The memory subsystem in Cgroup is the controller that controls the allocation of system memory resources. Generally speaking, it limits the memory usage of a group of processes within a range. When the memory usage of this group exceeds the upper limit, OOM will occur.
Among them, the sysctl_panic_on_oom variable in the kernel corresponds to /proc/sys/vm/panic_on_oom, and the default value is 0.
2、oom_kill_allocating_task
When the system chooses to start the OOM killer and tries to kill certain processes, it will encounter the following problem: Which process to kill, which one is the "appropriate" process? The system has the following options:
(1) Kill whoever triggers OOM
(2) Kill whoever is the most "bad"
The oom_kill_allocating_task parameter controls this selection path. When this parameter is equal to 0, select (2), otherwise select (1).
Of course, we cannot just kill it. We still need to consider whether it is a user space process (kernel threads cannot be killed), whether it is an unkillable task (for example, the init process cannot be killed), and whether the user space prevents the task from being killed by setting parameters (oom_score_adj). After excluding these security restrictions, then call oom_kill_process to kill the current process, the corresponding file /proc/sys/vm/oom_kill_allocating_task, the default value is 0.
3、oom_dump_tasks
When an OOM situation occurs in the system's memory, whether it is panic or starting the OOM killer, as a system administrator, you want to keep clues to find the root cause of the OOM, for example: dump some information about the memory of all user space processes in the system , including: process identification information, total virtual memory information used by the process, and the actual physical memory used by the process (we also call it RSS, Resident Set Size), not only the physical memory used by the own program, but also the shared library occupied memory), the page table information of the process, etc. Only after obtaining this information can we help us understand the truth behind the phenomenon (OOM) so that we can deal with it thoroughly. The mapping file corresponding to this parameter is /proc/sys/vm/oom_dump_tasks, and the default value is 1.
When set to 0, the memory information of the various processes described in the previous paragraph will not be printed. In a large system with thousands of processes, printing the memory information of each task one by one may cause performance problems (you must know that it is already OOM at that time). When set to a non-zero value, dump_tasks will be called to print the memory status of all tasks in the system in the following three situations:
(1) Kernel panic due to OOM
(2) No suitable "bad" process found
(3) When finding a suitable one and killing it
4、oom_adj、oom_score_adj和oom_score
These parameters are related to specific processes, so they are located in the /proc/xxx/ directory (xxx is the process ID). Suppose we choose to kill the process when an OOM situation occurs, then a natural question arises: Which one should be killed? The kernel algorithm is very simple, that is, scoring (oom_score, note that this parameter is read only), and it is OK to find the one with the highest score. So how do you calculate the score?
unsigned long oom_badness(struct task_struct *p, struct mem_cgroup *memcg,
const nodemask_t *nodemask, unsigned long totalpages)
{

    ......
adj= (long)p->signal->oom_score_adj;
if (adj == 0OM_SCORE_ADJ_MIN){

    -------------------------------------(1)
  task_unlock(p);
  retur 0;---------------------------------------------------------(2)
}
points = get_mm_rss(p->mm) + get_mm_counter(p->mm, MM_SWAPENTS)+ atomic_long_read(&p->mm->nr_ptes) + mm_nr_pmds(p->mm);-------------------------------------(3)
task_unlock(p);
if (has_capability_noaudit(p, CAP_SYS_ADMIN))----------------------(4)
   points -= (points * 3)/ 100;
   adj *= totalpages /1000;-----------------------------------------(5)
   points += adj;
   return points > 0 ? points:1;
}
(1) Scoring a certain task (oom_score) mainly consists of two parts. One part is the system score , which is mainly based on the memory usage of the task. The other part is the user score , which is oom_score_adj. The actual score of the task needs to comprehensively consider the two aspects of the score. If the user sets the oom_score_adj of the task to OOM_SCORE_ADJ_MIN (-1000), then the OOM killer is actually prohibited from killing the process.
(2) Returning 0 in step 2 tells the OOM killer that the process is a "good process" and should not be killed. When actually calculating the score, the minimum score is 1 point.
(3) The system score is based on the physical memory consumption, which mainly includes three parts, the RSS part, the memory occupied by the swap file or swap device, and the memory occupied by the page table.
(4) The root process has 3% memory usage privileges, so those memory usage should be subtracted here.
(5) Users can adjust oom_score. How to do it? The value range of oom_score_adj is **-1000~1000**. 0 means that the user does not adjust oom_score. A negative value means that a discount should be subtracted from the actual score value. A positive value means that the task should be punished, that is, the process will be increased. oom_score. In actual operation, it needs to be calculated based on the memory that can be allocated during this memory allocation (if there is no memory allocation constraint, then it is all the available memory in the system. If the system supports cpuset, then the allocable memory here is the actual amount of the cpuset. value). The oom_badness function has an incoming parameter total pages, this parameter is the upper limit of allocable memory at that time. The actual score value (points) should be adjusted according to oom_score_adj. For example: if oom_score_adj is set to -500, it means that the actual score will be discounted by 50 (the base is totalpages), which means that the actual memory used by the task will be reduced by the allocable memory. half of the memory limit.
2.4. Memory mapping space division
The kernel divides the memory mapped address space into multiple parts. Each divided space has its own starting and ending addresses, allocation interfaces and usage scenarios. The following figure is a common 32-bit address space division structure:

the area between the DMA zone and the highmem zone is the normal zone, which is mainly used for dynamic memory allocation of the kernel. High-end memory dynamically allocates address space: The memory allocated by high-end memory is memory with continuous virtual addresses and discontinuous physical addresses. It is generally used for modules and drivers dynamically loaded by the kernel, because the kernel may have been running for a long time and the memory page fragmentation is serious. If you want It will be more difficult to apply for memory pages with large continuous addresses, which can easily lead to allocation failure.
The difference between kmap and vmap is that vmap can map a group of pages, that is, the pages are not consecutive, but the virtual addresses are continuous, while kmap can only map one page to the virtual address space. kmap is mainly used in modules such as fs and net that have higher performance requirements for high-end memory access. Fixed mapping address space: The problem with persistent mapping is that it may sleep and is not available in scenarios that cannot block, such as interrupt contexts and spin lock critical sections. In order to solve this problem, the kernel has divided into fixed mappings, and its interfaces will not sleep. Fixed mapping space is mapped through the kmap_atomic interface. The usage scenarios of kmap_atomic are similar to kmap, and are mainly used in mm, fs, net and other modules that have high performance requirements for high-end memory access and cannot sleep.
Different CPU architectures have different divisions of address space, but in order to ensure that CPU architecture differences are not visible to external modules, the semantics of the memory address space allocation interface are consistent. Because 64-bit CPUs generally do not require high-end memory (of course they can support it), the address space division is quite different from that of 32-bit CPUs. The following figure is the kernel address space division diagram of a MIPS64 CPU:

2.5. Others
The inspection found: the top three processes occupying memory

. For Java programs, search for java.lang.OutOfMemoryError. After confirming the cause of the error, try to adjust the JVM parameters, such as -XX:MaxDirectMemorySize=numG;
For problems caused by cgroup, the log will see a description similar to: as a result of limit of; when the global memory of the instance is insufficient to trigger the OOM killer, the log will see a prompt similar to as a result of limit of host; if the The cpuset.mems parameter specifies that the cgroup can only use the memory of a specific memory node, which may cause an OOM Killer to occur even if the instance has sufficient free memory. Among them, the function of cpuset is to specify the bound cpu and corresponding memory node for the execution of the process. In the cpuset.mems file, fill in the memory node number or the memory node range to specify the list of memory nodes that are allowed to be accessed; Note: You need to set both cpuset.cpus and cpuset.mems files at the location /sys/fs/cgroup/cpuset/. Example of the command to adjust the memory limit of a cgroup: echo value > /sys/fs/cgroup/memory/test/memory.limit_in_bytes, where value is the memory limit you set for the cgroup.
In addition, during the memory allocation process of the operating system, if the memory of the partner system is insufficient, the system will release the memory through the OOM Killer and provide the memory to the partner system.
In addition, there is a concept to mention here: Non -Uniform Memory Access ( NUMA ): refers to a multi-processor system in which the memory is divided into multiple memory nodes . The time it takes to access a memory node depends on the processor and memory node. distance. Each processor has a local memory node, and a processor can access the local memory node faster than it can access other memory nodes. NUMA is the mainstream architecture for mid- to high-end servers. In practical applications, a hybrid architecture is often used. SMP (Symmetric Multi-Processor, SMP, also known as Uniform Memory Access, UMA) is used inside a NUMA node. In this architecture, the time it takes for all processors to access the memory is Similarly, "Processor No. 0 serves as the boot processor and is responsible for initializing the kernel, and other processors wait for the completion of kernel initialization.) Architecture.
3. Emergency measures
Pressing the power button to force a shutdown after Linux crashes can easily further damage the system or hardware, leading to secondary failures after restarting. In fact, in addition to this decisive measure, you can also try the following rescue measures:
1. One way is to enter the terminal interface to operate, press ctrl+alt+f1 (or f2~f6) to enter the tty, use the top command to check the process, and kill the process that has been occupying a lot of resources. If it is in the graphical interface If it crashes, don't rely on any graphical interface tools anymore, switch to the non-graphical interface and try Alt+F7; 2.
If you can't enter the tty or it doesn't work after entering the tty, you can use the ultimate killer- reisub method . This method can be used in When the system crashes , you can safely restart the computer without losing data. The specific operation is: hold down alt+SysRq , then press the reisub keys in sequence, and then press the b key to restart.
In fact: Sys Rq is something called a system request . Holding down Alt-Print/PrtSc is equivalent to holding down the Sys Rq key. Everything entered at this time will be directly processed by the Linux kernel , which can perform many low-level operations. operate. At this time, each letter in reisub is an independent operation. They represent respectively:
nRaw: Take keyboard control back from X Server.
tErminate: Send SIGTERM signal to all processes and let them deal with the aftermath.
kIll: Send SIGKILL to all processes. signal, forcing them to close immediately
Sync: synchronize all data to the disk
Unmount: mount all partitions in read-only mode
reBoot: restart
In addition, please note that do not press these keys in rapid succession, they take time to execute, so The next one can be executed every 10 seconds or so. Especially after the s key, the data synchronization is slow, so it can be stopped for 20 seconds or longer.

After logging in, check whether there is a memory leak in the instance. Key check: slab_unreclaimable memory usage, execute: cat /proc/meminfo | grep "SUnreclaim"; slab_unreclaimable memory is non-reclaimable memory of the system. When the proportion of the total memory occupied is too high, it will affect the available memory and system performance. When it occupies more than 10% of the total memory, it indicates that the system may have a slab memory leak. Check systemd memory usage: cat /proc/1/status | grep "RssAnon"; When an OOM Killer occurs in the kernel, the system's process No. 1 will be automatically skipped. When checking systemd memory usage at this time, it generally does not exceed 200 MB. If an exception occurs, you can try to update the version of the systemd tool yourself. Check the performance of Transparent Huge Pages (THP). Enabling THP will cause memory bloating, which will lead to the appearance of OOM Killer. If abnormal, THP can be tuned. Experience shows that slab memory is a kernel component (or driver) that applies for memory from the partner system by calling the kmalloc class interface. If the kernel component (or driver) does not release the memory correctly, that is, once a slab memory leak occurs in the instance, the slab memory leak will cause the instance to The available memory for the business running on the computer becomes less and fragmented, which will also cause the system OOM Killer and system performance jitter. If the memory cannot be recovered by killing the process, it can only be solved by restarting the instance.
#查看内存最多的slab内存信息
slabtop -s -a   #输出如下,查看并记录OBJ/SLAB列数值较高的slab内存对应的名称
Active / Total Objects (% used)    : 4887183 / 5091415 (96.0%)
 Active / Total Slabs (% used)      : 162257 / 162257 (100.0%)
 Active / Total Caches (% used)     : 76 / 98 (77.6%)
 Active / Total Size (% used)       : 847535.38K / 872548.29K (97.1%)
 Minimum / Average / Maximum Object : 0.01K / 0.17K / 8.00K

  OBJS ACTIVE  USE OBJ SIZE  SLABS OBJ/SLAB CACHE SIZE NAME
3190707 3011949  94%    0.10K  81813	   39    327252K buffer_head
1234065 1233944  99%    0.19K  58765	   21    235060K dentry

#确认slab内存是否为不可回收;命令中的<slab NAME>变量需要手动修改为上一步中获取到的OBJ/SLAB列数值较高的slab内存对应的名称,例如,查看名称为kmalloc-8的slab内存是否为不可回收,cat /sys/kernel/slab/<slab NAME>/reclaim_account
cat /sys/kernel/slab/kmalloc-8/reclaim_account #显示为0,表示slab内存不可回收;查询结果为1时,表示slab内存可回收
#crash工具进行静态分析,也可以使用perf工具进行动态分析,排查造成slab内存泄漏的原因

#crash工具静态分析
yum install crash kernel-debuginfo -y
sudo crash
>kmem -S kmalloc-8  #输出类似如下,主要关注空闲内存较少(FREE列),已分配的内存较多(ALLOCATED列)

 SLAB              MEMORY            NODE  TOTAL  ALLOCATED  FREE
  ffffea004c94e780  ffff88132539e000     0     42         29    13
  ffffea004cbef900  ffff88132fbe4000     0     42         40     2
  ffffea000a0e6280  ffff88028398a000     0     42         40     2
>rd ffffea004c94e780 512 -S

#perf分析
yum install perf -y
#动态获取kmalloc-8中没有释放的内存,动态获取数据的时间间隔为200秒
perf record -a -e kmem:kmalloc --filter 'bytes_alloc == 8' -e kmem:kfree --filter ' ptr != 0' sleep 200
perf script > testperf.txt  #将动态获取的数据打印至临时文件中,之后需要手动排查没有空闲内存(free)的内存信息,然后在Linux内核源代码中手动查询产生slab内存泄漏的函数。

#查询透明页开启
less /sys/kernel/mm/transparent_hugepage/enabled
[always] madvise never    #开启透明大页THP的功能,always 系统全局开启透明大页THP功能;never:系统全局关闭透明大页THP功能;madvise:仅在通过madvise()系统调用,并且设置了MADV_HUGEPAGE标记的内存区域中开启透明大页THP功能。

#透明大页THP碎片整理;发生缺页异常(Page Fault)时,该功能可控制内存分别进行直接回收(Direct Reclaim)、后台回收(Background Reclaim)、直接整理(Direct Compaction)、后台整理(Background Compaction)的行为。开启或关闭该功能如下:
cat /sys/kernel/mm/transparent_hugepage/defrag #输出结果同上;always 系统分配不出透明大页时,暂停内存分配行为,总是等待系统进行内存的直接回收和内存的直接整理。内存回收和整理结束后,如果存在足够的连续空闲内存,则继续分配透明大页。defer:当系统分配不出透明大页时,转为分配普通的4KB页。同时唤醒kswapd内核守护进程以进行内存的后台回收,唤醒kcompactd内核守护进程以进行内存的后台整理。一段时间后,如果存在足够的连续空闲内存,khugepaged内核守护进程将此前分配的4KB页合并为2MB的透明大页。madvise:仅在通过madvise()系统调用,并且设置了MADV_HUGEPAGE标记的内存区域中,内存分配行为等同于always。其余部分的内存分配行为保持为:发生缺页异常时,转为分配普通的4 KB页。defer+madvise(试验性开关):仅在通过madvise()系统调用,并且设置了MADV_HUGEPAGE标记的内存区域中,内存分配行为等同于always。其余部分的内存分配行为保持为defer

#khugepaged碎片整理功能
cat /sys/kernel/mm/transparent_hugepage/khugepaged/defrag #0表关闭khugepaged碎片整理功能。1表khugepaged内核守护进程会在系统空闲时周期性唤醒,尝试将连续的4 KB页合并成2 MB的透明大页;该操作会在内存路径中加锁,并且khugepaged内核守护进程可能会在错误的时间启动扫描和转换大页,因此存在影响应用性能的可能性。

#大页分配重试间隔:当透明大页THP分配失败时,khugepaged内核守护进程进行下一次大页分配前需要等待的时间。避免短时间内连续发生大页分配失败。默认值为60000,单位为毫秒,即默认等待60秒。
cat /sys/kernel/mm/transparent_hugepage/khugepaged/alloc_sleep_millisecs

#khugepaged内核守护进程每次唤醒的时间间隔。默认值为10000,单位为毫秒,即默认每10秒唤醒一次。
cat /sys/kernel/mm/transparent_hugepage/khugepaged/scan_sleep_millisecs

#扫描页数:khugepaged内核守护进程每次唤醒后扫描的页数。默认值为4096个页。配置文件路径如下。
cat /sys/kernel/mm/transparent_hugepage/khugepaged/pages_to_scan
Recommended transparent page configuration: Transparent huge page THP can increase the probability of TLB (Translation Lookaside Buffer) hit, reduce the overhead of memory access to page table entries (PTE), and improve the system performance. Transparent Huge Page THP attempts to further relieve operation and maintenance pressure, allowing users to enjoy performance improvements without being aware of it. However, the resources of transparent large page THP are limited. When the system reaches the bottleneck of transparent large page THP allocation, a series of mechanisms need to be used to ensure the normal operation of the system. Under the premise that system operation and maintenance personnel do not know enough about transparent large page THP, using the system's default configuration is risky for many applications. The main risks may be:
1. If the defragmentation switch of the transparent large page THP is set to always, when the memory is tight, it will be the same as the ordinary 4 KB page. Direct memory recycling or direct memory defragmentation will occur. Both operations are synchronous waiting operations, which will cause System performance degrades.
2. If the khugepaged defragmentation switch is set to 1, the memory path will be locked when the khugepaged kernel daemon performs a memory merge operation. If khugepaged defragmentation is triggered at the wrong time, it can have a performance impact on memory-sensitive applications.
3. If you keep transparent large page THP turned on and turn off the above two defragmentation switches at the same time, the memory allocation process may consume the free page resources faster than the 4 KB page, and then the system will start to enter memory recycling and memory defragmentation. process, on the contrary, system performance will degrade earlier.
#查看透明大页THP的使用情况,如果系统返回非零值,则说明系统中使用了一定数量的透明大页THP。
cat /proc/meminfo | grep AnonHugePages

#查看某个进程使用的透明大页THP。
cat /proc/[$PID]/smaps | grep AnonHugePages

echo 'defer+madvise' > /sys/kernel/mm/transparent_hugepage/defrag  #开启,使内核的内存后台回收(kswapd内核守护进程)、内存的后台整理(kcompactd内核守护进程)与khugepaged内核守护进程尽可能协同工作,在内存整理和性能平稳之间找到平衡点。

#如果发现系统中的khugepaged内核守护进程达到或接近100%的CPU使用率时,可以考虑增加khugepaged内核守护进程唤醒的间隔时间,比如修改为30秒,示例如下:
echo 30000 > /sys/kernel/mm/transparent_hugepage/khugepaged/scan_sleep_millisecs
#或者直接关闭khugepaged内核守护进程
echo 0 > /sys/kernel/mm/transparent_hugepage/khugepaged/defrag

#对于数据库应用有大量访问请求的场景、大量延迟敏感型应用场景或大量短生命周期的内存分配(Short-lived Allocation)场景,如果系统的稳定性比性能更重要,建议关闭透明大页THP功能
echo 'never' > /sys/kernel/mm/transparent_hugepage/enabled  #仅在本次系统运行期间有效,系统重启后透明大页THP功能仍会开启

#永久关闭:在内核启动参数中添加关闭透明大页THP功能的参数
grubby --args="transparent_hugepage=never" --update-kernel="/boot/vmlinuz-$(uname -r)"
#完成后
reboot
If the OOM Killer is caused by insufficient memory of the memory node (Node), you need to reconfigure the value of the cpuset.mems interface so that the cgroup can reasonably use the memory of the memory node. Query the number of Node nodes: cat /proc/buddyinfo; Configure cpuset.mems: echo value > /sys/fs/cgroup/cpuset/进程名/cpuset.mems; Among them, value is the corresponding memory node number. For example, there are three Nodes in the system, namely Node 0, Node 1, and Node 2. You need to let the cgroup use the memory of both nodes Node 0 and Node 2. Then the value is 0,2.
Reason 3: If it is suspected that the OOM Killer is caused by memory fragmentation, memory defragmentation can be performed during the idle period of the business, and the memory defragmentation function can be enabled and executed: . It is recommended to perform memory defragmentation regularly echo 1 > /proc/sys/vm/compact_memory. Check the current number of memory banks: dmidecode | grep -A16 "Memory Device$";sync first to prevent data loss. After execution, all unwritten system buffers will be written to the disk, including modified i-nodes, delayed block I/O and read-write mapping files. . Then the memory can be cleared: echo 1 > /proc/sys/vm/drop_caches; cache release: echo 1 > /proc/sys/vm/drop_caches releases pagecache; echo 2 > /proc/sys/vm/drop_caches releases dentries and inodes; echo 3 > /proc/sys/vm/drop_caches releases all previous caches; in memory: shared - application shared memory
buffers - cache, mainly used for directories, inode values, etc. (You can see this value in the ls large directory increase); cached - cache, used for open files; used=buffers+cached. -buffers/cache - the memory size used by the application, used minus the cache value; +buffers/cache - the memory size available for the application, free plus the cache value;
4. Appendix:
1. It is suspected that the machine is scanning a large number of external tcp external visits: there are a large number of syn_sent requests
#抓SYN, ACK:
#TCP标记值:tcp-fin, tcp-syn, tcp-rst, tcp-push, tcp-push, tcp-ack, tcp-urg
#-s 0是抓取完整数据包,否则默认只抓68字节;-c参数指定抓多少个包
tcpdump -i eth1 'tcp[tcpflags] & tcp-syn != 0 and tcp[tcpflags] & tcp-ack != 0'
#计算抓10000个SYN包花费多少时间,可以判断访问量大概是多少
time tcpdump -nn -i eth0 'tcp[tcpflags] = tcp-syn' -c 10000 > /dev/null
2. System fault auxiliary tools
Memtest86: used to detect whether there are problems with system memory. You can use a Live CD or USB to launch Memtest86 and run tests.
Systemtap: used to track the execution process of the system. You can use Systemtap to find and fix problems that may be causing your system to freeze.
GDB (GNU Debugger): used to debug programs in the system. You can use GDB to analyze the stack information when the system crashes and find out the code that caused the failure.
Jprofiler: Analyze Dump files