Article Directory
Using the "Prometheus+Grafana" open source monitoring system, install and deploy the K8S cluster monitoring platform.
And use the Altermanager alarm plug-in, in conjunction with the use of enterprise WeChat, to realize the system cluster monitoring and alarm mechanism.
1. Experimental node planning table
| host name | IP address | Install components |
|---|---|---|
| m1 | 192.168.200.61 | Prometheus+Grafana+Alertmanager+node_exporter |
| m2 | 192.168.200.62 | node_exporter |
| m3 | 192.168.200.63 | node_exporter |
| n1 | 192.168.200.64 | node_exporter |
| n2 | 192.168.200.65 | node_exporter |
| n3 | 192.168.200.66 | node_exporter |
2. Install Prometheus
在master01节点上执行操作。
- Install Prometheus
# 下载
wget https://github.com/prometheus/prometheus/releases/download/v2.34.0/prometheus-2.34.0.linux-amd64.tar.gz

# 解压
tar -zxvf prometheus-2.34.0.linux-amd64.tar.gz -C /usr/local/

# 更名
cd /usr/local/  &&  mv prometheus-2.34.0.linux-amd64 prometheus  &&  cd prometheus
- Create a prometheus.service configuration file
cat > /usr/lib/systemd/system/prometheus.service << EOF
[Unit]
Description=prometheus
After=network.target
[Service]
Type=simple
User=root
ExecStart=/usr/local/prometheus/prometheus --config.file=/usr/local/prometheus/prometheus.yml --storage.tsdb.path=/data/prometheus --storage.tsdb.retention=15d --log.level=info
Restart=on-failure
[Install]
WantedBy=multi-user.target
EOF
- Start the prometheus service
systemctl daemon-reload && systemctl start prometheus && systemctl enable prometheus && systemctl status prometheus
- View prometheus service process
netstat -lntp | grep prometheus
3. Install node_exporter
其余节点安装操作相同。
- Install node_exporter
# 下载
wget https://github.com/prometheus/node_exporter/releases/download/v1.3.1/node_exporter-1.3.1.linux-amd64.tar.gz

# 解压
tar -zxvf node_exporter-1.3.1.linux-amd64.tar.gz -C /usr/local/

# 更名
cd /usr/local && mv node_exporter-1.3.1.linux-amd64 node_exporter && cd node_exporter
- Start node_exproter
cat > /usr/lib/systemd/system/node_exporter.service << EOF
[Unit]
Description=node_exporter
Documentation=https://prometheus.io/
After=network.target

[Service]
Type=simple
User=root
ExecStart=/usr/local/node_exporter/node_exporter
Restart=on-failure

[Install]
WantedBy=multi-user.target
EOF
- Start the node_exproter service
systemctl daemon-reload && systemctl start node_exporter && systemctl enable node_exporter && systemctl status node_exporter
- View node_exproter service process
ps -ef | grep node_exporter
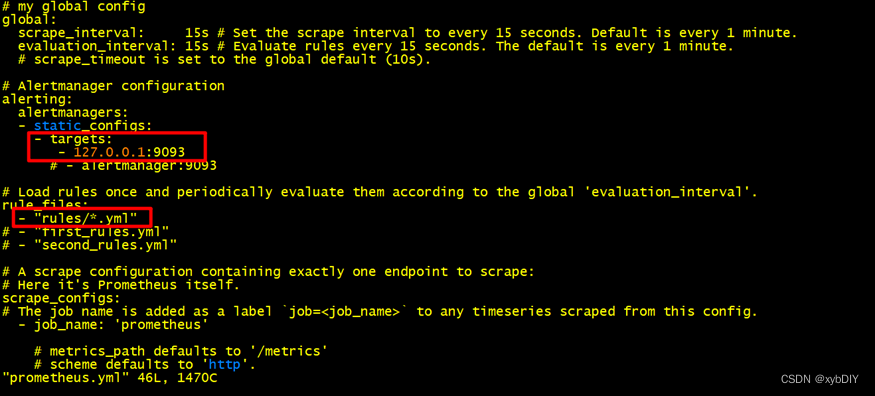
4. Configure the prometheus.yml file
- Modify the prometheus.yml configuration file
[root@m1 prometheus]# cat prometheus.yml
# my global config
global:
  scrape_interval:     15s # Set the scrape interval to every 15 seconds. Default is every 1 minute.
  evaluation_interval: 15s # Evaluate rules every 15 seconds. The default is every 1 minute.
  # scrape_timeout is set to the global default (10s).

# Alertmanager configuration
alerting:
  alertmanagers:
  - static_configs:
    - targets:
       - 127.0.0.1:9093
      # - alertmanager:9093

# Load rules once and periodically evaluate them according to the global 'evaluation_interval'.
rule_files:
  - "rules/*.yml"
# - "first_rules.yml"
# - "second_rules.yml"

# A scrape configuration containing exactly one endpoint to scrape:
# Here it's Prometheus itself.
scrape_configs:
# The job name is added as a label `job=<job_name>` to any timeseries scraped from this config.
  - job_name: 'prometheus'

    # metrics_path defaults to '/metrics'
    # scheme defaults to 'http'.

    static_configs:
    - targets: ['localhost:9090']  # 如果对本机node_exporter监控,加入,'localhost:9100'

  - job_name: 'K8S-Masters'
  #重写了全局抓取间隔时间,由15秒重写成5秒。
    scrape_interval: 5s
    static_configs:
    - targets: ['192.168.200.61:9100']
    - targets: ['192.168.200.62:9100']
    - targets: ['192.168.200.63:9100']

  - job_name: 'K8S-Nodes'
    scrape_interval: 5s
    static_configs:
    - targets: ['192.168.200.64:9100']
    - targets: ['192.168.200.65:9100']
    - targets: ['192.168.200.66:9100']
- Verify that the prometheus.yml configuration is valid
./promtool check config prometheus.yml
- Restart the prometheus service
systemctl daemon-reload && systemctl restart prometheus && systemctl status prometheus
- Restart the node_exporter service
systemctl daemon-reload && systemctl restart node_exporter && systemctl status node_exporter
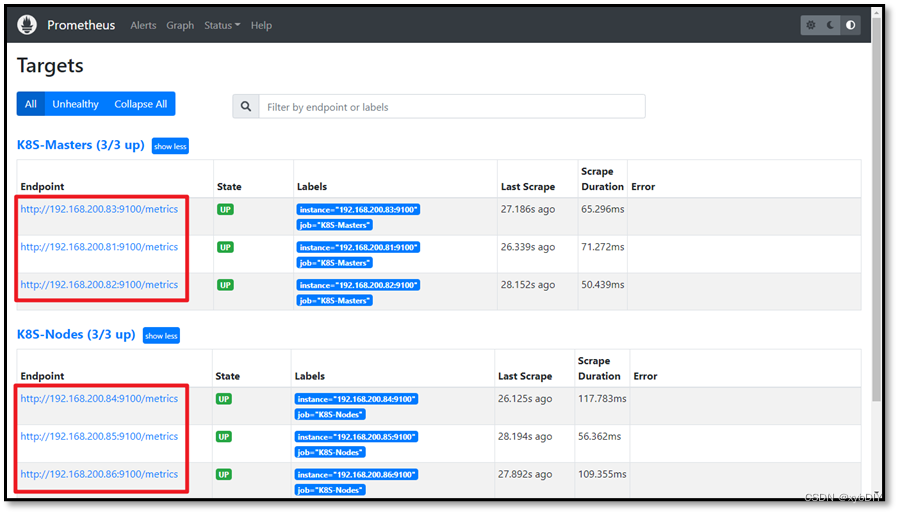
- Visit the Prometheus website
http://192.168.200.61:9090/targets
5. Install Grafana
在master01节点上执行操作。
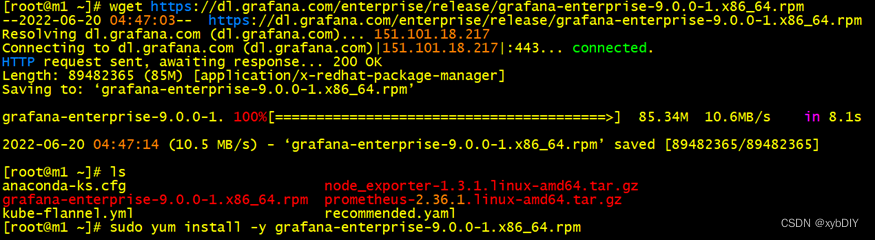
- Download and install Grafana
Download link: Download Grafana | Grafana Labs
# 下载
wget https://dl.grafana.com/enterprise/release/grafana-enterprise-8.4.5-1.x86_64.rpm

# 安装
yum install -y grafana-enterprise-8.4.5-1.x86_64.rpm
- Start the grafana service
systemctl start grafana-server.service && systemctl enable grafana-server.service && systemctl status grafana-server.service
- View the grafana process
netstat -lntp | grep grafana-serve
- Visit the Grafana webpage, that is, visit http://192.168.200.61:3000
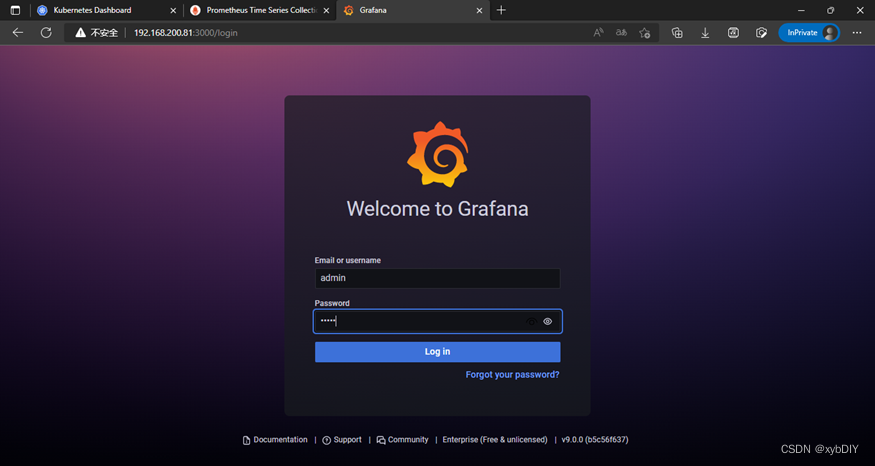
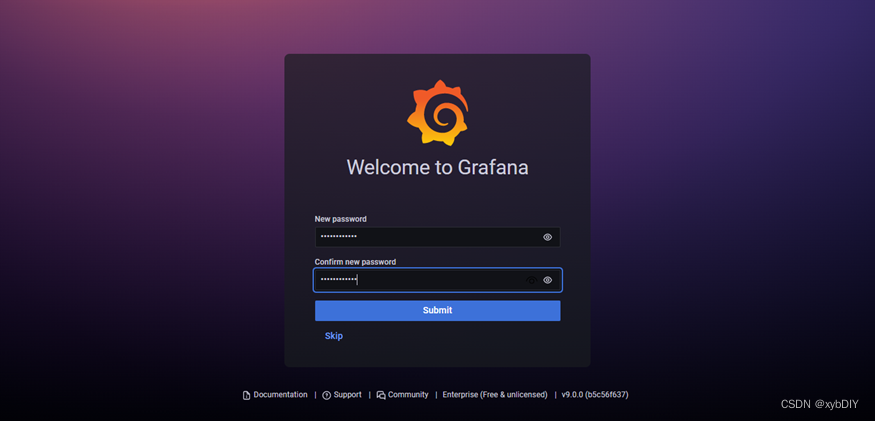
- change Password
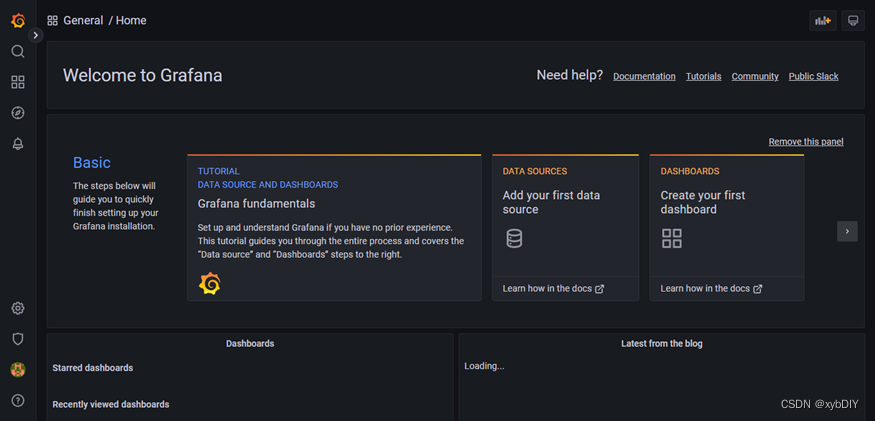
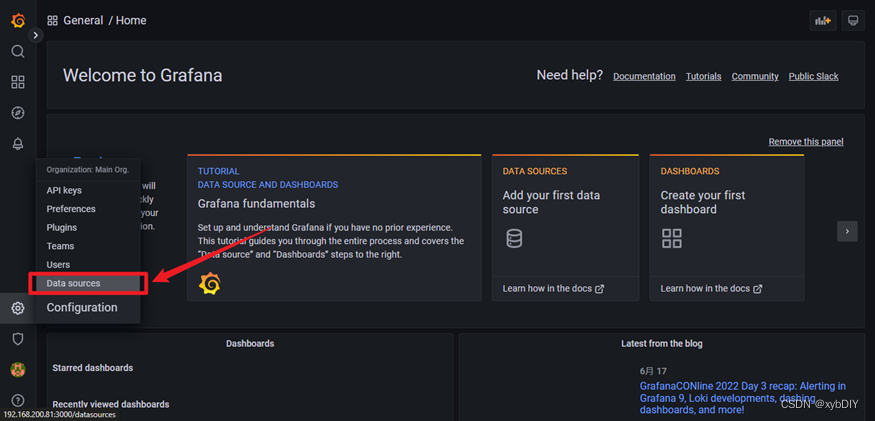
- Login to access the Grafana webpage
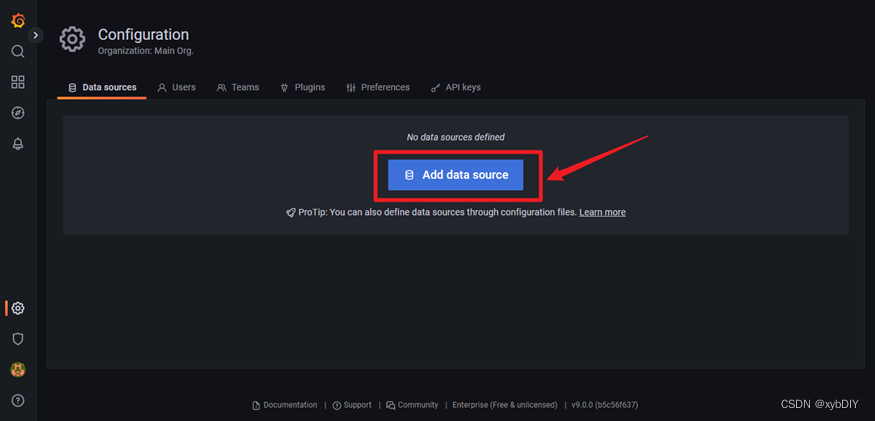
- Add data sources
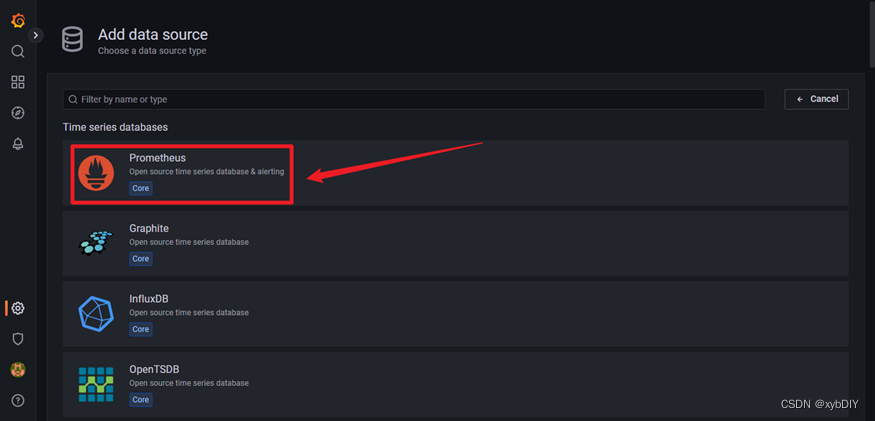
- Select "Prometheus"
- add URL
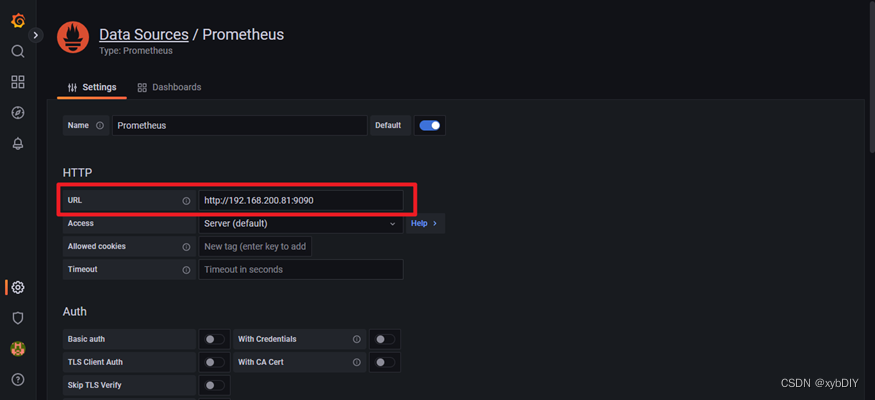
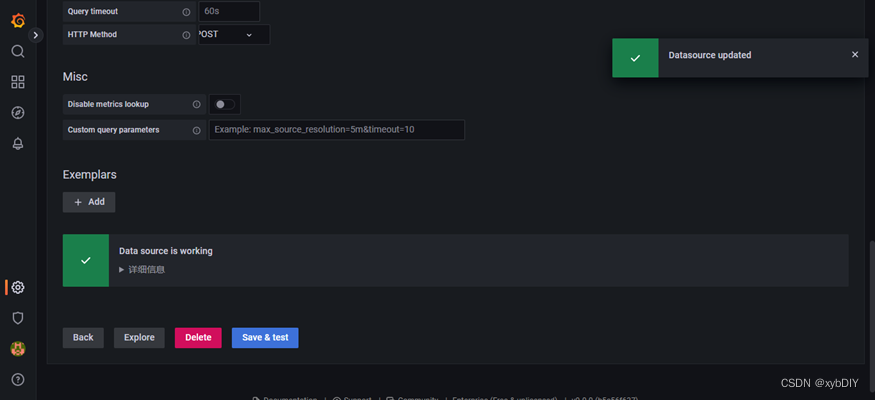
- Save the test, click "Save&Test" to prompt green success.
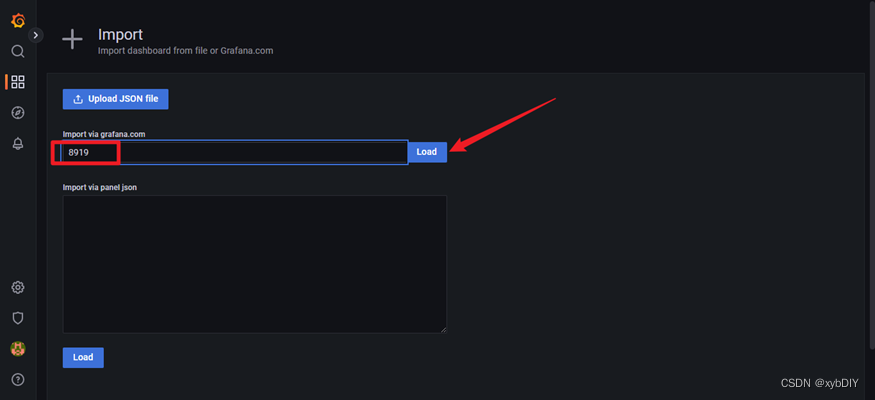
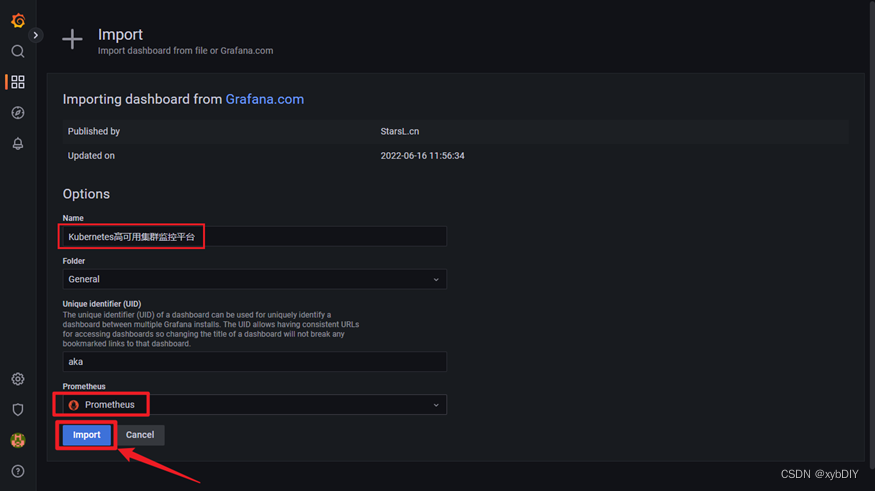
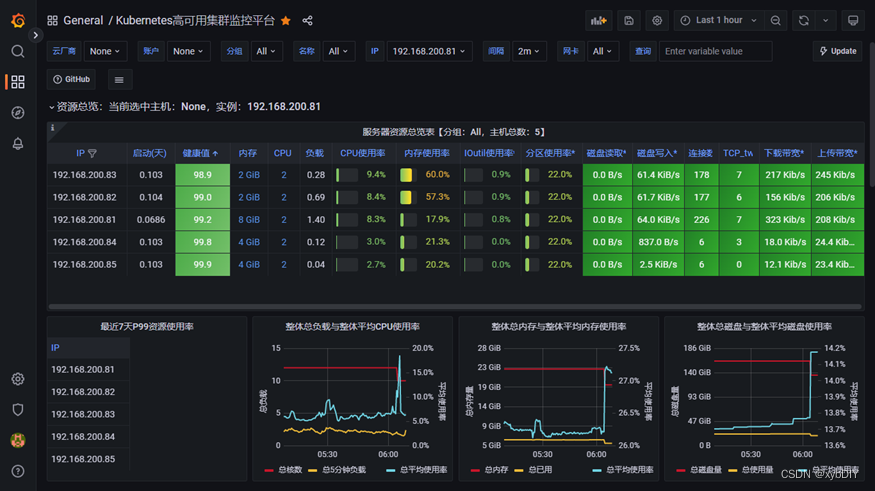
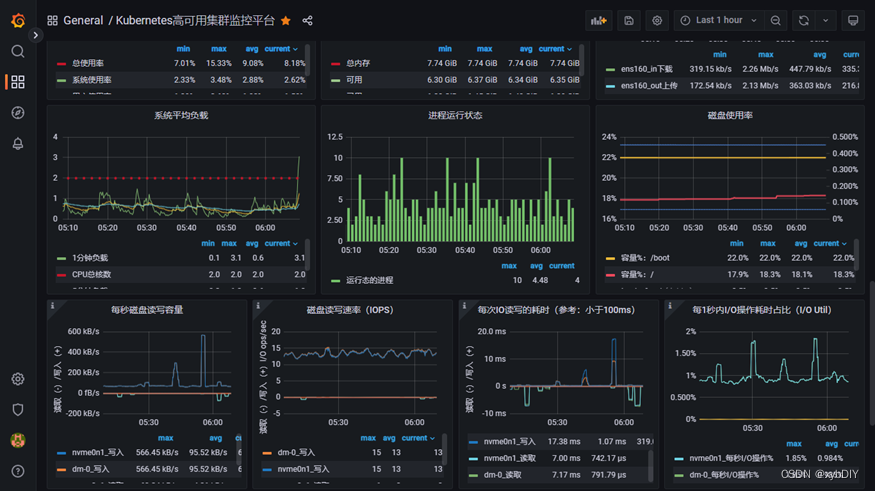
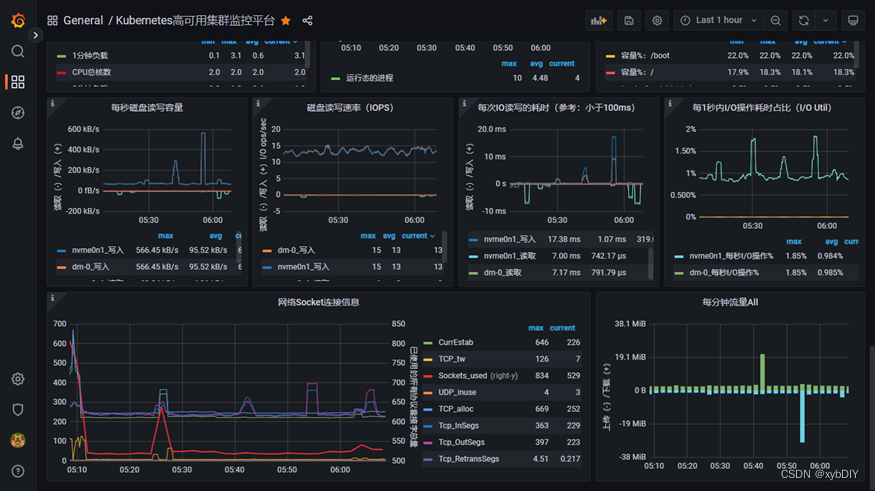
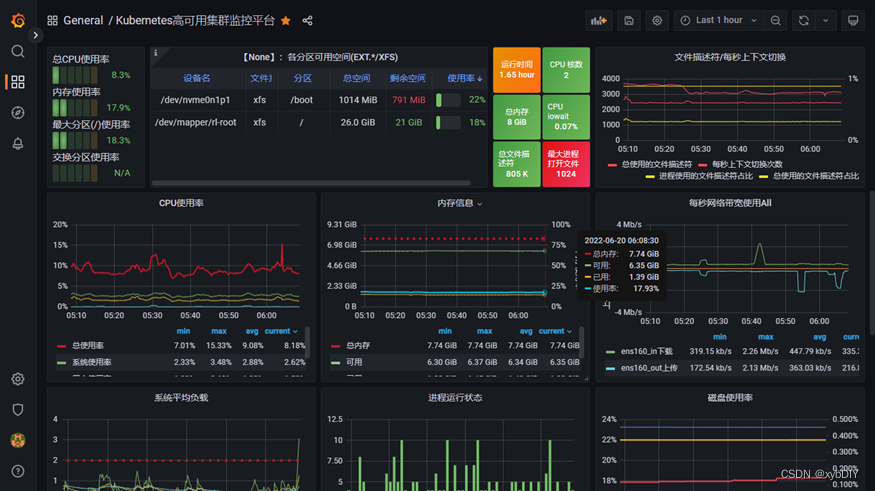
- Configure the grafana-node_exporter dashboard

6. Install Altermanager to monitor alarms
download link
- Install Altermanager
# 下载
wget https://github.com/prometheus/alertmanager/releases/download/v0.24.0/alertmanager-0.24.0.linux-amd64.tar.gz

# 解压
tar xvf alertmanager-0.24.0.linux-amd64.tar.gz -C  /usr/local/

# 更名
cd /usr/local/ && mv alertmanager-0.24.0.linux-amd64  alertmanager && cd alertmanager/
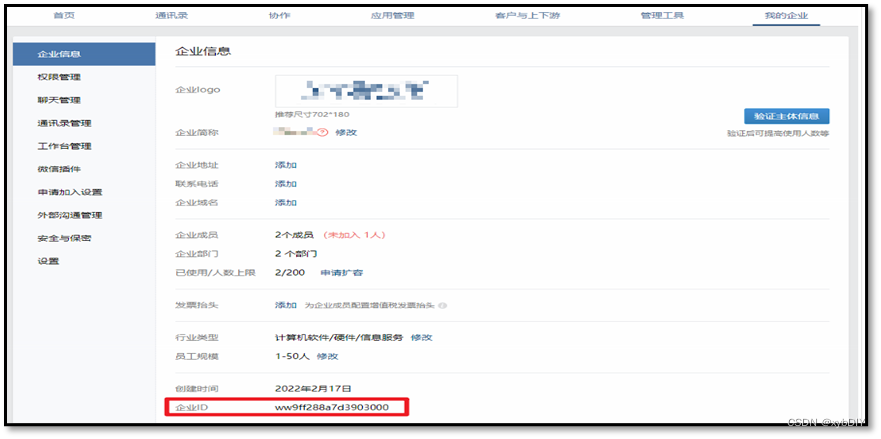
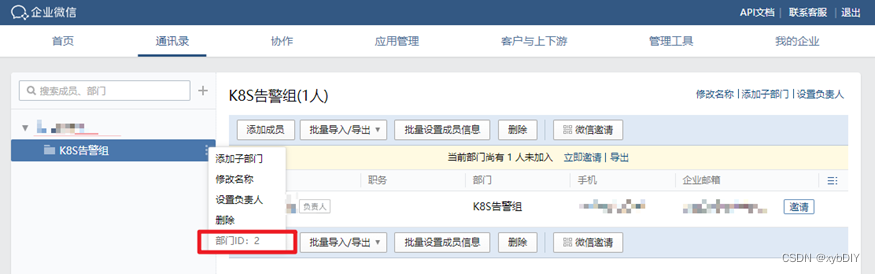
- Login Enterprise WeChat
- Obtain enterprise ID: ww9fxxxxxx03000
- Get Department ID: 2
- AgentId:1000003
- Secret:8FZ_LnlwuFKNf6xxxxxxxxxxxxWwVPH8R3ExJvIs
- get app id
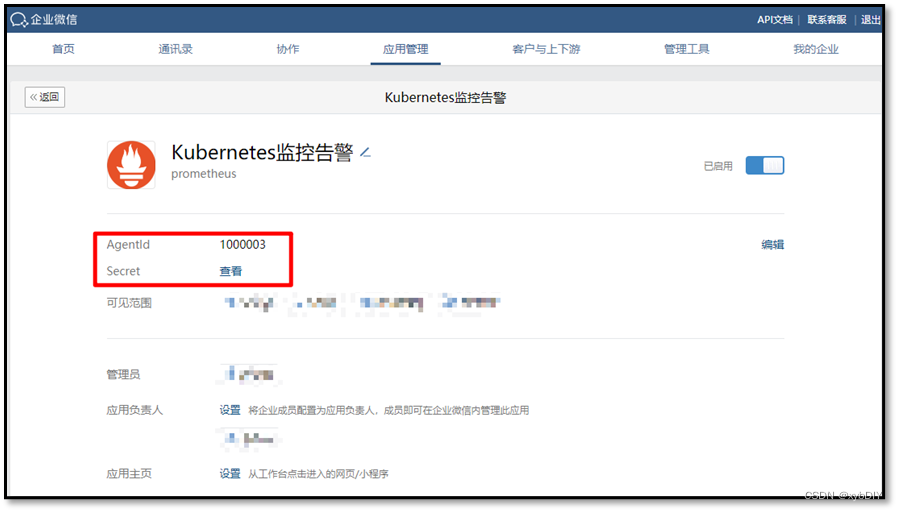

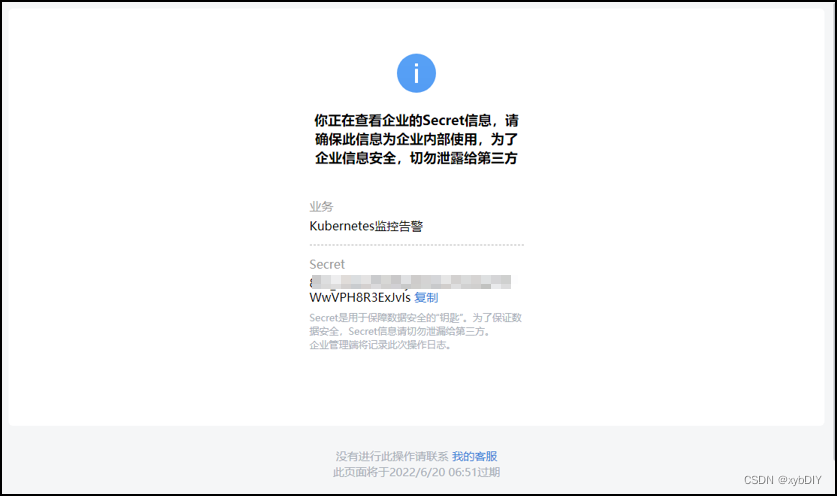
以上步骤完成后,我们就得到了配置Alertmanager的所有信息,包括:企业ID,AgentId,Secret和接收告警的部门id
- Create a wechat.tmpl file
[root@m1 template]# cat /usr/local/alertmanager/template/wechat.tmpl
{

    {

     define "wechat.default.message" }}
{

    {

    - if gt (len .Alerts.Firing) 0 -}}
{

    {

    - range $index, $alert := .Alerts -}}
{

    {

    - if eq $index 0 -}}
告警类型: {

    {

     $alert.Labels.alertname }}
告警级别: {

    {

     $alert.Labels.severity }}
=====================
{

    {

    - end }}
===告警详情===
告警详情: {

    {

     $alert.Annotations.message }}
故障时间: {

    {

     $alert.StartsAt.Format "2006-01-02 15:04:05" }}
===参考信息===
{

    {

     if gt (len $alert.Labels.instance) 0 -}}故障实例ip: {

    {

     $alert.Labels.instance }};{

    {

    - end -}}
{

    {

    - if gt (len $alert.Labels.namespace) 0 -}}故障实例所在namespace: {

    {

     $alert.Labels.namespace }};{

    {

    - end -}}
{

    {

    - if gt (len $alert.Labels.node) 0 -}}故障物理机ip: {

    {

     $alert.Labels.node }};{

    {

    - end -}}
{

    {

    - if gt (len $alert.Labels.pod_name) 0 -}}故障pod名称: {

    {

     $alert.Labels.pod_name }}{

    {

    - end }}
=====================
{

    {

    - end }}
{

    {

    - end }}
{

    {

    - if gt (len .Alerts.Resolved) 0 -}}
{

    {

    - range $index, $alert := .Alerts -}}
{

    {

    - if eq $index 0 -}}
告警类型: {

    {

     $alert.Labels.alertname }}
告警级别: {

    {

     $alert.Labels.severity }}
=====================
{

    {

    - end }}
===告警详情===
告警详情: {

    {

     $alert.Annotations.message }}
故障时间: {

    {

     $alert.StartsAt.Format "2006-01-02 15:04:05" }}
恢复时间: {

    {

     $alert.EndsAt.Format "2006-01-02 15:04:05" }}
===参考信息===
{

    {

     if gt (len $alert.Labels.instance) 0 -}}故障实例ip: {

    {

     $alert.Labels.instance }};{

    {

    - end -}}
{

    {

    - if gt (len $alert.Labels.namespace) 0 -}}故障实例所在namespace: {

    {

     $alert.Labels.namespace }};{

    {

    - end -}}
{

    {

    - if gt (len $alert.Labels.node) 0 -}}故障物理机ip: {

    {

     $alert.Labels.node }};{

    {

    - end -}}
{

    {

    - if gt (len $alert.Labels.pod_name) 0 -}}故障pod名称: {

    {

     $alert.Labels.pod_name }};{

    {

    - end }}
=====================
{

    {

    - end }}
{

    {

    - end }}
{

    {

    - end }}
- Edit the alertmanager.yml configuration file
global:
  resolve_timeout: 1m   									# 每1分钟检测一次是否恢复
  wechat_api_url: 'https://qyapi.weixin.qq.com/cgi-bin/' 	# 请勿修改!!!
  wechat_api_corp_id: '*************'      					# 企业微信中企业ID
  wechat_api_secret: '************************'     		# 企业微信中创建应用的Secret
templates:
  - '/usr/local/alertmanager/template/*.tmpl'
route:
  receiver: 'wechat'
  group_by: ['env','instance','type','group','job','alertname']
  group_wait: 10s       # 初次发送告警延时
  group_interval: 10s   # 距离第一次发送告警,等待多久再次发送告警
  repeat_interval: 1h   # 告警重发时间
#  receiver: 'email'
receivers:
- name: 'wechat'
  wechat_configs:
  - send_resolved: true
    message: '{

    { template "wechat.default.message" . }}'
    to_party: '2'          # 企业微信中创建的接收告警的部门【K8S告警组】的部门ID
    agent_id: '1000003'    # 企业微信中创建的应用的ID
    api_secret: '************************************'    # 企业微信中创建应用的Secret
global:
  resolve_timeout: 1m                                                   # 每1分钟检测一次是否恢复
  wechat_api_url: 'https://qyapi.weixin.qq.com/cgi-bin/'                # 请勿修改!!!
  wechat_api_corp_id: 'ww9ff288a7d3903000'                              # 企业微信中企业ID
  wechat_api_secret: '8FZ_LnlwuFKNf6yR8A8svWO0arYYrWwVPH8R3ExJvIs'      # 企业微信中创建应用的Secret
templates:
  - '/usr/local/alertmanager/template/*.tmpl'
route:
  receiver: 'wechat'
  group_by: ['env','instance','type','group','job','alertname']
  group_wait: 10s                  # 初次发送告警延时
  group_interval: 3m               # 距离第一次发送告警,等待多久再次发送告警
  repeat_interval: 3m              # 告警重发时间
#  receiver: 'email'
receivers:
- name: 'wechat'
  wechat_configs:
  - send_resolved: true    # 是否发出已解决消息
    to_user: '@all'        # 所有用户
    message: '{

    { template "wechat.default.message" . }}'
    to_party: '2'          # 企业微信中创建的接收告警的部门【K8S告警组】的部门ID
    agent_id: '1000003'    # 企业微信中创建的应用的ID
    api_secret: '8FZ_LnlwuFKNf6yR8A8svWO0arYYrWwVPH8R3ExJvIs'    # 企业微信中创建应用的Secret
- Create alertmanager.service configuration file.
cat > /usr/lib/systemd/system/alertmanager.service << EOF
[Unit]
Description=alertmanager
Documentation=https://github.com/prometheus/alertmanager
After=network.target

[Service]
Type=simple
User=root
ExecStart=/usr/local/alertmanager/alertmanager --config.file=/usr/local/alertmanager/alertmanager.yml --storage.path=/data/alertmanager
Restart=on-failure

[Install]
WantedBy=multi-user.target
EOF
- start alertmanager.service
systemctl daemon-reload && systemctl start alertmanager.service && systemctl enable alertmanager.service
- Modify the prometheus.yml configuration file
- Create node_status.yml under the prometheus/rules path
# 创建rules目录并进入
mkdir /usr/local/prometheus/rules &&  cd rules/

# 创建node_status.yml配置文件
cat node_status.yml
groups:
- name: 实例存活告警规则
  rules:
  - alert: 实例存活告警
    expr: up{

    job="prometheus"} == 0 or up{

    job="K8S-Nodes"} == 0
    for: 1m
    labels:
      user: root
      severity: Disaster
    annotations:
      summary: "Instance {

    { $labels.instance }} is down"
      description: "Instance {

    { $labels.instance }} of job {

    { $labels.job }} has been down for more than 1 minutes."
      value: "{

    { $value }}"

- name: 内存告警规则
  rules:
  - alert: "内存使用率告警"
    expr: (node_memory_MemTotal_bytes - (node_memory_MemFree_bytes+node_memory_Buffers_bytes+node_memory_Cached_bytes )) / node_memory_MemTotal_bytes * 100 > 75
    for: 1m
    labels:
      user: root
      severity: warning
    annotations:
      summary: "服务器: {

    {

    $labels.alertname}} 内存报警"
      description: "{

    { $labels.alertname }} 内存资源利用率大于75%!(当前值: {

    { $value }}%)"
      value: "{

    { $value }}"

- name: CPU报警规则
  rules:
  - alert: CPU使用率告警
    expr: 100 - (avg by (instance)(irate(node_cpu_seconds_total{

    mode="idle"}[1m]) )) * 100 > 70
    for: 1m
    labels:
      user: root
      severity: warning
    annotations:
      summary: "服务器: {

    {

    $labels.alertname}} CPU报警"
      description: "服务器: CPU使用超过70%!(当前值: {

    { $value }}%)"
      value: "{

    { $value }}"

- name: 磁盘报警规则
  rules:
  - alert: 磁盘使用率告警
    expr: (node_filesystem_size_bytes - node_filesystem_avail_bytes) / node_filesystem_size_bytes * 100 > 80
    for: 1m
    labels:
      user: root
      severity: warning
    annotations:
      summary: "服务器: {

    {

    $labels.alertname}} 磁盘报警"
      description: "服务器:{

    {

    $labels.alertname}},磁盘设备: 使用超过80%!(挂载点: {

    { $labels.mountpoint }} 当前值: {

    { $value }}%)"
      value: "{

    { $value }}"
- Verify that the alertmanager.yml file is configured correctly
./amtool check-config alertmanager.yml
output result
[root@m1 alertmanager]# pwd
/usr/local/alertmanager
[root@m1 alertmanager]# ./amtool check-config alertmanager.yml
Checking 'alertmanager.yml'  SUCCESS
Found:
 - global config
 - route
 - 0 inhibit rules
 - 1 receivers
 - 1 templates
  SUCCESS
- Start the alertmanager service
systemctl daemon-reload && systemctl start alertmanager && systemctl enable alertmanager && systemctl status alertmanager
- Check whether the alertmanager service process is started
ps -ef | grep alertmanager
- Restart the prometheus service
systemctl daemon-reload && systemctl restart prometheus && systemctl status prometheus
- Visit http://192.168.200.61:9090/alerts to view relevant rule information.
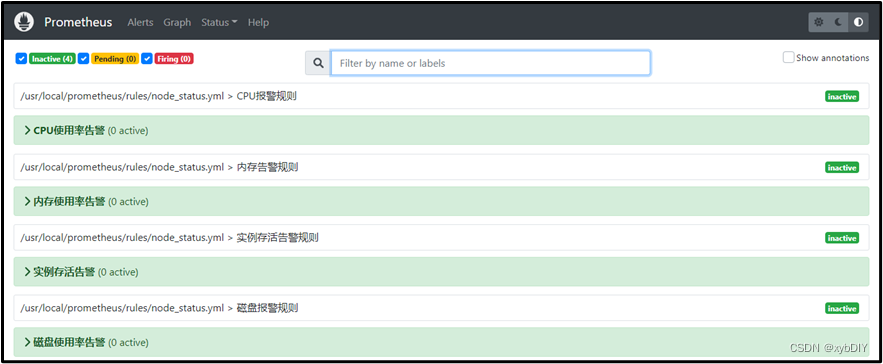
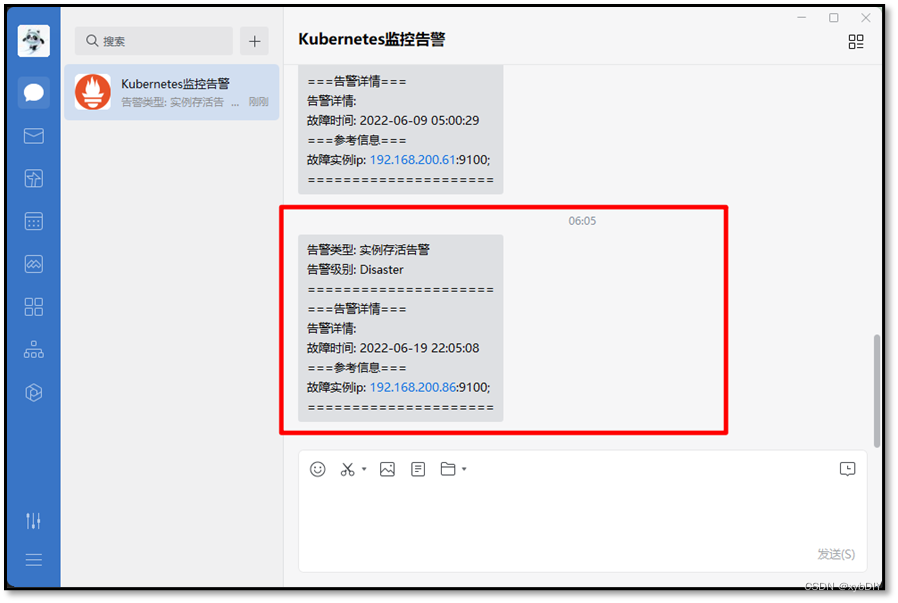
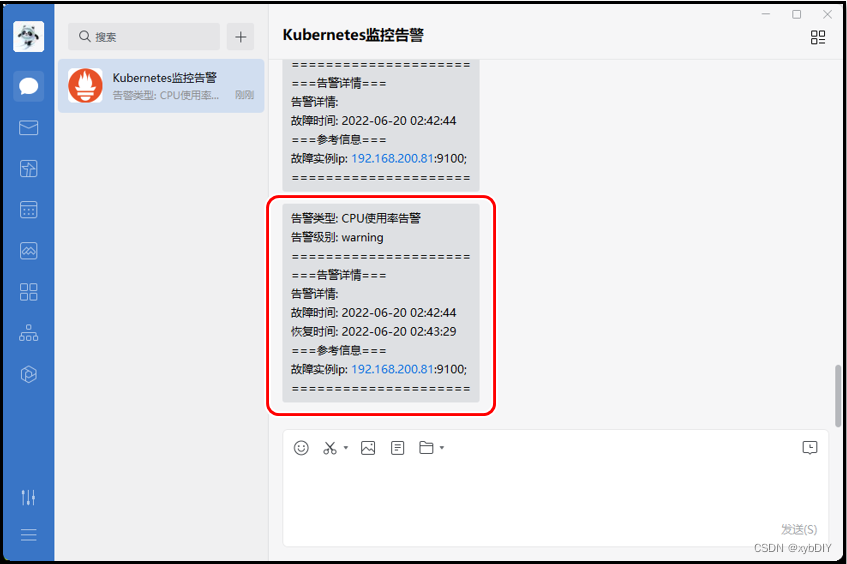
So far, the enterprise Prometheus docking enterprise WeChat alarm deployment is completed, and the following alarm information and recovery information can be seen when a failure occurs.
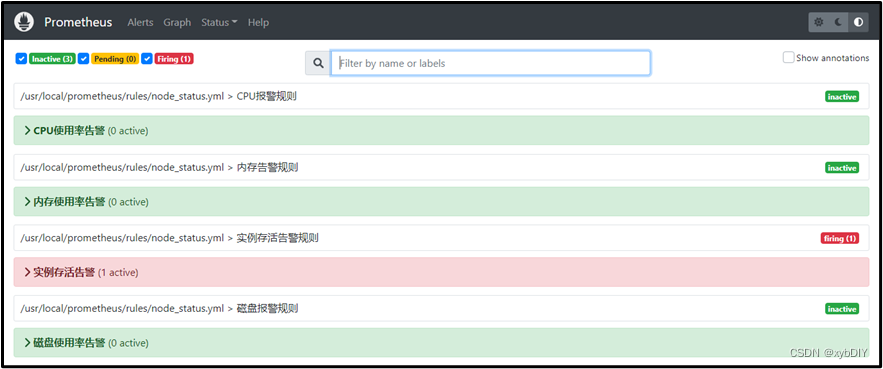
At this point, simulate that one of the hosts is down, and check whether the configured alarm information takes effect in WeChat Work.
- Check the instance survival alarm and find that one of the hosts is down

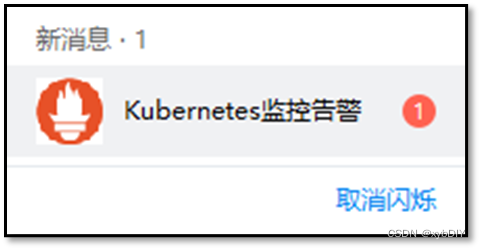
- View the alarm information issued by the enterprise WeChat