Foreword:
Recently, quality CTQ has been promoted throughout the base. To be honest, this function was developed a year ago. It has been tinkered with in the middle and has not been updated for the 10-20 version. It seems a bit exaggerated. In fact, to be honest, the real use of the BI system requires repeated collisions between business personnel and IT departments. The reason why we didn't do it well a year ago was that the company was growing too fast and the business was expanding like crazy. Business departments simply don’t have time to stop and do digital construction. It just so happened that that year was called the Human Resources Year in our company, and we were constantly recruiting people. Of course, we built the digital system based on our understanding of the business and the management requirements at the time.
As of the first half of 2023, the application promotion of CTQ has basically been completed. Today, a small case of CTQ will be used to illustrate how important it is to understand business and promote business in digital construction.
1. From 0 to 1
Usually when we carry out digital construction, the first thing to solve is the problem of presence or absence, so we establish CTQ trends to do quality warnings, trend anomaly analysis, etc. The corresponding early warning logic is based on the internationally commonly used Six Sigma management method, and the corresponding early warning judgments are the eight major international judgments. Those who are interested can refer to the introduction of Six Sigma management method and eight major differences.
Six Sigma Management Method (Management Method)_Baidu Encyclopedia
8 ways to make quality control charts and determine abnormalities.
1.1. Six Sigma method
Six Sigma method, simply put, is 6 control lines. Check whether the corresponding detection data is within these 6 control lines. There are no continuous trend anomalies, such as 1-point out-of-bounds judgment, 3-point continuous warning, 6-point continuous judgment, 9-point unilateral judgment, etc. For example, 1 point out of bounds is used to determine whether the detection value exceeds M+3 sigma, or whether it is less than M-3 sigma. For details, we can see the picture below.
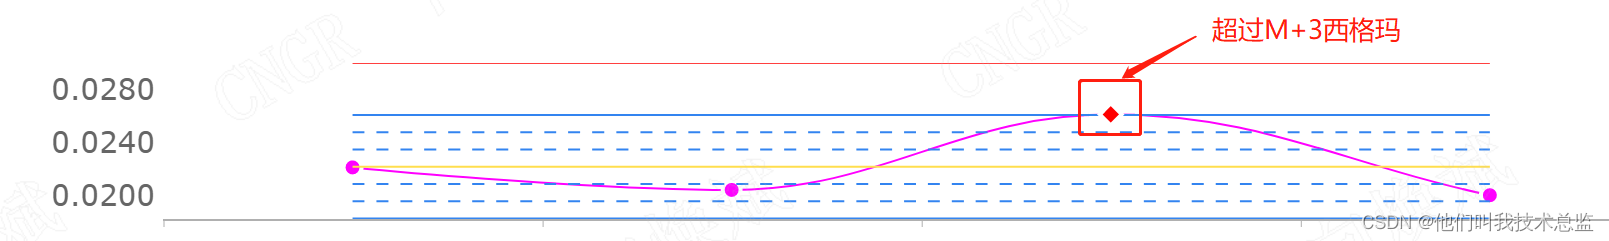
The detection value is greater than M+3 sigma

Detection value is less than M-3 sigma
9-point unilateral discrimination, that is, 9 consecutive points are on one side of M
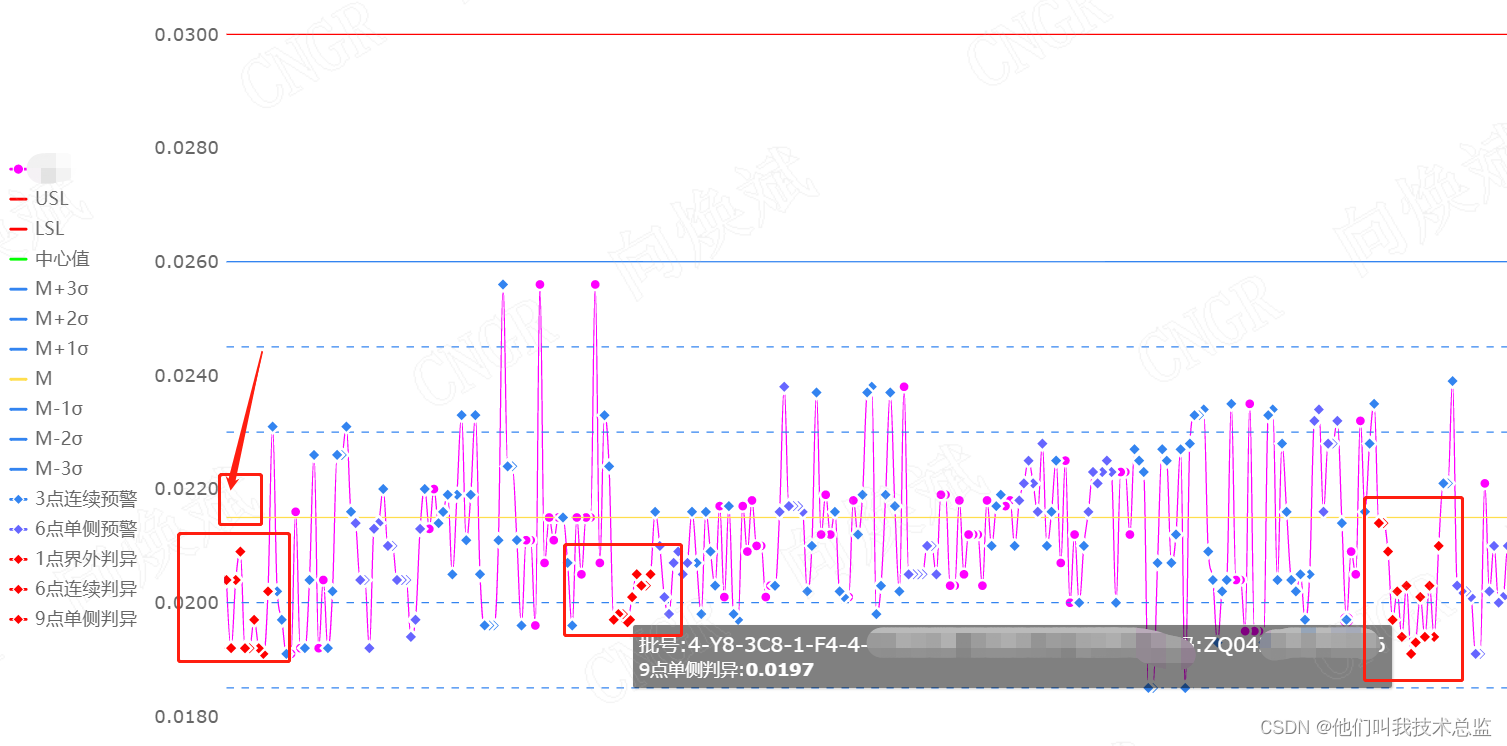
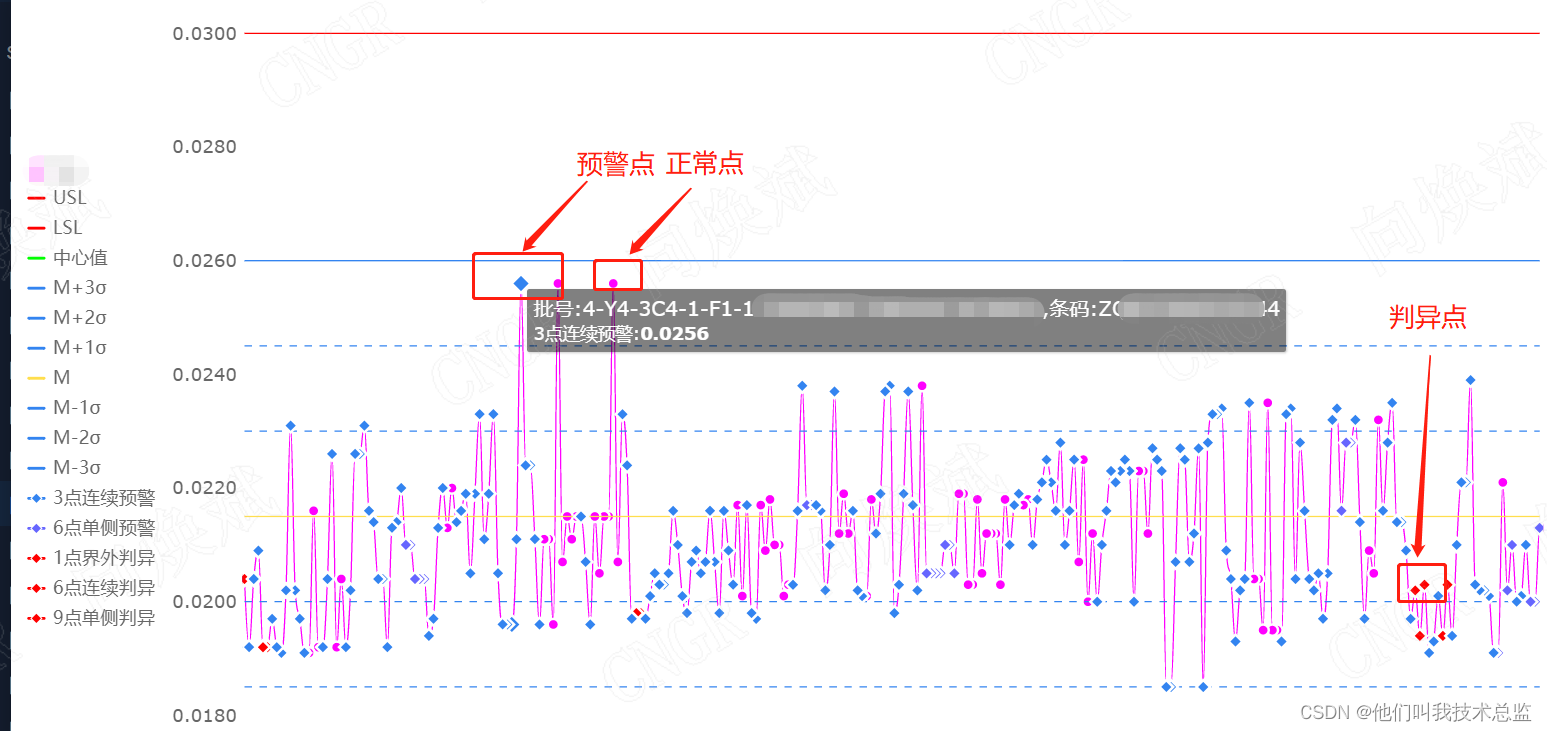
1.2. Eight major differences
As shown in the figure above, we have incorporated the eight major international judgments into the system, and the system can automatically analyze existing trend anomalies. Attentive friends can see that there are dots of different shapes and colors inside. This is also the reason why this CTQ trend analysis will be iterated in versions 10-20. There are corresponding purple dots, red diamonds and color diamonds. In order to see trend anomalies at a glance, when a trend warning or anomaly occurs, the system will change the corresponding point to a shape, and because the level of the judgment is higher than the warning, the color will be changed to red and the shape will be changed after the judgment occurs. It became a diamond shape. The color of the corresponding alert changes to blue and its shape changes to a diamond.
2. 1 to 100
2.1. Details or details
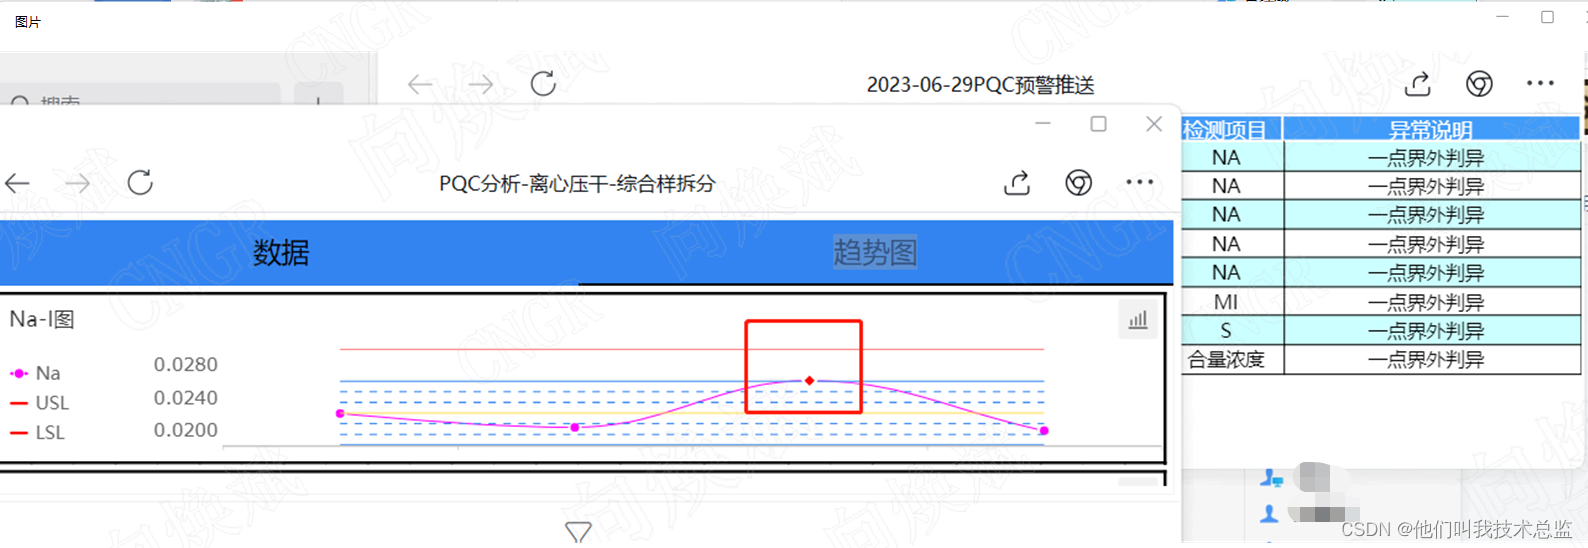
In fact, we can see from the above that the effect is already very good and can meet most needs. However, during the use process, users hope that they can know which items have exceptions and which items have exceptions without having to query them themselves. Then the system automatically pushes the message to the enterprise WeChat to remind him to check it. Therefore, after patiently communicating with the user, the requirement was finally fulfilled by integrating with Enterprise WeChat and using the scheduled scheduling function. Although the process was a bit bumpy, the results were still satisfying.


From the above corporate WeChat message, we can click to see exactly when and which workshop, which process, which model, equipment, which testing item, and what abnormalities occurred.
Is it good enough to get to this point, but it is still not enough. Users hope to see what the anomaly looks like by clicking on it, so we can click on the corresponding message to view the abnormal trend. Therefore, an automatic jump query function has been added to the message link. Hey, isn't it very comfortable to use now?
2.2 Is AI really good?
From the initial implementation of Six Sigma to the realization of eight major differences, to the automatic push of messages for early warning judgments, to the ability to query the details of early warning judgments in messages, etc., after no less than 5 versions of iteration, it should be able to meet the needs. Hahahaha, actually this is not the case. When applying it in depth, you will find that our detection data is not as perfect as expected.
Therefore, sometimes because there are multiple units for a testing project, the same project is entered with data from different units due to lack of timely publicity and implementation. For example, the testing NA project is generally 0.008, but the data entered by different units becomes about 8.2, resulting in The mean M is very large, which will of course cause our trend chart to look a bit strange, as shown in the figure below.
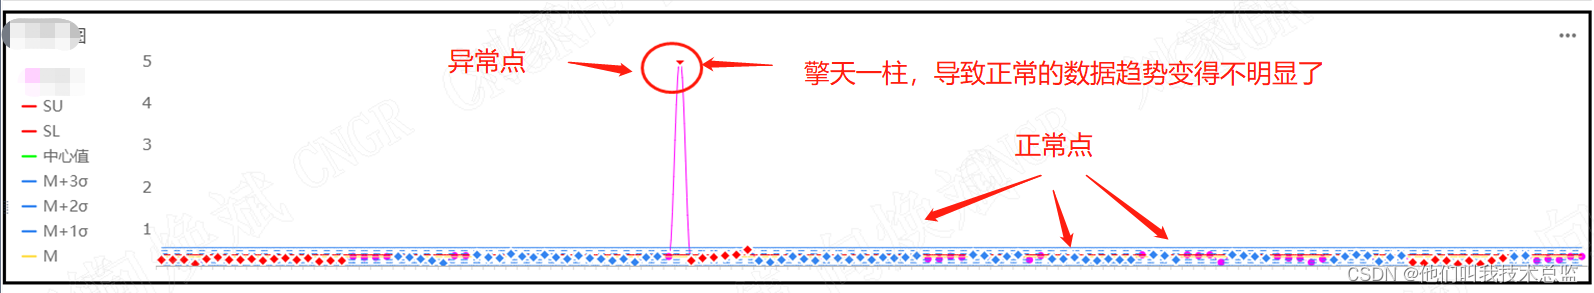
Due to preliminary demand research, through communication, we automatically calculated the mean M based on the query interval data, and calculated the sigma value based on the query data interval for the past half year. Users also calculate in this way offline, but ignore the abnormal data. They will consciously correct and detect abnormal data when calculating the data. Therefore, we developed it according to this demand when communicating. However, it has been found through practice that an abnormal data will affect the trend over a long period of time. Therefore, the automatic calculation and generation of Sigma and M values by AI seems to be a bit inapplicable here, so we have carried out a new version of iterative development.
3. Artificial intelligence, it really still needs artificial intelligence + intelligence
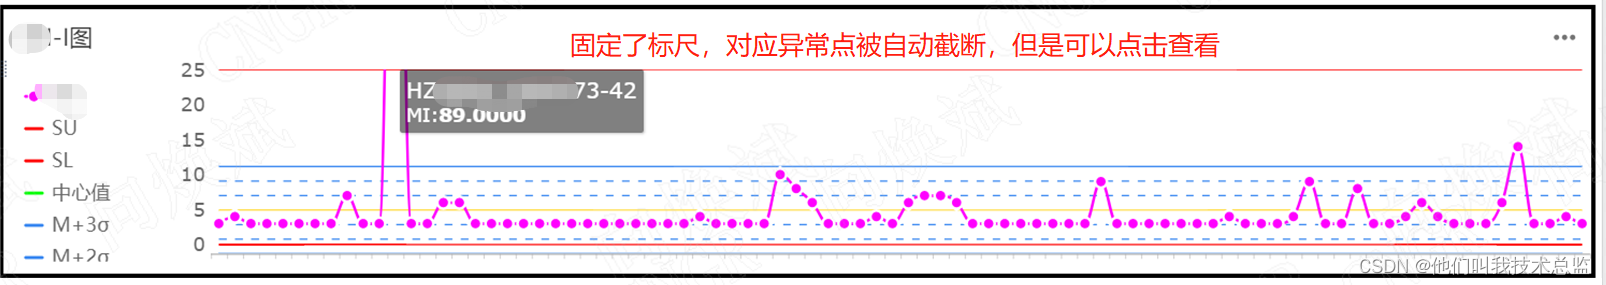
As mentioned above, we use a series of AI analyzes to complete trend analysis and early warning anomaly analysis. Early warning exception message push, early warning judgment and automatic positioning, etc. can greatly liberate the work of offline quality personnel. However, it has recently been discovered that due to too much abnormal data, the early warning seems to have failed. As the user told me the day before yesterday, I hope the control line can be fixed. Since the system automatically calculates based on data, the control line at this time will flexibly change according to the query data~
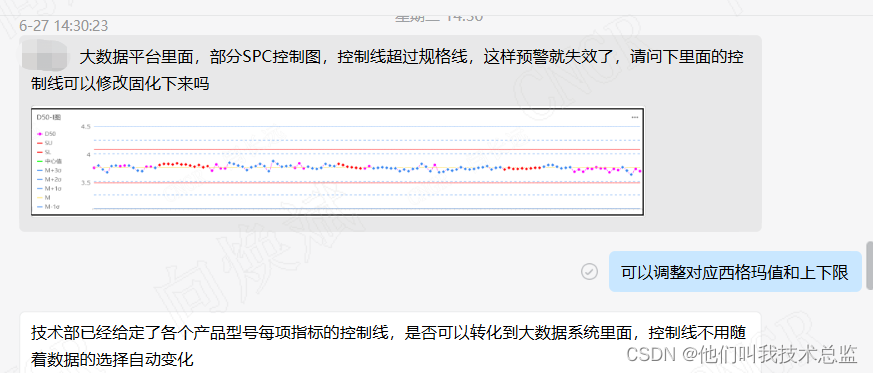
Although many AI functions do facilitate users’ analysis and decision-making. However, some things that need to be solidified still require manual maintenance. In order to meet this requirement, we perform Sigma and Mean M. Upper limit value, lower limit value and other maintenance to fix our ruler. Therefore, the user's needs are finally fulfilled through artificial intelligence + intelligence, which is really a short-term victory~