Table of contents
1. Reading, displaying and saving images
Preface
Next, we will enter the interesting basics of image processing, which contains a lot of content. I hope you can be patient and finish learning the more important content of this chapter.
1. Reading, displaying and saving images
1. Read the image
(1) Functions used
cv2.imread()Function parameters:
- Image path to read
- Read mode flag
-
cv.IMREAD*COLOR: Loads the image in color mode, any image transparency will be ignored. This is the default parameter.
-
cv.IMREAD*GRAYSCALE: Load image in grayscale mode
-
cv.IMREAD_UNCHANGED: Load image mode including alpha channel.
You can use 1/0 or -1 to replace the three signs above
(2) Reference code
import cv2
import matplotlib.pyplot as plt
img = cv2.imread('123.png', 0)
Function analysis: The first two lines are the usage package of the imported function. cv2 is the opencv-python we downloaded. The matplotlib function is also a visualization function. The specific download method is not explained in detail, we will use it later.
The third line of code means to read the image in the path and read it into the function in the form of a grayscale image (0 means reading it in the form of a grayscale image.).
Note: If the path in the above code is wrong, no error will be reported and a None value will be returned.
2. Display image
(1) Use functions
cv2.imshow()
parameter:
- The name of the window displaying the image, expressed as a string type
- image to load
Note: After calling the API for displaying images, you must call cv.waitKey() to allow time for image drawing, otherwise the window will become unresponsive and the image cannot be displayed .
(2) Reference code:
import cv2
import matplotlib.pyplot as plt
img = cv2.imread('123.png', 0)
cv2.imshow('img',img)
cv2.waitKey(0)
# matplotlib中展示
plt.imshow(img)
plt.show()
Code analysis: The first parameter of cv2.imshow('img', img) is the name of the displayed image, and the second parameter is the ontology of the image.
In the cv2.waitKey() function, if the parameter is 0, the function will stop only when any key on the keyboard is pressed when the image is selected. If the parameter is a number greater than 0, it is equivalent to the delay function, and the delay unit is milliseconds.
(3) Function execution effect


3. Saving of images
(1) Functions used
cv2.imwrite()parameter:
- File name, where to save
- image to save
(2) Reference code:
cv.imwrite('messigray.png',img)Code analysis: Open the input path. If there is no problem with the image, it has been saved successfully.
2. Drawing of images
1. Draw straight lines
(1) Functions used
cv2.line(img, start, end, color, thickness)parameter:
- img: image to draw a straight line
- Start,end: the starting point and end point of the straight line
- color: color of the line
- Thickness: line width
(2) Reference code
import cv2
import matplotlib.pyplot as plt
img = cv2.imread('123.png')
cv2.line(img, (0,0), (900, 900), (0, 255, 0), 3)
cv2.imshow('img',img)
cv2.waitKey(0)
Code analysis: The center of the coordinate system is in the upper left corner, and the coordinates of the lower right corner are (900, 900) [which has exceeded the display dimensions]. The color table can be found online, and 3 represents the line width.
(3) Execution effect

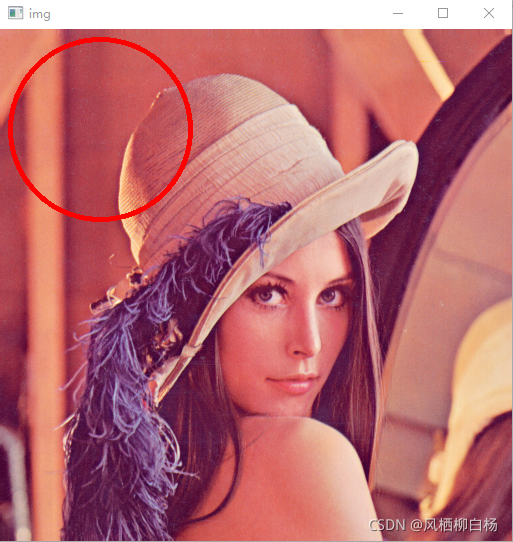
2. Draw a circle
(1) Use function:
cv2.circle(img, centerpoint, r, color, thickness)parameter:
- img: image to draw a circle
- Centerpoint, r: center point and radius of circle
- color: color of the line
- Thickness: line width, when it is -1, a closed pattern is generated and filled with color
(2) Code example:
import cv2
import matplotlib.pyplot as plt
img = cv2.imread('123.png')
cv2.circle(img, (100, 100), 90, (0, 0, 255), 3)
cv2.imshow('img',img)
cv2.waitKey(0)
Code analysis: (100, 100) represents the coordinates from top to bottom, 90 represents the radius, (0, 0, 255) represents the color, and 3 represents the line width.
(3) Execution effect
3. Draw a rectangle
(1) Use function:
cv.rectangle(img,leftupper,rightdown,color,thickness)
parameter:
- img: image to draw a rectangle
- Leftupper, rightdown: coordinates of the upper left and lower right corners of the rectangle
- color: color of the line
- Thickness: line width
(2) Code example:
import cv2
import matplotlib.pyplot as plt
img = cv2.imread('123.png')
cv2.rectangle(img, (100, 100), (300, 300), (0, 0, 255) ,3)
cv2.imshow('img',img)
cv2.waitKey(0)
(3) Execution effect

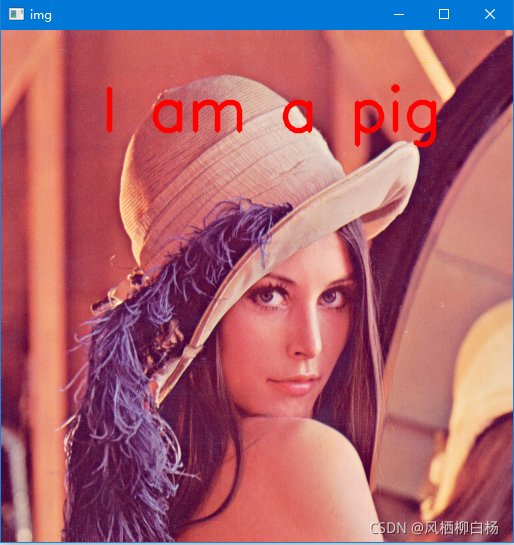
4. Add text to images
(1) Use function:
cv.putText(img,text,station, font, fontsize,color,thickness,cv.LINE_AA)
parameter:
- img: image
- text: text data to be written
- station: the placement position of the text
- font:字体【cv2.FONT_HERSHEY_SIMPLEX】【cv2.FONT_HERSHEY_PLAIN】
- 【cv2.FONT_HERSHEY_DUPLEX】【FONT_HERSHEY_COMPLEX】
- 【cv2.FONT_HERSHEY_TRIPLEX】【cv2.FONT_HERSHEY_COMPLEX_SMALL】
- [There are too many fonts, so I won’t give examples one by one^_^]
- Fontsize: font size
(2) Sample code:
import cv2
import matplotlib.pyplot as plt
img = cv2.imread('123.png')
cv2.putText(img, "I am a pig", (100, 100), cv2.FONT_HERSHEY_SIMPLEX, 2,  (0, 0, 255) ,3, cv2.LINE_AA)
cv2.imshow('img',img)
cv2.waitKey(0)
Code analysis: omitted (^_^)
(3) Execution effect:
Summarize
This article provides a more detailed explanation and code analysis of image reading and painting. Next, we will perform a series of operations on images in the direction of geometric transformation and morphology, so stay tuned! ! (Mainly because I write too much, which affects reading)