2023 May Cup Mathematical Modeling
Question B express delivery demand analysis problem
Original title reproduced:
As an important way of consumption, online shopping has driven the rapid growth of demand for express delivery services and made important contributions to my country's economic development. Accurately predicting the demand for express delivery is of great significance for express companies to lay out warehouse sites, save storage costs, and plan transportation routes. Attachments 1, 2 and 3 are express transportation data between some cities recorded by a domestic express company, including delivery date, delivery city and receiving city (city names have been replaced with letters, excluding June and November data in December and December). Please establish a mathematical model based on the attached data and complete the following questions:
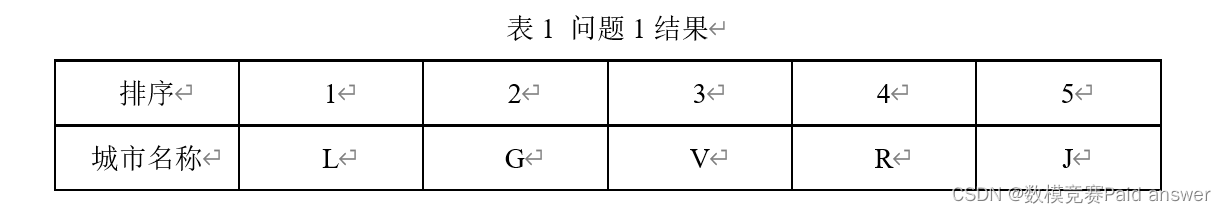
Question 1: Attachment 1 is the site city between April 19, 2018 - April 17, 2019 recorded by the express company (shipping city - receiving city )'s express transportation data, please consider from multiple perspectives such as volume of goods received, volume of shipments, growth/decrease trend in express delivery volume, correlation, etc., establish a mathematical model, comprehensively rank the importance of each site city, and give the degree of importance The top 5 site city names, fill in the results in Table 1.
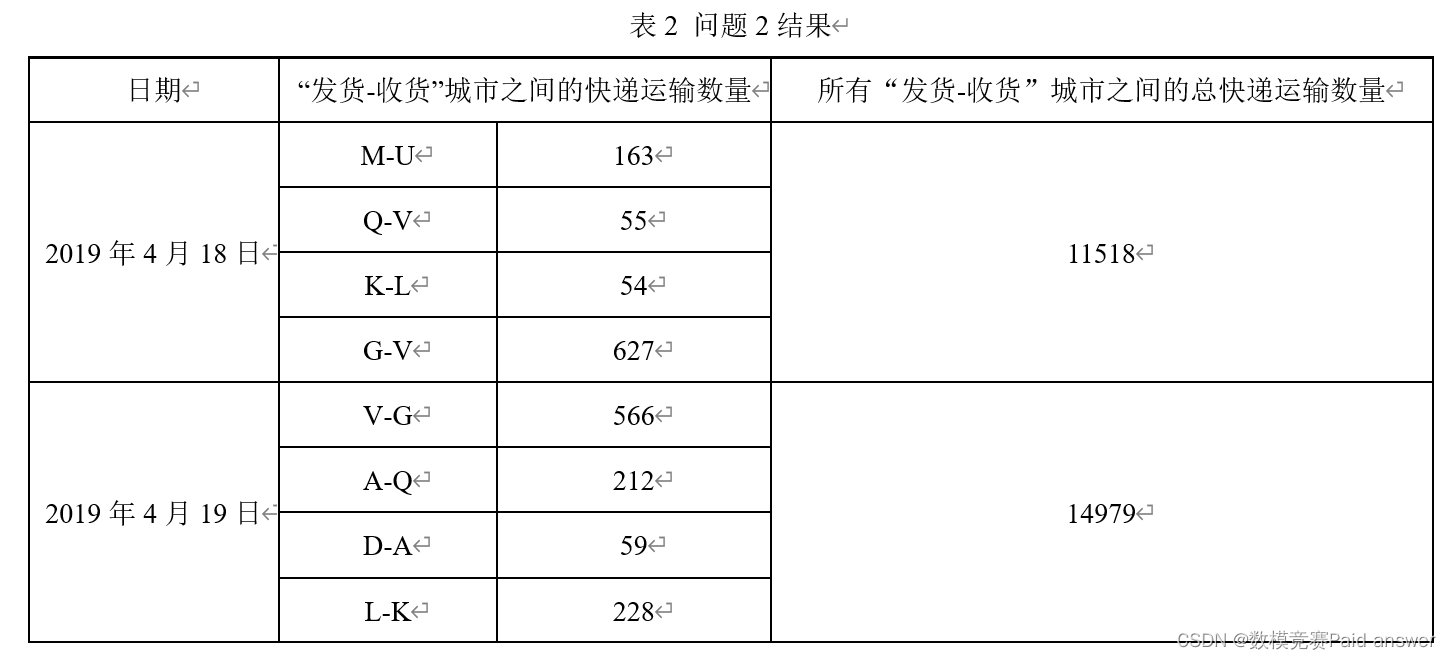
Question 2: Please use the data in Appendix 1 to establish a mathematical model to predict the number of express transportation between cities at each "delivery-receipt" site on April 18, 2019 and April 19, 2019, as well as all "delivery-receipt" on that day. The total express transportation quantity between the cities of the "Receipt" site, and fill in Table 2 the number of express transportation between the designated site cities, as well as the total express transportation quantity between all "Delivery-Receipt" site cities on the day .
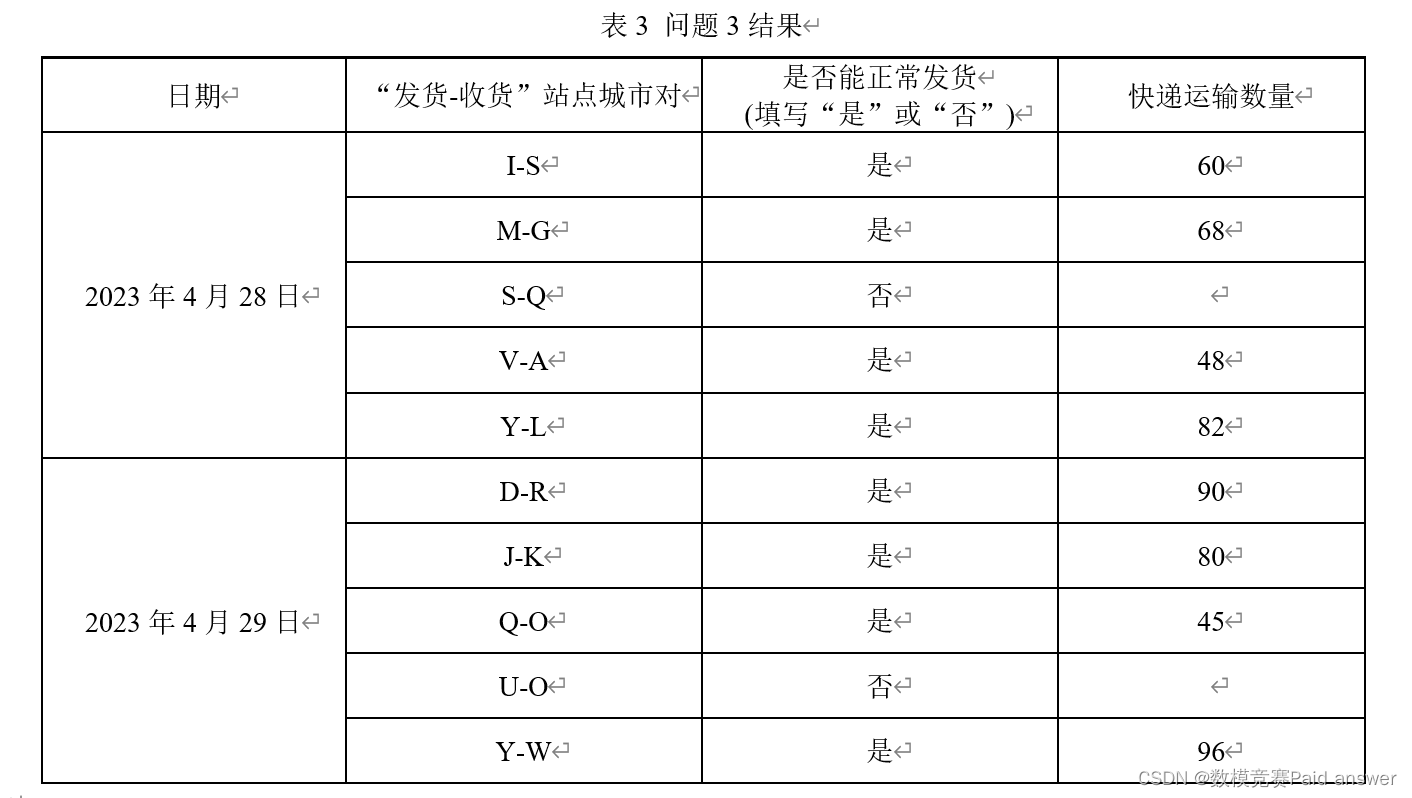
Question 3: Attachment 2 is the express delivery quantity recorded by the express company from April 28, 2020 to April 27, 2023. Due to the impact of emergencies, express delivery lines between some cities cannot be transported normally, resulting in the inability to deliver or receive goods normally between site cities (no data means normal delivery and receipt cannot be performed, 0 means no delivery demand). Please use the data in Appendix 2 to establish a mathematical model to predict the site city pairs (shipping city-receiving city) that can normally "delivery-receive" on April 28, 2023 and April 29, 2023, and judge the table Check whether the station city specified in 3 can deliver goods normally. If it can deliver goods normally, give the corresponding express delivery quantity, and fill in the results in Table 3.
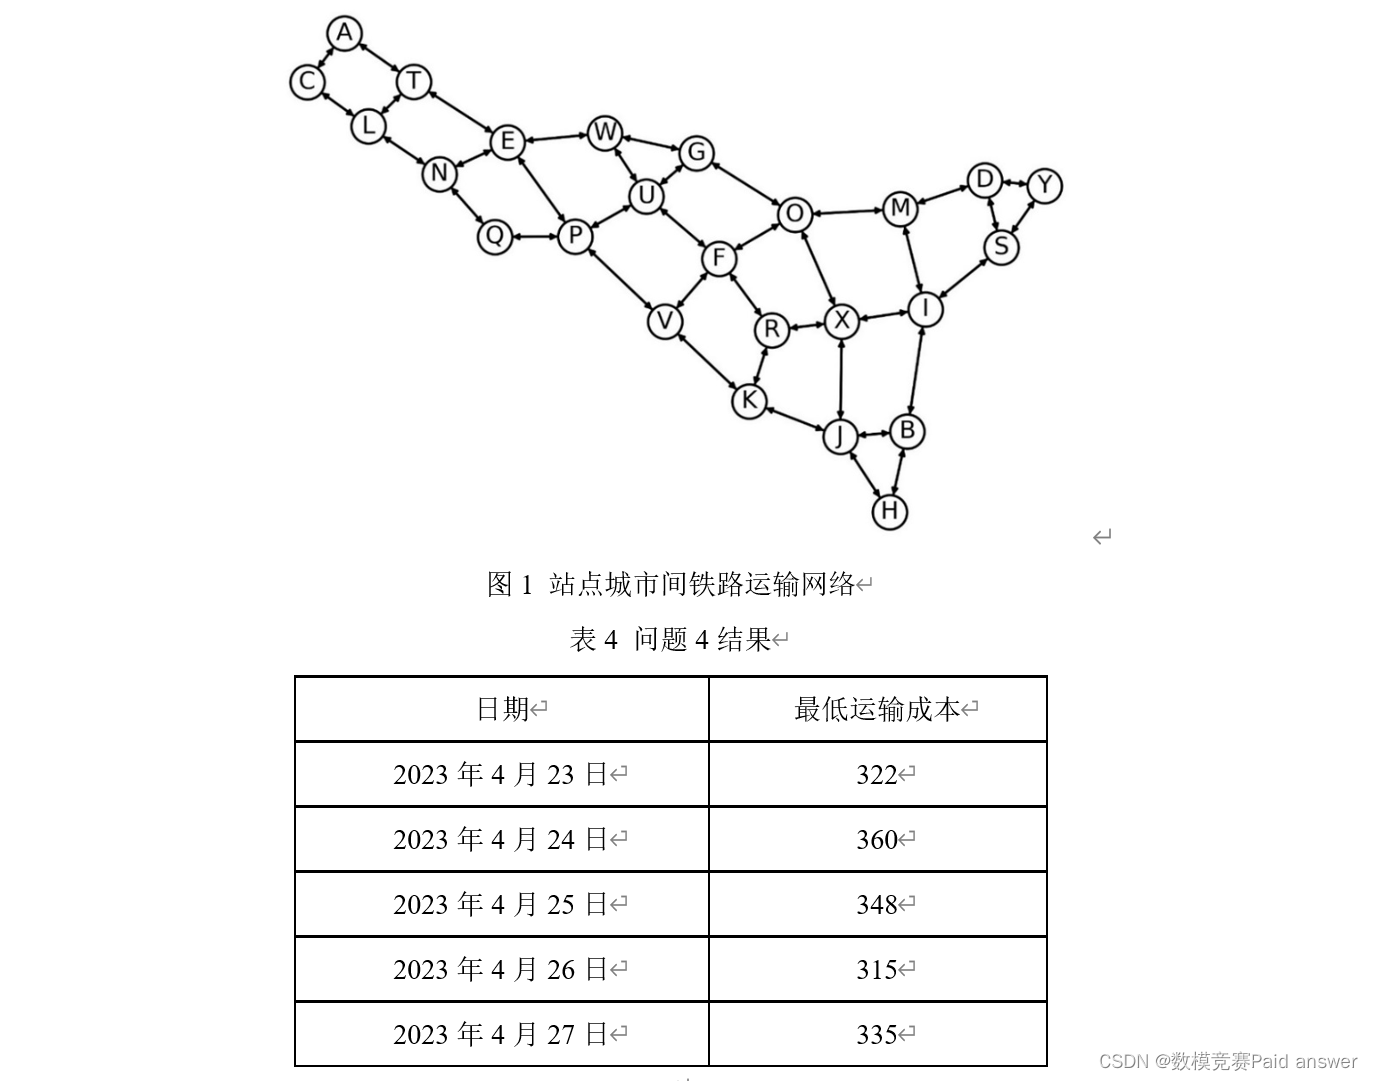
Question 4: Figure 1 shows the railway transportation network between cities at all stations. The railway transportation cost is calculated by the following formula: cost = fixed cost × [1 + (actual loading capacity / rated loading capacity) ^3 ]. In this question, it is assumed that the actual loading capacity is allowed to exceed the rated loading capacity. The fixed costs and rated loading capacity of all railways are given in Appendix 3. When transporting express delivery, it is required that the number of paths used between each "delivery-receipt" site city pair should not exceed 5. Please establish a mathematical model and give the express company the lowest-cost transportation plan. Using the data in Attachments 2 and 3, calculate the company’s daily minimum transportation cost from April 23 to 27, 2023, and fill in Table 4.
Note: For the convenience of calculation, the weight and size of express delivery are not distinguished. It is assumed that the weight of each express delivery is unit 1. Only transportation costs are considered, and other costs such as transit are not considered.
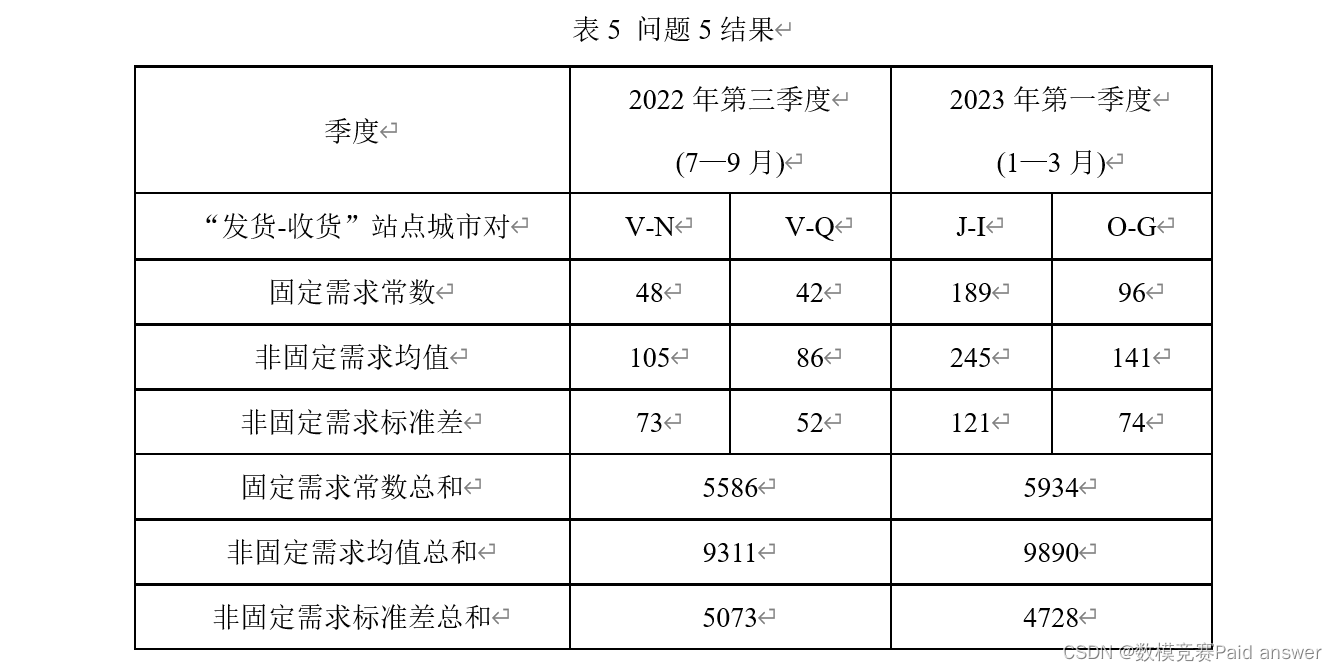
Question 5: Normally, express delivery demand consists of two parts. One part is fixed demand. This part of demand comes from daily necessary online shopping consumption (generally cannot be simply identified as the minimum value of historical express delivery demand data, which is usually less than the minimum value of demand). ); the other part is non-fixed demand, which usually fluctuates greatly and is greatly affected by factors such as time. Assume that in the same quarter, the fixed demand of the city pair at the same "shipping-receiving" site is a certain constant (hereinafter referred to as the fixed demand constant); the non-fixed demand of the city pair at the same "shipping-receiving" site obeys a certain Probability distribution (the mean and standard deviation of this distribution are called the non-fixed demand mean and the non-fixed demand standard deviation respectively). Please use the data in Appendix 2, regardless of deleted data, data with no shipping requirements, or data that cannot be shipped normally, to solve the following problems.
(1) Establish a mathematical model to estimate fixed demand constants on a quarterly basis and verify its accuracy. Fill in Table 5 the fixed demand constants for the specified quarter, the specified "shipping-receiving" site city pair, and the sum of the fixed demand constants for all "shipping-receiving" city pairs in the quarter.
(2) Provide a non-fixed demand probability distribution estimation method, and calculate the mean and standard deviation of non-fixed demand in the specified quarter, the specified "shipping-receiving" site city pair, and all "shipping-receiving" cities in the quarter The sum of the mean values of non-fixed demands and the sum of standard deviations of non-fixed demands are filled in Table 5.
Overview of the overall solution process (abstract)
Online shopping is driving the rapid growth of demand for express delivery services and making important contributions to my country's economic development. In order to save costs and plan transportation routes, it is urgent to accurately predict the demand for express transportation.
In response to question 1, conduct a descriptive statistical analysis on the data in Appendix 1, calculate the total number of delivery and receipt express delivery in different site cities, and conduct a preliminary ranking of the importance of site cities. Then randomly select several site cities and draw a nonlinear fitting curve to explore the relationship between the number of express delivery and the date. Based on the impact of receipt and shipment volume and time and date, the importance of site cities is ranked.
For question 2, first visualize the data. For the data in Appendix 1, draw the quality distribution histogram of the express delivery quantity of the eight lines of MU, QV, KL, GV, VG, AQ, DA, and LK. Visualize the data. Get the missing values of different routes. According to the different proportions of missing values, the distribution brings different line data into the non-stationary time series model. The prediction question requires the number of express transportation on a specified date in the site city.
In response to question 3, we first conduct data mining on the missing dates of express transportation in the designated site cities in Appendix 2, compare and analyze the missing dates of express transportation in different site cities, and conclude that the main factor affecting changes in the number of express transportation in site cities is holidays, and consider the actual factors, such as the epidemic and policy factors. Then, use the gray correlation analysis method and combine multiple influencing factors to obtain the weights of different influencing factors, and based on this, predict the delivery status and express transportation quantity of the designated site city.
For question 4, a cost optimization model based on the shortest path algorithm is established. Based on the given railway transportation route map and data information, the shortest path from the source point to all other points is found. Through clustering, the four points are divided into two parts, and the corresponding paths are traversed with the shipping point and harvest point as the center. After comprehensive processing, the connections and nodes between each node meet the constraint conditions. The connection length is used as a weight to construct a weighted graph, and the Dijkstra algorithm is used to obtain the daily minimum transportation cost from April 23 to 27, 2023.
Regarding question 5, according to the requirements in question 5 (1), the seasonal coefficient method is used to estimate V as the shipping city in the third quarter of 2022, N and Q as the receiving city; J and O in the first quarter of 2023 as the shipping city. For the shipping city, I and G are the quarterly demand constants of the receiving city, and the sum of urban fixed demand constants for all cities in the third quarter of 2022 and the first quarter of 2023 is predicted. Regarding the requirements in Question 5 (2), combined with the conclusion of Question 3, the weight of the impact on express delivery volume in different quarters is also inconsistent. They can promote the increase or decrease in the number of express transportation, and the number of express transportation in different seasonal time periods obeys the Gaussian distribution of continuous data. Use Python software programming to calculate the non-fixed demand mean and standard deviation of the city pairs at the specified site in the specified quarter, and calculate the sum of the non-fixed demand mean and the non-fixed demand standard deviation of all "delivery-receipt" city pairs in the quarter. .
Model assumptions:
1. It is assumed that the number of express transportation changes with time, that is, the number of express transportation in the same station city pair will change as time goes by.
2. It is assumed that there is a certain correlation between the express delivery quantities of different site-city pairs, that is, there is a certain correlation between the express delivery volumes of certain site cities.
3. It is assumed that the growth/decrease trend in the number of express transportation has a certain periodicity, that is,
the number of express transportation between certain site cities will change cyclically.
4. It is assumed that there may be a non-linear correlation between the express delivery quantities of different site-city pairs, that is, there may be a non-linear relationship between the express delivery volumes between certain site cities.
5. It is assumed that the importance of a site city is related to the express transportation volume between other cities, that is, the site city with a larger express delivery volume is more important.
6. It is assumed that the number of express transportation between site cities is inversely proportional to the distance between the two cities, that is, the farther the distance between the two cities, the smaller the number of express transportation.
7. Assume that on the same day, the express delivery volume is related to the shipping city, receiving city and transportation route.
problem analysis:
This question involves multiple mathematical models and algorithms. It mainly explores the main factors that affect the number of urban express transportation at a given site, and based on this, predictions are made based on the requirements of different questions.
Analysis of Question 1:
Through descriptive statistical analysis of the data in Appendix 1, a preliminary ranking of the importance of site cities was made. On this basis, a mathematical model was established to conduct nonlinear fitting of the express delivery quantity on different routes, and to conduct fitting and exploration of the factors that affect the express delivery quantity in site cities, and to obtain rankings of important cities.
Analysis of Question 2:
Check the data integrity by processing the data in Appendix 1. A non-stationary time series model is established for data with an incompleteness of 30% or above to predict the number of express transportation in the city on a specified date.
Analysis of Question 3:
Through the correlation analysis of the date of historical data, shipment completion, receiving city, and express delivery quantity, the data can be used to mine the change pattern of express delivery quantity in different time periods on express lines between designated cities, and use this to establish mathematical The model is used to predict the number of express transportation in designated cities on April 28 and 29, 2023.
Analysis of Question 4:
Based on the railway transportation route map between all the station cities given in the question, combined with the shipping city, receiving city, express transportation quantity, rated loading capacity, and fixed cost of all station cities given in Attachments 2 and 3 Data information, establish a cost optimization model based on the shortest path algorithm, in order to make the transportation route of the express company minimize the cost as much as possible, and the more intermediate cities the express passes through, the more cumbersome the distance path and the greater the cost. Different needs must be considered. The impact weight of different dates in the city on the number of express transportation is solved by solving the cost optimization model of the shortest path.
Analysis of question five:
According to the requirements in Question 5 (1), let V be the shipping city in the third quarter of 2022, and N and Q be the receiving cities; take J and O in the first quarter of 2023 as the shipping city, and take I and G as the shipping city. The receiving city is used as basic data to estimate its quarterly demand constant using the seasonal coefficient method, and reasonable and accurate seasonal coefficients will be applied to predict the sum of urban fixed demand constants for all cities in the third quarter of 2022 and the first quarter of 2023 respectively. In response to the requirements of Question 5 (2), combined with the visualization of the change trend of express delivery quantity and date and time obtained in Question 3 above and the conclusion drawn in Question 3, the impact weight of express delivery quantity in different quarters is also inconsistent. Either to promote the increase in the number of express transportation or to reduce the number of express transportation, the number of express transportation in different seasonal time periods obeys the Gaussian distribution of continuous data. Use python software programming to specify "delivery-receipt" for the specified quarter. "Calculate and solve the non-fixed demand mean and standard deviation of site city pairs, as well as the sum of the non-fixed demand mean and the non-fixed demand standard deviation of all "delivery-receipt" city pairs in the quarter.
Model establishment and solution overall paper thumbnail
For all the papers, please see "Only modeling QQ business cards" below. Just click on the QQ business card.
code:
Part of the procedure is as follows:
import pandas as pd
df = pd.read_excel("附件 1.xlsx")
df.groupby("发货城市")["快递运输数量
"].sum().reset_index().sort_values(by="快递运输数量")
df.groupby("发货城市")["快递运输数量
"].sum().reset_index().sort_values(by="快递运输数量").to_excel("发货
量.xlsx")
df.groupby("收货城市")["快递运输数量
"].sum().reset_index().sort_values(by="快递运输数量").to_excel("收货
量.xlsx")
from pyecharts import Line
asds = pd.read_excel("分组结果.xlsx",sheet_name='G-L')
line = Line("G-L 城市快递运输数量拟合曲线图")
line.add("",asds['日期'],asds['快递运输数量
'],mark_line=["average"],is_smooth=True ,is_label_show=True,is_random=Tr
ue)
line.render('G-L 城市快递运输数量拟合曲线图.html')
from pyecharts import Line
import pandas as pd
year_population_age=pd.read_excel("分组结果.xlsx",sheet_name='A-O')
line3 = Line("A-O 城市快递运输数量堆叠面积图")
line3.add("",
 year_population_age['日期'],
 year_population_age['快递运输数量'],
 is_fill=True,
 area_opacity=0.3,
 is_smooth=True,#是否显示平滑曲线, 默认为 False
 mark_point=['max'],
 is_random=True,
 is_stack=True)
line3.render('A-O 城市快递运输数量堆叠面积图.html')
#计算需求常数、均值、标准差
import pandas as pd
df = pd.read_excel("附件 2.xlsx",sheet_name='2022-3')
df.groupby(["发货城市","收货城市"])["快递运输数量
"].mean().reset_index().sort_values(by="快递运输数量")
df1 = df.groupby(["发货城市","收货城市"])["快递运输数量
"].mean().reset_index().sort_values(by="快递运输数量")
df1.to_excel("2022 第三季度.xlsx")
pf = pd.read_excel("附件 2.xlsx",sheet_name='2023-1')
pf.groupby(["发货城市","收货城市"])["快递运输数量
"].mean().reset_index().sort_values(by="快递运输数量")
pf1.to_excel("2023 第一季度.xlsx")
import numpy as np
tf1 = pd.read_excel("附件 2.xlsx",sheet_name='V-N')
tf2 = pd.read_excel("附件 2.xlsx",sheet_name='V-Q')
tf3 = pd.read_excel("附件 2.xlsx",sheet_name='J-I')
tf4 = pd.read_excel("附件 2.xlsx",sheet_name='O-G')
np.std(tf1['快递运输数量'])
np.std(tf2['快递运输数量'])
np.std(tf3['快递运输数量'])
np.std(tf4['快递运输数量'])
df.groupby(["发货城市","收货城市"])["快递运输数量
"].std().reset_index().sort_values(by="快递运输数量").to_excel("2022 第
三季度标准差和.xlsx")
pf.groupby(["发货城市","收货城市"])["快递运输数量
"].std().reset_index().sort_values(by="快递运输数量").to_excel("2023 第
一季度标准差和.xlsx")