1. SQL performance analysis
1.SQL execution frequency
-- session 是查看当前会话 ;
-- global 是查询全局数据 ;
SHOW GLOBAL STATUS LIKE 'Com_______';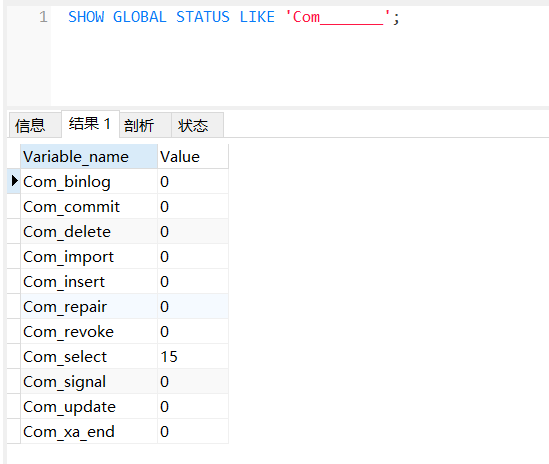
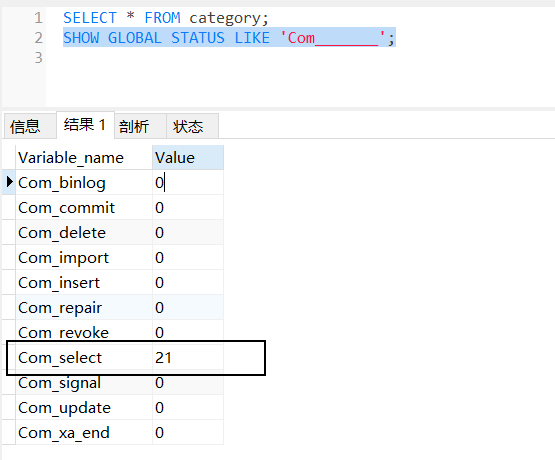
Through the above instructions, we can check whether the current database is mainly based on queries or based on additions, deletions and modifications, thereby providing a reference for database optimization. If it is mainly about additions, deletions and modifications, we can consider not optimizing the index. If it is mainly about query, then you need to consider optimizing the index of the database.
Then by querying the execution frequency of SQL, we can know whether the current database is mainly adding, deleting and changing, or querying. So if it is mainly about queries, how should we position and optimize those query statements? times we can resort to slow query logs.
2. Slow query log
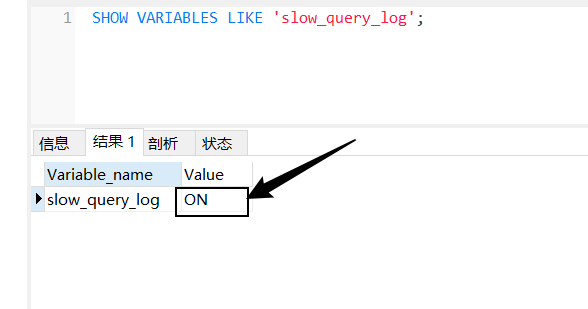
SHOW VARIABLES LIKE 'slow_query_log';Mine has been configured before, so it displays ON (off means off, on means on):
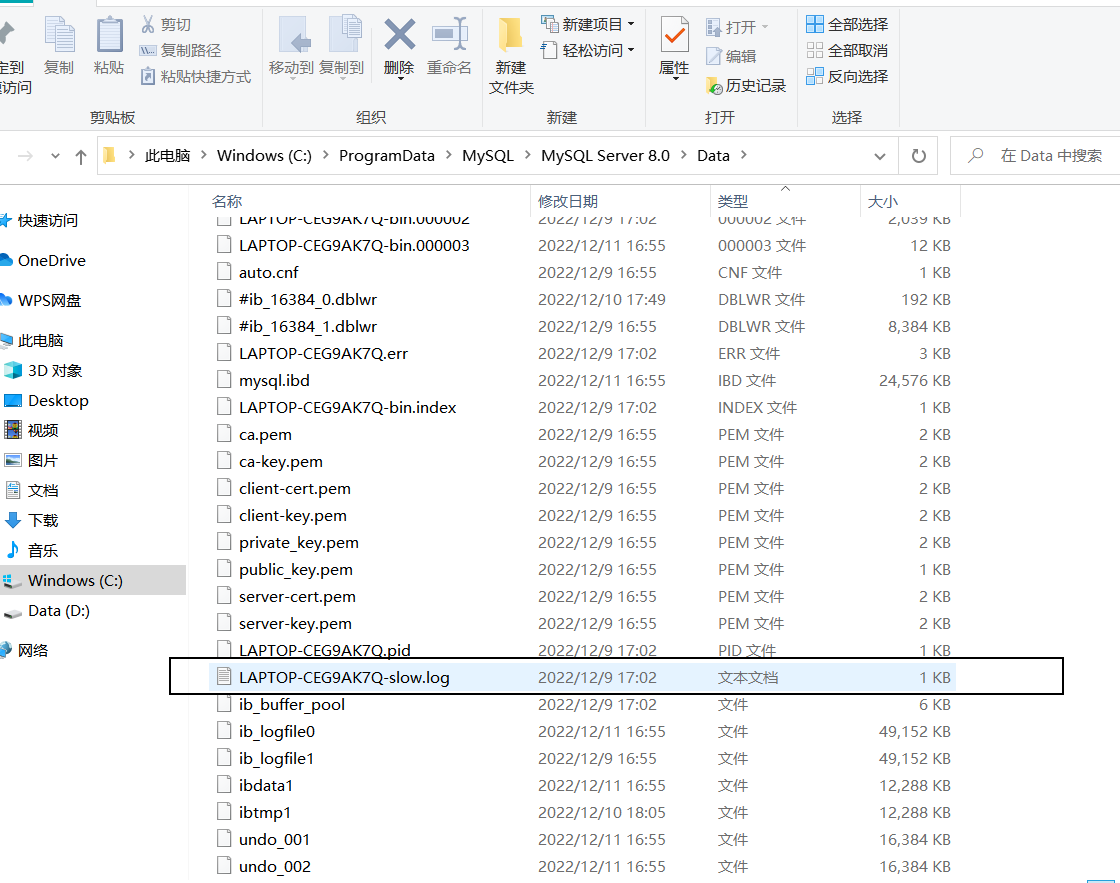
If you want to enable slow query logs, you need to configure the following information in the MySQL configuration file (C:\ProgramData\MySQL\MySQL Server 8.0):

# 开启MySQL慢日志查询开关
slow_query_log=1
# 设置慢日志的时间为2秒,SQL语句执行时间超过2秒,就会视为慢查询,记录慢查询日志
long_query_time=2 
tips:
The difference between my.ini and my.cnf
The MySQL configuration file is my.ini on Windows systems
and my.cnf on Linux or MacOs.The location of the linux or MacOs configuration file
The location of the configuration file is different depending on the way to install MySQL. If it is an installation version, it usually defaults to
/usr/local/mysql-[version number]/,
while the installation-free version is generally in the root path of the MySQL installation directory. If it cannot be found, MySQL installation directory, Linux and MacOS can be searched through commands, usually placed in /etc/my.cnf, /etc/mysql/my.cnf. If you can't find it, you can use the find command to find it.
The location of the Windows configuration file.
Regardless of the installation version or the installation-free version, the best way is to find it through environment variables. The method is available, so I won’t go into details here.
Slow query log:
Test [linux version]:
After the configuration is complete, use the following command to restart the MySQL server for testing and view the information recorded in the slow log file.
/var/lib/mysql/localhost-slow.log 。
systemctl restart mysqld
Then, check the switch status again, and the slow query log has been turned on.
A. Execute the following SQL statement:
select * from tb_user; -- 这条SQL执行效率比较高, 执行耗时 0.00sec
select count(*) from tb_sku; -- 由于tb_sku表中, 预先存入了1000w的记录, count一次,耗时
13.35sec 
B. Check the slow query log:
Finally, we found that in the slow query log, only SQL whose execution time exceeds our preset time (2s) will be recorded, and SQL that executes faster will not be recorded.

In this way, through the slow query log, you can locate the SQL with relatively low execution efficiency and perform targeted optimization.
3. profile details
SELECT @@have_profiling ;
As you can see, MySQL currently supports profile operations if the switch is turned off.
Profiling can be turned on at the session/global level through the set statement :
SET profiling = 1;SELECT @@profiling ;
The switch has been turned on. Next, the SQL statements we execute will be recorded by MySQL , and where the execution time is consumed will be recorded. We directly execute the following SQL statement:
select * from tb_user;
select * from tb_user where id = 1;
select * from tb_user where name = '白起';
select count(*) from tb_user;-- 查看每一条SQL的耗时基本情况
show profiles;
-- 查看指定query_id的SQL语句各个阶段的耗时情况
show profile for query query_id;
-- 查看指定query_id的SQL语句CPU的使用情况
show profile cpu for query query_id;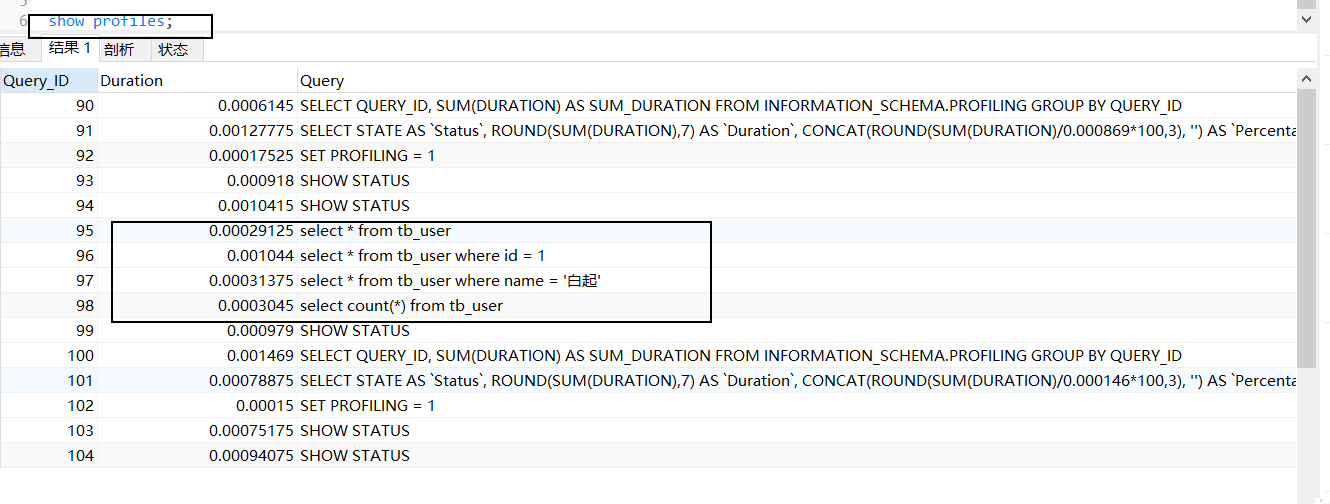
show profile for query 97;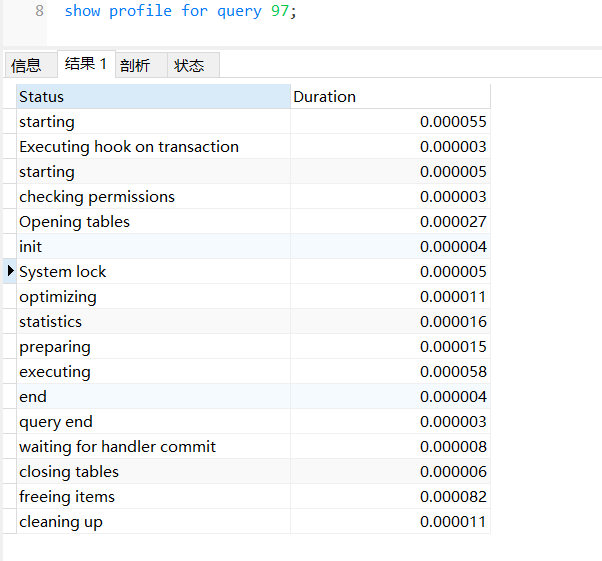
4.explain
-- 直接在select语句之前加上关键字 explain / desc
EXPLAIN SELECT 字段列表 FROM 表名 WHERE 条件 ;
Explain the meaning of each field in the execution plan :

2. Good book recommendations

Tsinghua News Agency [Autumn Reading Plan] Get coupons and enjoy discounts immediately
IT Good Book 5 fold plus 10 yuan no threshold coupon: https://u.jd.com/Yqsd9wj
Event time: September 4th to September 17th, first come first served, come and grab it quickly

Friends who can’t wait, click on the link to view: Get started quickly with Spring Cloud microservices
This time, 2 books will be given away. Two friends will be selected in the comment area to give away books.
Event time: until 2023-09-17 20:00:00Lottery method: Use the program to conduct a lottery.
How to participate: Follow the blogger, like, collect, and comment in the comment area "Life is short, I use Java!"