Article Directory
Query optimization
Small table drives big table
Optimization principle: small tables drive large tables,即小的数据集驱动大的数据集。
select * from A where id in (select id from B)
等价于:
for select id from B
for select * from A where A.id = B.id
When the data set of table B must be smaller than the data set of table A, in is better than exists.
select * from A where exists (select 1 from B where B.id = A.id)
等价于:
for select * from A
for select * from B where B.id = A.id
When the data set of the A table is smaller than the data set of the B table, exists is preferred to in.
- EXISTS
select … from table where exists(subquery)
This grammar can be understood as: Put the data of the main query into the sub-query for conditional verification, and determine whether the data result of the main query is retained according to the verification result (true or false).
orderr by keyword optimization
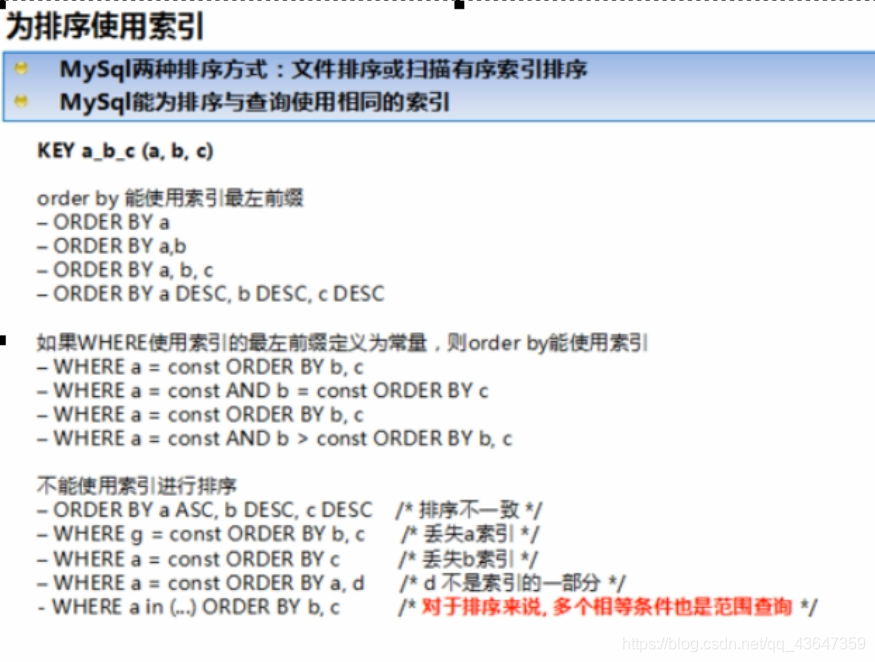
- Order by word, try to use index to sort, avoid using filesort to sort
MySQL supports two ways of sorting. FileSort and index, index are highly efficient. It means that MySQL scans the index itself to complete the sort. The FileSort method is less efficient.
Order by satisfies two conditions and will use Index to sort
The order by statement uses the leftmost
column of the index. The combination of the Where clause and the Order By clause conditional column meets the leftmost column of the index
- Complete the sorting operation on the index column as much as possible, and follow the principle of the best left prefix of the index.
- If it is not on the index column, filesort has two algorithms: mysql must start two-way sorting and single-way sorting
-
Two-way sort
- Before MySQL 4.1, two-way sorting was used, which literally means to scan the disk twice to get the data, read the row pointer and the order by column, sort them, and then scan the sorted list and rewrite it according to the value in the list. Read the corresponding data output from the list.
- Fetch the sort field from the disk, sort in the buffer, and then fetch other fields from the disk.
-
To fetch a batch of data, it is necessary to scan the disk twice. As we all know, I\O is very time-consuming, so after mysql4.1, a second improved algorithm appeared, which is one-way sorting.
-
Single way sort
- Read all the columns required by the query from the disk, sort them in the buffer according to the order by column, and then scan the sorted list for output. It is faster and avoids reading the data a second time. And it turns random IO into sequential IO, but it uses more space because it saves each row in memory.
- Optimization Strategy
Increase the setting of the sort_buffer_size parameter Increase the setting of the
max_length_for_sort_data parameter
group by keyword optimization
The essence of group by is to sort and then group, following the best left prefix built by the index
When index columns cannot be used, increase the setting of max_length_for_sort_data parameter + increase the setting of sort_buffer_size parameter
Where is higher than having, the conditions that can be written in where are not limited by having.
Slow query log
MySQL's slow query log is a log record provided by MySQL. It is used to record statements whose corresponding time exceeds the threshold in MySQL. Specifically, if the running time exceeds long_query_time worth SQL, it will be recorded in the slow query log.
Specifically, if the running time exceeds long_query_time worth SQL, it will be recorded in the slow query log. The default value of long_query_time is 10, which means that the statement will run for more than 10 seconds.
It is used to check which SQL exceeds our maximum endurance time value. For example, if a SQL is executed for more than 5 seconds, we even if it is slow SQL, we hope to collect more than 5 seconds of SQL and perform a comprehensive analysis with explain.
How to use slow query log
By default, the MySQL database does not enable the slow query log, we need to manually set this parameter.
Of course, if it is not needed for tuning, it is generally not recommended to enable this parameter, because turning on the slow query log will more or less bring about a certain performance impact. The slow query log supports writing log records to a file.
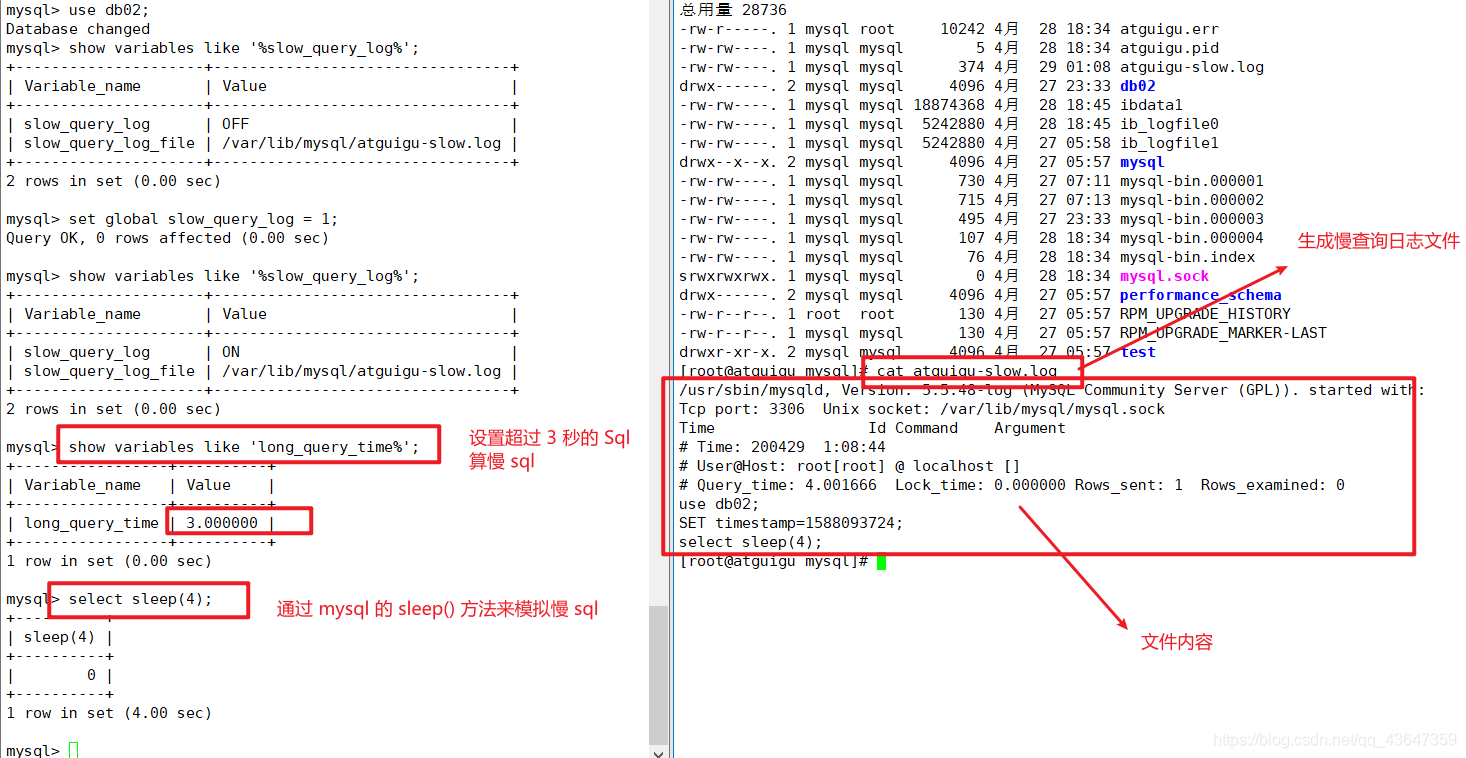
Check if it is turned on and how to turn it on
Default: show variables like '%slow_query_log%';
On:set global slow_query_log = 1;
How to take effect permanently, just modify the configuration file my.cnf (not recommended to open for a long time)
Modify the my.cnf file, add or modify the parameters
slow_query_log and slow_query_log_file under [mysqld] , and then restart the MySQL server.
The specific configuration parameters are as follows:
slow_query_log=1
slow_query_log_file=/var/lib/mysql/mysql-slow.log
Regarding the parameter slow_query_log_file for slow query, it specifies the storage path of the slow query log file, and the system defaults to a default file host_name-slow.log (if the parameter slow_query_log_file is not specified)
What kind of SQL will be recorded in the slow query log?
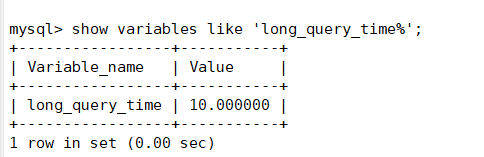
This is controlled by the parameter long_query_time. By default, the value of long_query_time is 10 seconds.
command:show variables like 'long_query_time%';
It can be modified using commands or in the my.cnf parameter.
If the running time is exactly equal to long_query_time, it will not be recorded, that is to say: it is in the mysql source code 判断大于 long_query_time,而非大于等于.
Case example
- See how many seconds are currently full>
show variables like 'long_query_time%'; - Set the slow threshold time:
set global long_query_time=3;
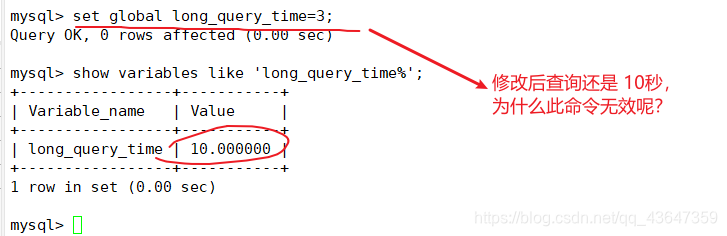
- Why can't I see the change after setting
You need to reconnect or open a new session to see the modified value.
show variables like 'long_query_time%;
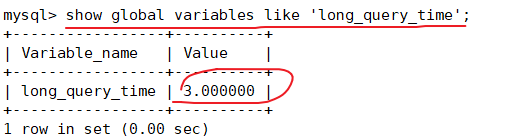
show global variables like 'long_query_time';
- Record slow SQL and follow-up analysis
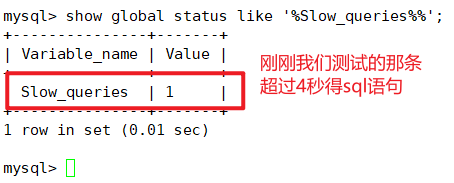
- Query how many slow query records are in the current system
show global status like '%Slow_queries%%';
Permanently configure slow log on
【mysqld】下配置:
slow_query_log==1;
slow_query_log_file=/var/lib/mysql/atguigu-slow.log
long_query_time=3;
log_output=FILE
Log analysis tool mysqldumpslow
In a production environment, if you want to manually analyze logs, find and analyze SQL, MySQL provides a log analysis tool mysqldumpslow.
Check the help command of mysqldumpslow:, mysqldumpslow --helpthe meaning of each parameter is as follows:
- s: indicates the sorting method
- c: number of visits
- I: lock time
- r: return record
- t: query time
- aI: average lock time
- ar: average number of records returned
- at: average query time
- t: How many pieces of data are returned
- g: Matches a regular matching pattern, which is case-insensitive.
Common examples:
// 得到返回记录集最多的 10 个SQL
mysqldumpslow -s r -t 10 /var/lib/mysql/atguigu-slow.log

// 得到访问次数最多的 10 个SQL
mysqldumpslow -s c -t 10 /var/lib/mysql/atguigu-slow.log

// 得到按照时间排序的前 10 条里面含有左连接的查询语句
mysqldumpslow -s t -t -g "left join" /var/lib/mysql/atguigu-slow.log

// 另外建立在使用这些命令时结合 | 和 more 使用,否则有可能出现爆屏情况
mysqldumpslow -s r -t 10 /var/lib/mysql/atguigu-slow.log | more
Batch data script
For example, insert 1000W data into the table.
1. Build a table
# 新建库
create database bigData;
use bigData;

# 建部门表 dept
create table dept(
id int unsigned primary key auto_increment,
deptno mediumint unsigned not null default 0,
dname varchar(20) not null default "",
loc varchar(13) not null default ""
)engine=innodb default charset=GBK;

# 建员工表 emp
create table emp(
id int unsigned primary key auto_increment,
empno mediumint unsigned not null default 0,/*编号*/
ename varchar(20) not null default "",/*名字*/
job varchar(9) not null default "",/*工作*/
mgr mediumint unsigned not null default 0,/*上级编号*/
hiredate date not null,/*入职时间*/
sal decimal(7,2) not null,/*薪水*/
comm decimal(7,2) not null,/*红利*/
deptno mediumint unsigned not null default 0/*部门编号*/
)engine=innodb default charset=gbk;
2. Set the parameter log_bin_trust_function_creators
Create a function, if an error is reported: This function has none of deterministic...
# 由于开启过慢查询日志,因为我们开启了 bin-log,我们就必须为我们的 function 指定一个参数。
show variables like 'log_bin_trust_function_creators';
set global log_bin_trust_function_creators=1;

# 这样添加了参数以后,如果 mysqld 重启,上述参数又会消失,永久方法:
windows:my.ini文件[mysqld]加上log_bin_trust_function_creators=1
linux:/etc/my.cnf下my.cnf文件[mysqld]加上log_bin_trust_function_creators=1
3. Create a function to ensure that each piece of data is different
- Randomly generate string:
DELIMITER $$
CREATE FUNCTION rand_string(n INT) RETURNS VARCHAR(255)
BEGIN
	DECLARE chars_str VARCHAR(100) DEFAULT 'abcdefghigklmnopqrstuvwxyzABCDEFGHIGKLMNOPQRSTUVWXYZ';
	DECLARE return_str VARCHAR(255) DEFAULT '';
	DECLARE i INT DEFAULT 0;
	WHILE i < n DO
	SET return_str=CONCAT(return_str,SUBSTRING(chars_str,FLOOR(1+RAND()*52),1));
	SET i = i + 1;
	END WHILE;
	RETURN return_str;
END $$

# 假如要删除此函数
# drop function rand_string;
- Randomly generate department number:
DELIMITER $$
CREATE FUNCTION rand_num()
RETURNS INT(5)
BEGIN
	DECLARE i INT DEFAULT 0;
	SET i = FLOOR(100+RAND()*10);
	RETURN i;
END $$

# 假如要删除此函数
# drop function rand_num;
4. Create a stored procedure
- Create a stored procedure to insert data into the emp table
# 执行存储过程,往 emp 表中添加随机数据
DELIMITER $$
CREATE PROCEDURE insert_emp(IN START INT(10), IN max_num INT(10))
BEGIN
	DECLARE i INT DEFAULT 0;
	# set autocommit = 0 把 autocommit 设置为0
	SET autocommit=0;
	REPEAT
	SET i = i + 1;
	INSERT INTO emp (empno, ename, job, mgr, hiredate, sal, comm, deptno) VALUES ((START+i), rand_string(6),'SALESMAN',0001,CURDATE(),2000,400,rand_num());
	UNTIL i = max_num
	END REPEAT;
	COMMIT;
END $$
- Create a stored procedure to insert data into the dept table
// 执行存储过程,往 dept 表中添加随机数据
DELIMITER $$
CREATE PROCEDURE insert_dept(IN START INT(10), IN max_num INT(10))
BEGIN
	DECLARE i INT DEFAULT 0;
	SET autocommit = 0;
	REPEAT
	SET i = i + 1;
	INSERT INTO dept (deptno, dname, loc) VALUES ((START+i), rand_string(10), rand_string(8));
	UNTIL i = max_num
	END REPEAT;
	COMMIT;
END $$
5. Call the stored procedure
- Call dept first
DELIMITER ;
CALL insert_dept(100,10);
- When calling emp [the number of inserts can be appropriately reduced if the machine performance is not good]
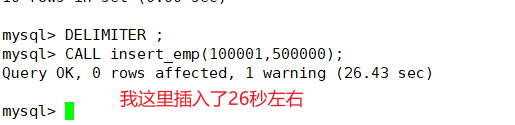
DELIMITER ;
CALL insert_emp(100001,500000);
Show Profile
Show Profile is provided by mysql which can be used to analyze the resource consumption of statement execution in the current session. Can be used for SQL tuning measurement
Official website: http://dev.mysql.com/doc/refman/5.5/en/show-profile.html
By default, the parameter is closed, and the last 15 run results are saved
Show Profile analysis steps
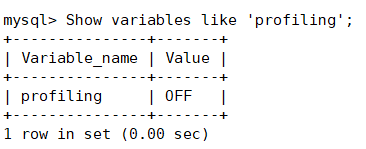
- Does it support? See if the current version supports
Show variables like 'profiling';
- Open function, default closed, need to open before use
set profiling=on;
- Run SQL
- View Results:
show profiles; - Diagnostic SQL:
show profile cpu,block io for query 上一步前面的问题 SQL 数字号码;
Parameter remarks:
type:
| ALL --display all overhead information
| BLOCK IO
--display block IO related overhead | CONTEXT SWITCHES --context switch related overhead
| CPU --display CPU related overhead information
| IPC --display sending and receiving Related cost information
| MEMORY
--Display memory related cost information | PAGE FAULTS --Display page fault related cost information
| SOURCE --Display cost information related to Source_function, Source_file, Source_line
| SWAPS --Display cost related to exchange times
- Conclusions that need attention in daily development
converting HEAP to MyISAM 查询结果太大,内存都不够用了往磁盘上搬了。
Creating tmp table 创建临时表:拷贝数据到临时表;用完再删除。
Copying to tmp table on disk 把内存中临时表复制到磁盘,危险!!!
locked
Global query log
Never enable this feature in a production environment.
Configuration start
在 mysql 的 my.cnf 中,配置如下:
# 开启
general_log=1
# 记录日志文件的路径
general_log_file=/path/logfile
# 输出格式
log_output=FILE
Code start
set global general_log=1;
set global log_output='TABLE';
// 此命令用于查看你编写的 sql 语句
select * from mysql.general_log;
Never enable this feature in a production environment.