Table of contents
1. Activation function definition
The operations of matplotlib are completed on a figure, which is a canvas, similar to a drawing board in reality. On a drawing board, one or more graphics can be drawn, and these graphics are axes . When there is only one graph, you can use matplotlib.pyplot directly to draw it.
1. Activation function definition
To draw the activation function image, first we need the definition of the activation function. If you want to know more about it, you can refer to the following blog post, which is very detailed. Deep learning - detailed activation function (Sigmoid, tanh, ReLU, ReLU6 and variants PR-Leaky, ELU, SELU, Swish, Mish, Maxout, hard-sigmoid, hard-swish)
import matplotlib.pyplot as plt
import numpy as np
class ActivateFunc():
def __init__(self, x, b=None, lamb=None, alpha=None, a=None):
super(ActivateFunc, self).__init__()
self.x = x
self.b = b
self.lamb = lamb
self.alpha = alpha
self.a = a
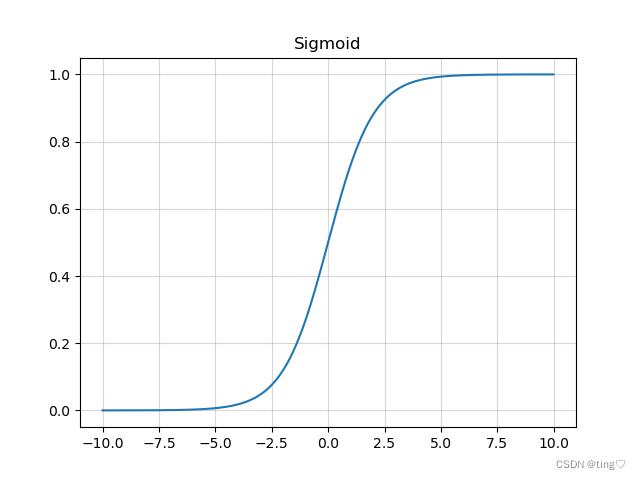
def Sigmoid(self):
y = np.exp(self.x) / (np.exp(self.x) + 1)
y_grad = y*(1-y)
return [y, y_grad]
def Tanh(self):
y = np.tanh(self.x)
y_grad = 1 - y * y
return [y, y_grad]
def Swish(self): #b是一个常数,指定b
y = self.x * (np.exp(self.b*self.x) / (np.exp(self.b*self.x) + 1))
y_grad = np.exp(self.b*self.x)/(1+np.exp(self.b*self.x)) + self.x * (self.b*np.exp(self.b*self.x) / ((1+np.exp(self.b*self.x))*(1+np.exp(self.b*self.x))))
return [y, y_grad]
def ELU(self): # alpha是个常数,指定alpha
y = np.where(self.x > 0, self.x, self.alpha * (np.exp(self.x) - 1))
y_grad = np.where(self.x > 0, 1, self.alpha * np.exp(self.x))
return [y, y_grad]
def SELU(self): # lamb大于1,指定lamb和alpha
y = np.where(self.x > 0, self.lamb * self.x, self.lamb * self.alpha * (np.exp(self.x) - 1))
y_grad = np.where(self.x > 0, self.lamb*1, self.lamb * self.alpha * np.exp(self.x))
return [y, y_grad]
def ReLU(self):
y = np.where(self.x < 0, 0, self.x)
y_grad = np.where(self.x < 0, 0, 1)
return [y, y_grad]
def PReLU(self): # a大于1,指定a
y = np.where(self.x < 0, self.x / self.a, self.x)
y_grad = np.where(self.x < 0, 1 / self.a, 1)
return [y, y_grad]
def LeakyReLU(self): # a大于1,指定a
y = np.where(self.x < 0, self.x / self.a, self.x)
y_grad = np.where(self.x < 0, 1 / self.a, 1)
return [y, y_grad]
def Mish(self):
f = 1 + np.exp(x)
y = self.x * ((f*f-1) / (f*f+1))
y_grad = (f*f-1) / (f*f+1) + self.x*(4*f*(f-1)) / ((f*f+1)*(f*f+1))
return [y, y_grad]
def ReLU6(self):
y = np.where(np.where(self.x < 0, 0, self.x) > 6, 6, np.where(self.x < 0, 0, self.x))
y_grad = np.where(self.x > 6, 0, np.where(self.x < 0, 0, 1))
return [y, y_grad]
def Hard_Swish(self):
f = self.x + 3
relu6 = np.where(np.where(f < 0, 0, f) > 6, 6, np.where(f < 0, 0, f))
relu6_grad = np.where(f > 6, 0, np.where(f < 0, 0, 1))
y = self.x * relu6 / 6
y_grad = relu6 / 6 + self.x * relu6_grad / 6
return [y, y_grad]
def Hard_Sigmoid(self):
f = (2 * self.x + 5) / 10
y = np.where(np.where(f > 1, 1, f) < 0, 0, np.where(f > 1, 1, f))
y_grad = np.where(f > 0, np.where(f >= 1, 0, 1 / 5), 0)
return [y, y_grad]
2. Drawing
[python] Explanation of each part of the matplotlib module-CSDN Blog
if __name__ == '__main__':
    x = np.arange(-10, 10, 0.01)
    activateFunc = ActivateFunc(x)
    activateFunc.b = 1
    PlotActiFunc(x, activateFunc.Sigmoid()[0], title='Sigmoid')
    PlotActiFunc(x, activateFunc.Swish()[0], title='Swish')
    PlotActiFunc(x, activateFunc.ReLU()[0], title='ReLU')
    PlotActiFunc(x, activateFunc.Mish()[0], title='Mish')
    PlotActiFunc(x, activateFunc.Mish()[1], title='Mish-grad')
    PlotActiFunc(x, activateFunc.Swish()[1], title='Swish-grad')


    plt.figure(1)
    PlotMultiFunc(x, activateFunc.Mish()[1])
    PlotMultiFunc(x, activateFunc.Swish()[1])
    plt.legend(['Mish-grad', 'Swish-grad'])

    plt.figure(2)
    PlotMultiFunc(x, activateFunc.Swish()[0])
    PlotMultiFunc(x, activateFunc.Mish()[0])
    plt.legend(['Swish', 'Mish'])

    plt.figure(3)
    PlotMultiFunc(x, activateFunc.Swish()[0])
    PlotMultiFunc(x, activateFunc.Hard_Swish()[0])
    plt.legend(['Swish', 'Hard-Swish'])

    plt.figure(4)
    PlotMultiFunc(x, activateFunc.Sigmoid()[0])
    PlotMultiFunc(x, activateFunc.Hard_Sigmoid()[0])
    plt.legend(['Sigmoid', 'Hard-Sigmoid'])

    plt.figure(5)
    PlotMultiFunc(x, activateFunc.ReLU()[0])
    PlotMultiFunc(x, activateFunc.ReLU6()[0])
    plt.legend(['ReLU', 'ReLU6'])

    plt.figure(6)
    PlotMultiFunc(x, activateFunc.Swish()[1])
    PlotMultiFunc(x, activateFunc.Hard_Swish()[1])
    plt.legend(['Swish-grad', 'Hard-Swish-grad'])

    plt.figure(7)
    PlotMultiFunc(x, activateFunc.Sigmoid()[1])
    PlotMultiFunc(x, activateFunc.Hard_Sigmoid()[1])
    plt.legend(['Sigmoid-grad', 'Hard-Sigmoid-grad'])

    plt.figure(8)
    PlotMultiFunc(x, activateFunc.ReLU()[1])
    PlotMultiFunc(x, activateFunc.ReLU6()[1])
    plt.legend(['ReLU-grad', 'ReLU6-grad'])


    plt.show()
3. Some results examples


The focus of this article is on the activation function definition. Only the simplest drawing operations are used. The image format needs to be modified. You can refer to other articles in the column.