Deep Learning (36) - Graph Neural Network GNN (1)
I will put all the codes of this series on git, welcome to visit
Article directory
1. Basic knowledge
-
GNN considers the relationship between the current point and the surrounding points
-
The adjacency matrix is a symmetric sparse matrix that represents the relationship between points in the graph
-
The input of the graph neural network is the feature and adjacency matrix of each node
-
文本数据可以用图的形式表示吗?Text data can also be represented in the form of a graph, and the adjacency matrix represents the connection relationship -
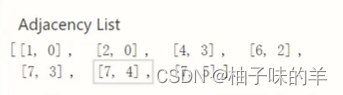
The adjacency matrix is not an N*N matrix, but a 2*N matrix of source and target
-
Information transfer neural network:
每个点的特征如何更新??——Consider their neighbors, the update method can be set by yourself: maximum, minimum, average, summation, etc. -
GNN can have multiple layers, and the structure of the graph does not change, that is, the points connected to the current point do not change (the adjacency matrix does not change) [there is a concept of receptive field in convolution, which also exists in GNN, and the receptive field of GNN It also becomes larger as the number of layers increases]
-
GNN输出的特征可以干什么?- Combining the features of each node to classify graphs [graph-level tasks]
- Classify each node [node level task]
- Edge classification [edge level task]
利用图结构得到特征,最终做什么自定义!
2. Usage scenarios
为什么CV和NLP中不用GNN?
Because the data format of images and text is fixed, the traditional neural network format is fixed, and the input format is fixed- chemistry, medical
- molecular, atomic structure
- drug target
- Road traffic, dynamic flow forecast
- Social Networking - Researcher
GNN输入格式比较随意,是不规则的数据结构, 主要用于输入数据不规则的时候
3. Graph Convolutional Neural Network GCN
图卷积和卷积完全不同- GCN is not purely supervised learning, most of them are semi-supervised, some points are not labeled, and only labeled points are considered when calculating the loss. It can also be trained for the case of small amount of data
(1) Basic idea
- Network level: the first layer needs to be updated for each point, and finally output the feature vector corresponding to each point [generally, it will not be particularly deep]
- The basic composition of the graph: G (original image) A (adjacency) D (degree) F (feature)
- Reciprocal of degree matrix * adjacency matrix * reciprocal of degree matrix --> get a new adjacency matrix [left multiplication normalizes rows, right multiplication normalizes columns]
- Two to three layers are enough, too many will not work well
4. GNN basic framework - pytorch_geometric
It implements various GNN methods.
注意:安装过程中不要pip install,会失败!根据自己的device和python版本去下载scatter,pattern等四个依赖,先安装他们然后再pip install torch_geometric==2.0
Remember here that it is version 2.0, otherwise TypeError: Expected 'Iterator' as the return annotation for __iter__of SMILESParser, but found
ty here
下面是一个demo
(1) data
The data provided by this package is used here. For details, please refer to: club

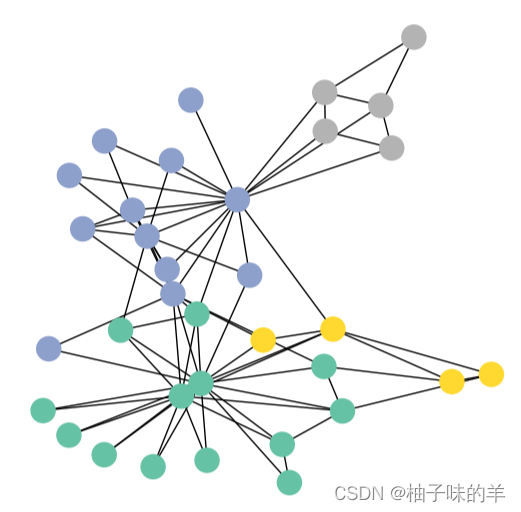
from torch_geometric.datasets import KarateClub

dataset = KarateClub()
print(f'Dataset: {

      dataset}:')
print('======================')
print(f'Number of graphs: {

      len(dataset)}')
print(f'Number of features: {

      dataset.num_features}')
print(f'Number of classes: {

      dataset.num_classes}')

data = dataset[0]  # Get the first graph object.
In torch_geometric, the format of Data is used for the graph, and the object of Data: you can learn more about the attributes in the document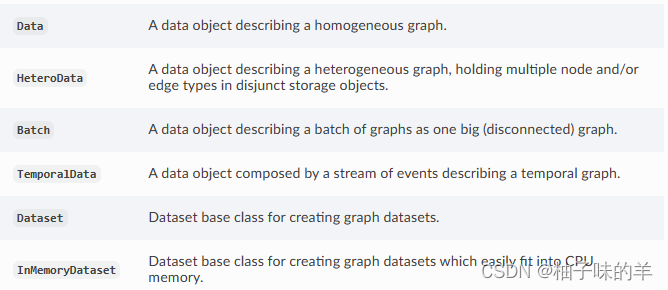
- edge_index: Indicates the connection relationship of the graph (start, end two sequences)
- node features: the characteristics of each point
- node labels: the label of each point
- train_mask: Some nodes have no labels (used to indicate which nodes need to calculate the loss)
(2) Visualization
from torch_geometric.utils import to_networkx

G = to_networkx(data, to_undirected=True)
visualize_graph(G, color=data.y)
(3) Network definition
The definition of GCN layer: 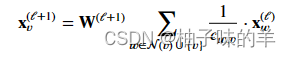
you can learn more about it in the documentation on the official website
There are many convolutional layers:

import torch
from torch.nn import Linear
from torch_geometric.nn import GCNConv
class GCN(torch.nn.Module):
def __init__(self):
super().__init__()
torch.manual_seed(1234)
self.conv1 = GCNConv(dataset.num_features, 4) # 只需定义好输入特征和输出特征即可
self.conv2 = GCNConv(4, 4)
self.conv3 = GCNConv(4, 2)
self.classifier = Linear(2, dataset.num_classes)
def forward(self, x, edge_index):
h = self.conv1(x, edge_index) # 输入特征与邻接矩阵(注意格式,上面那种)
h = h.tanh()
h = self.conv2(h, edge_index)
h = h.tanh()
h = self.conv3(h, edge_index)
h = h.tanh()
# 分类层
out = self.classifier(h)
return out, h
model = GCN()
print(model)
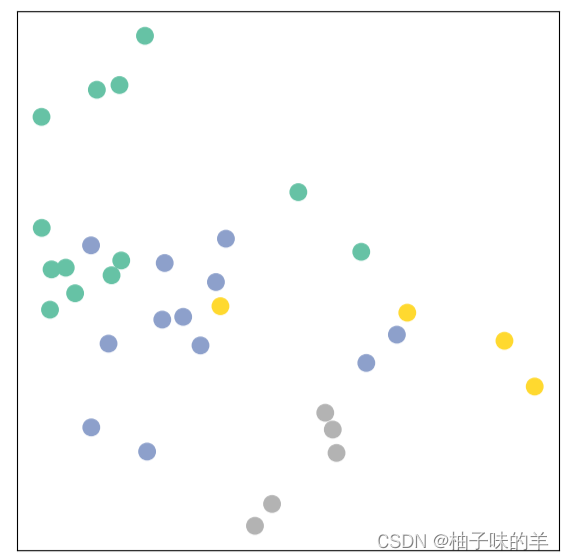
_, h = model(data.x, data.edge_index)
print(f'Embedding shape: {
list(h.shape)}')# 输出最后分类前的中间特征shape
visualize_embedding(h, color=data.y)
very scattered at this time
(4) Training model (semi-supervised)
import time

model = GCN()
criterion = torch.nn.CrossEntropyLoss()  # Define loss criterion.
optimizer = torch.optim.Adam(model.parameters(), lr=0.01)  # Define optimizer.

def train(data):
    optimizer.zero_grad()
    out, h = model(data.x, data.edge_index) #h是两维向量,主要是为了画图方便
    loss = criterion(out[data.train_mask], data.y[data.train_mask])  # semi-supervised
    loss.backward()
    optimizer.step()
    return loss, h

for epoch in range(401):
    loss, h = train(data)
    if epoch % 10 == 0:
        visualize_embedding(h, color=data.y, epoch=epoch, loss=loss)
        time.sleep(0.3)
Then you can see a series of graphs to see the changes of the points.