In recent projects, we have encountered a lot of echarts charts. One of the requirements is to click to select the histogram and highlight it to distinguish it, so as to observe the data display. Without further ado, let's go directly to the code.
First of all, it is highlighted. The echarts official website is divided into old version and new version. Please pay attention to whether the echarts you are using is the new version or the old version. The highlighted version number of the new version is 5.0 and above.
1. Let me introduce the new version first. In the new version, it is very simple. You can solve the problem directly according to the two attributes in the figure below.

2. In the old version lower than 5.0
Step 1: Define a curInt in data to save the clicked dataIndex.
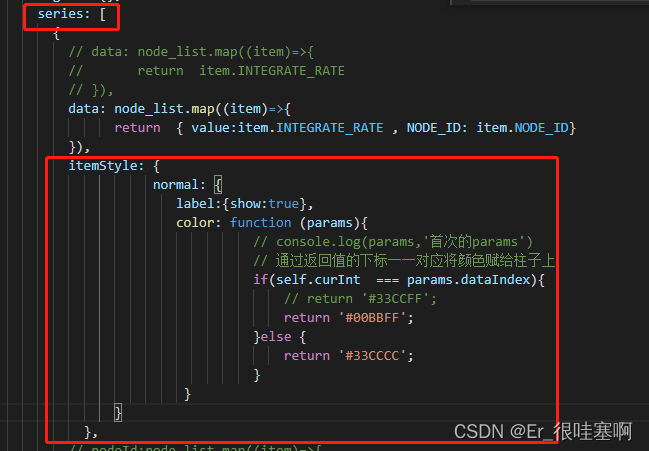
Step 2: Configure itemStyle in the series, as shown below
Step 3: Then add the following to the click event: where self is this
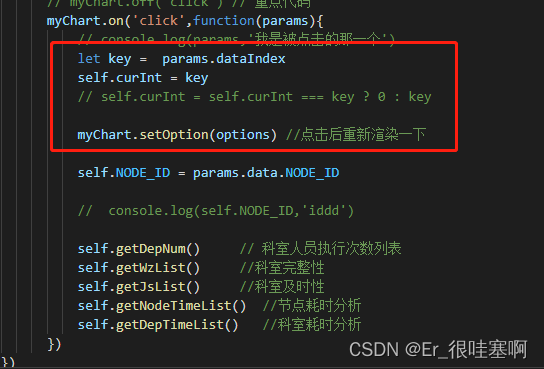
In this way, clicking and highlighting the current histogram can be realized.
Welcome everyone to comment and communicate! Continue to move bricks......