1. Number of variable input and output
The conv() function can calculate the product of two polynomials, and the product of any number of polynomials can be realized by using varargin .
example
code:
clc;clear;
P=[1 2 4 0 5];
Q=[1 2];
F=[1 2 3];

%方法一
D1=convs(P,Q,F)
D1_sym=poly2sym(D1)

%方法二
D2=conv(conv(P,Q),F)
D2_sym=poly2sym(D2)


function a=convs(varargin)
a=1;
for i=1:length(varargin),
    a=conv(a,varargin{i});
end
end
operation result:
D1 = 1 6 19 36 45 44 35 30
D1_sym =x^7 + 6*x^6 + 19*x^5 + 36*x^4 + 45*x^3 + 44*x^2 + 35*x + 30
D2 = 1 6 19 36 45 44 35 30
D2_sym =x^7 + 6*x^6 + 19*x^5 + 36*x^4 + 45*x^3 + 44*x^2 + 35*x + 30
2. Several special functions
2.1 inline function
The file can be omitted, the format is as follows:
fun=inline('函数内容',自变量列表)Example 1
calculate:
untie:
MATLAB code:
f=inline('sin(x.^2+y.^2)','x','y');
f(2,3)
operation result:
ans =0.4202
2.2 Anonymous functions
f=@(x,y)sin(x.^2+y.^2)
%f=@(变量列表)函数内容
2.3 feval function
The feval() function provided by MATLAB is a function used to perform functional operations, so it is called a "function of a function". The format is:
%格式1
[y1,y2,···]=feval(fhandle,x1,···,xn)
y=feval(@sin,2)
%fhandle是函数句柄,函数句柄是一种数据类型,以@引导

%格式2
[y1,y2,···]=feval(function,x1,···,xn)
y=feval('sin',2)
%function是函数名
%x1,x2···,xn是输入参数
%y1,y2···,yn是输出参数
example
clc;clear;
syms t;
f=@(x,y)x^2+y^2;
k1=feval(f,1,t)
k2=f(1,t)
operation result:
k1 =t^2 + 1
k2 =t^2 + 1
3. Draw a two-dimensional image
A known:
Construct vector:
Drawing format:
plot(t,y)The properties of the curve, such as line type, thickness, color, etc., can also be specified using the following commands
plot(t1,y1,选项1,t2,y2,选项2,···,tm,ym,选项m)The common options are summarized as follows:
| Curved | curve color | mark symbol |
| '-' | 'b' | '*' |
| '--' | 'g' | '.' |
| ':' | 'm' | 'x' |
| '-.' | 'w' | 'v' |
| 'none' | 'c' | 'hexagram' |
| 'k' | '>' | |
| 'r' | 'pentagram' | |
| 'y' | 'o' | |
| '^' | 'square' | |
| 'diamond' | ||
| '<' |
Example 2
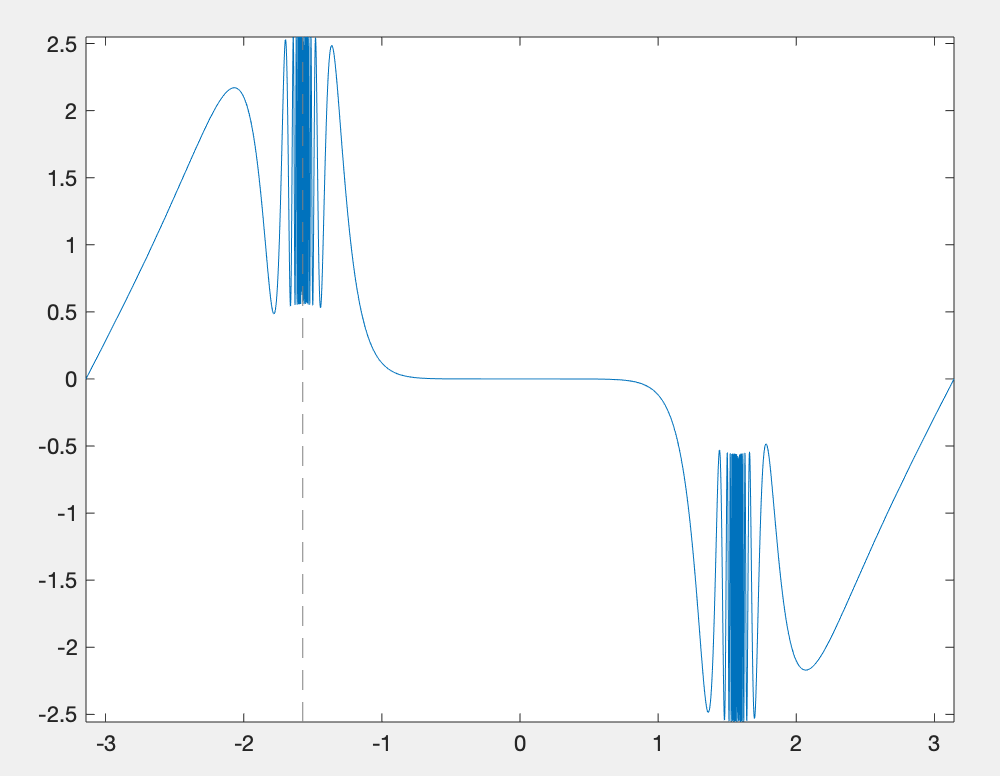
Plot the following functions:
untie:
MATLAB code:
clc;clear;
x=[-pi:0.05:pi]; %以0.05为步距构造自变量向量
y=sin(tan(x))-tan(sin(x)); %求出各个点上的函数值
plot(x,y)
figure,
plot(x,y,'r-.Pentagram') %红色 划线 每个转折点用五角星表示
operation result:


4. Drawing with special commands
The fplot() function dynamically determines the interval of the independent variable through its internal adaptive algorithm , and the calling format is:
fplot(fun,limits,LineSpec)example
fplot(@(x1)sin(tan(x1))-tan(sin(x1)),[-pi,pi])operation result:
The function ezplot can draw implicit functions without data preparation .
Implicit function: the form such as f(x,y)=0 cannot write y=f(x) function
Call format:
ezplot(f)
%f是字符串或代表数学函数的符号表达式
example
code:
ezplot('sin(tan(x))-tan(sin(x))')
operation result:

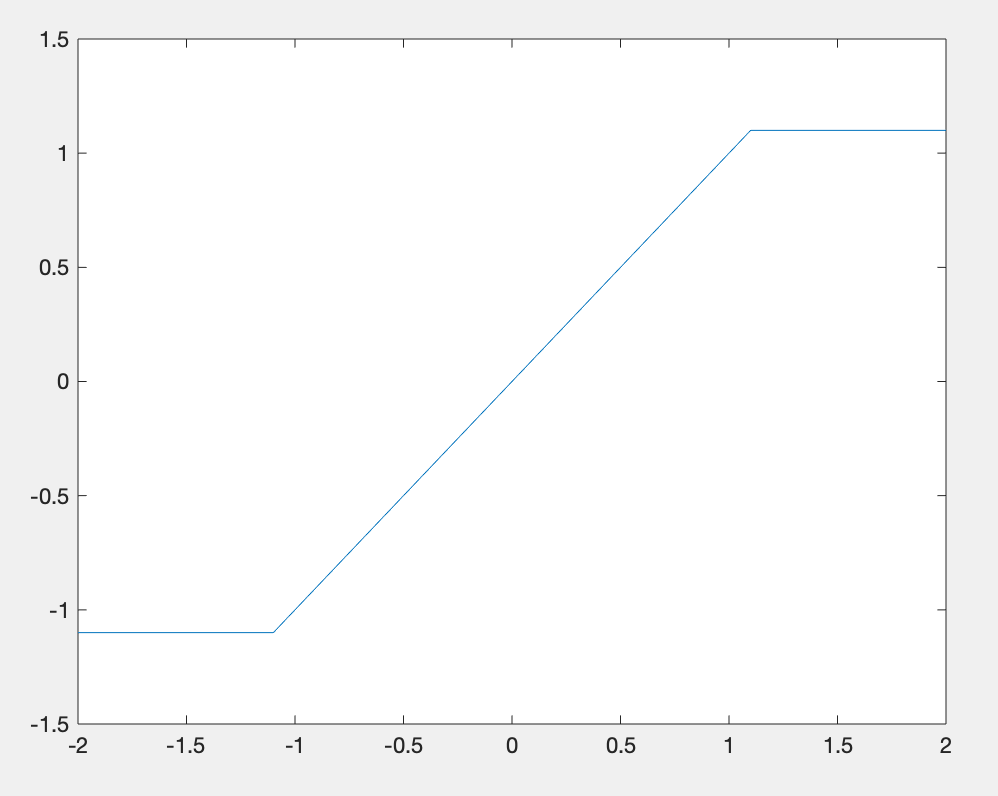
Example 3
Drawing:
untie:
MATLAB code:
clc;clear;
%方法一
x=[-2:0.02:2]; %生成自变量向量
y=1.1*sign(x).*(abs(x)>1.1)+x.*(abs(x)<=1.1);
plot(x,y)
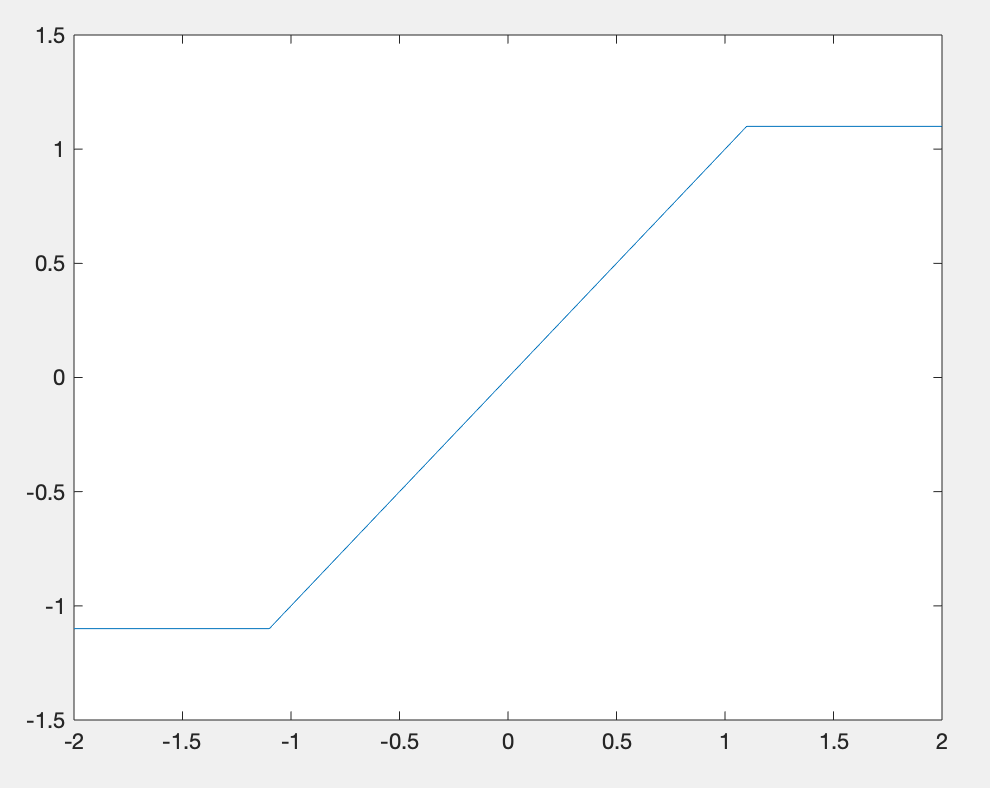
%方法二
figure,
plot([-2,-1.1,1.1,2],[-1.1,-1.1,1.1,1.1])operation result:
5. Acquisition and modification of graphic element properties
In graphics, each curve, coordinate axis, and graphics window is an object. You can use the set() function to set the properties of an object, and use the get function to get a certain property of an object:
set(句柄,'属性名1',属性值1···,'属性名2',属性值2,···)

v=get(句柄,'属性名')
These two statements are useful in interface programming. There is a one-to-one correspondence between the graphic handle and the graphic. Simply speaking, the graphic handle is a variable pointing to the graphic, through which various attributes of the graphic can be set.
The handle is the basis of programming. A handle refers to the use of a unique integer value to identify different objects in the application and different instances of the same object, such as a window, button, icon, scroll bar, output device, control or Files, etc., the application can access the corresponding object information through the handle.