overview
Visibility analysis refers to the terrain analysis that uses a certain point as the observation point to study the visibility of a certain area, and uses DEM to judge whether any two points on the terrain can be seen from each other. It is divided into line-of-sight analysis and sight domain Visibility analysis, the former judges whether any two points can be seen together, and the latter starts from any point to judge the visibility of all other points in the area. Here, I will introduce how to use ArcGIS for visual analysis.
02
Data Sources
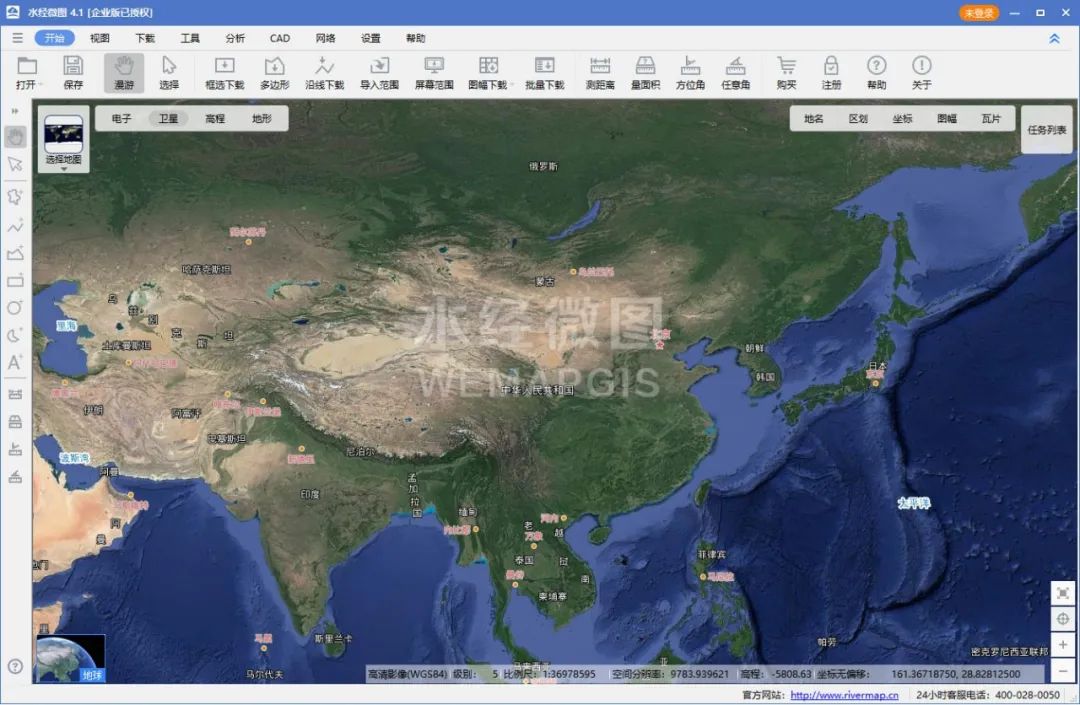
The data used in this tutorial is the DEM data downloaded from the Shuijing micromap. In addition to the DEM data, common GIS data can be downloaded from the Shuijing micromap. You can pay attention to the WeChat public account "Shuijingzhu GIS " , Then reply to "Weitu" in the background to get the software download address, of course, you can also download it directly from the official website of Shuijingzhu GIS.
Micrograph of water classics
03
Draw line of sight to determine visibility
Right-click in the blank area of the menu, and check 3D Analyst, as shown in the figure below.
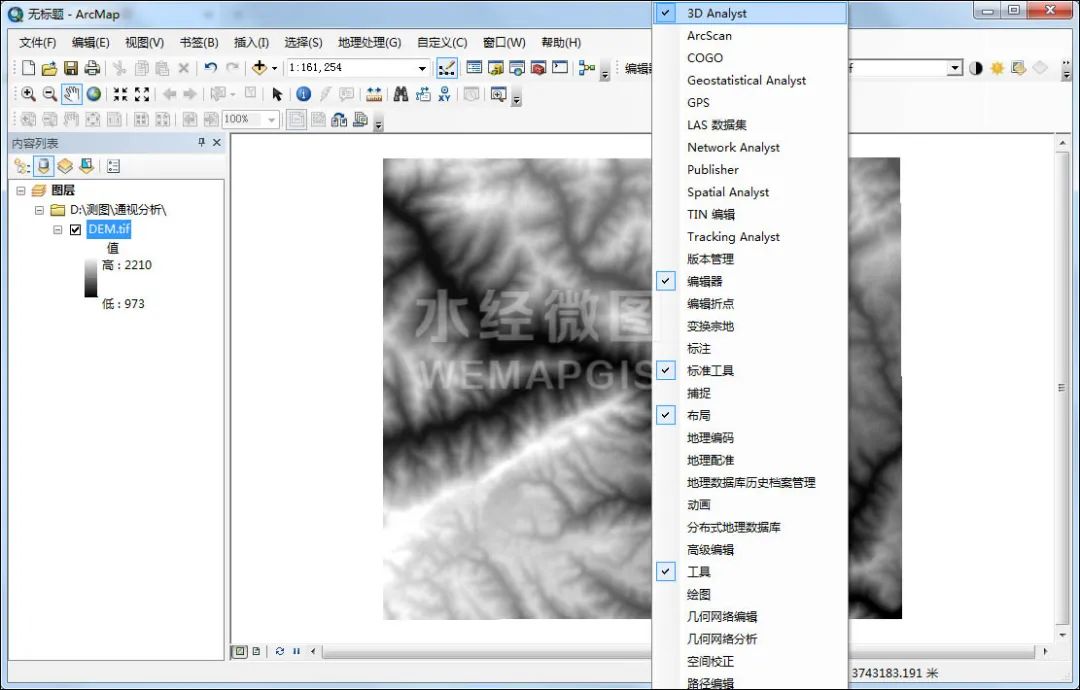
Check 3D Analyst
On the displayed 3D Analyst toolbar, click the Create Line of Sight button to create a line of sight.
![]()
Click the Create Sight button
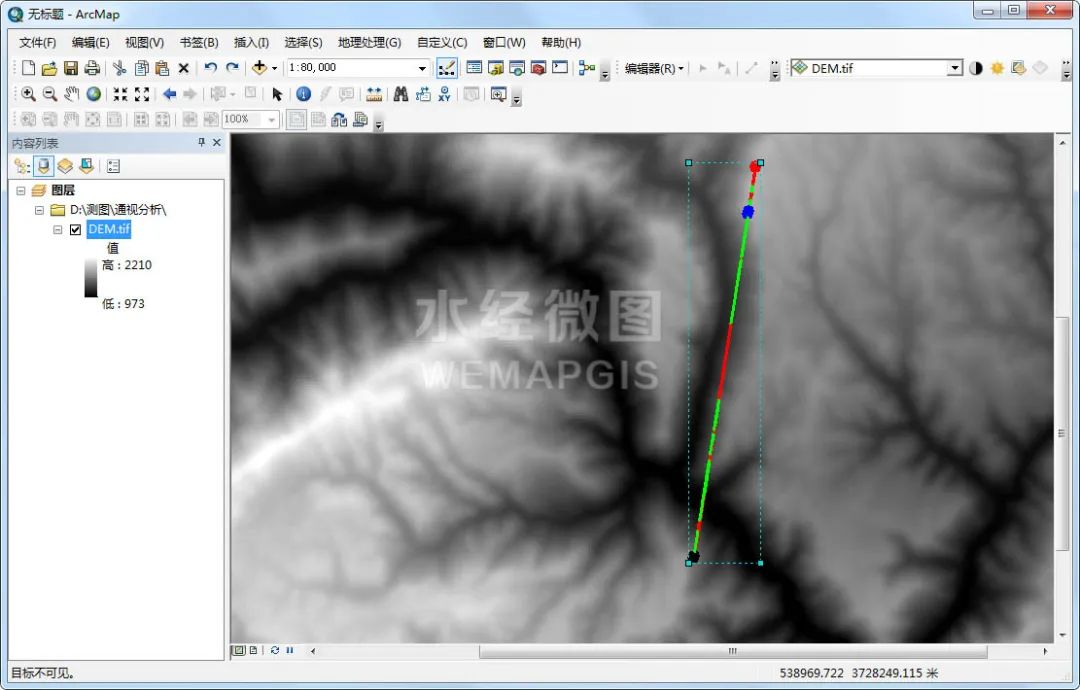
After clicking, draw a line of sight that needs to be analyzed on the map. After drawing, you will get the vision result. Red represents the invisible area, green represents the visible area, and the blue point is the obstacle point.
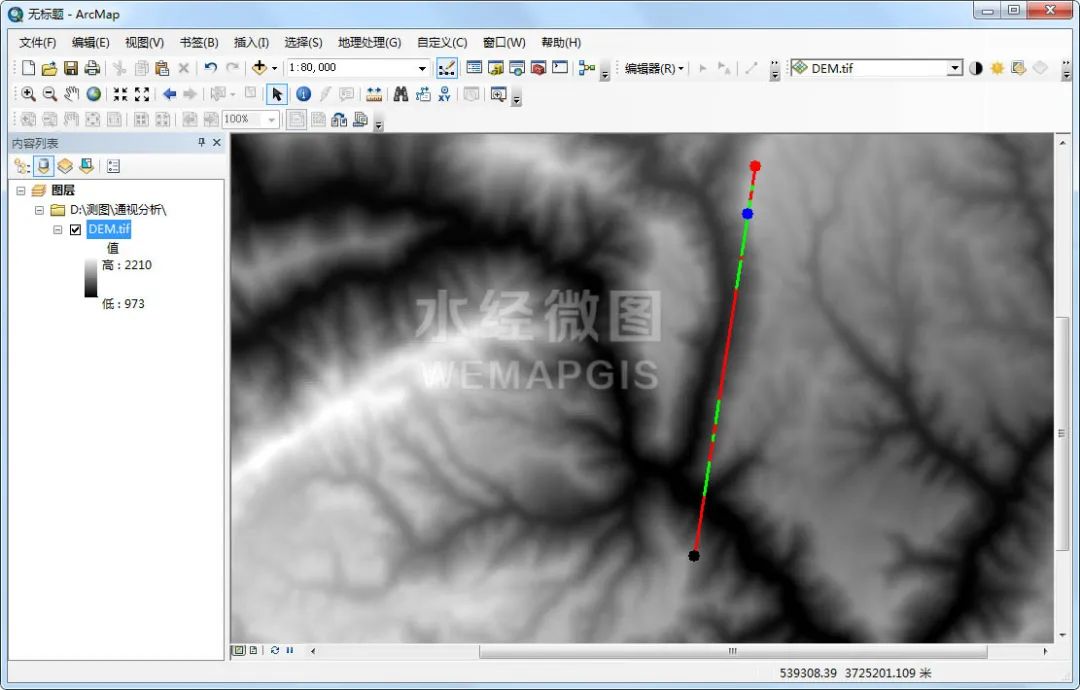
visibility results
04
change viewpoint height
In the line-of-sight analysis dialog box, increase the height of the observation point by 100m, as shown in the figure below.
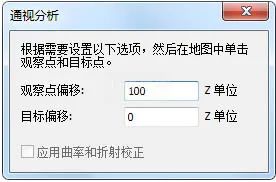
Increase the height of the observation point
Draw the line of sight of the same path again, and you can see that the visible range becomes larger, as shown in the figure below.
Visibility results after changing observer height
05
Single point based viewshed analysis
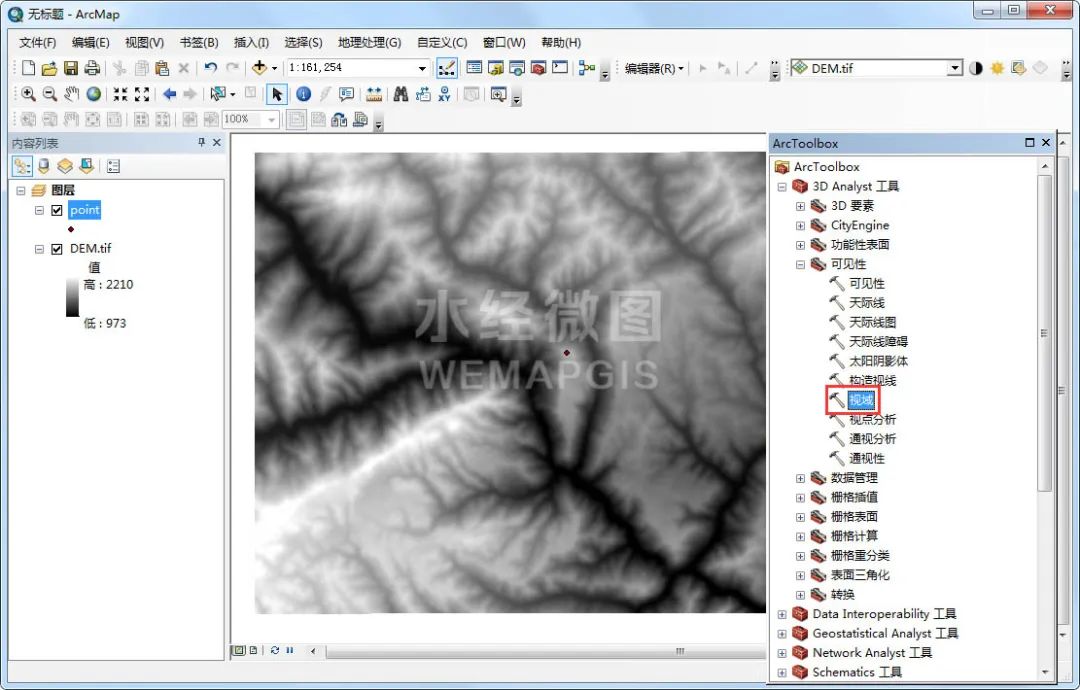
Click "3D Analyst Tools\Visibility\Viewshed" in ArcToolbox to call the viewshed tool.
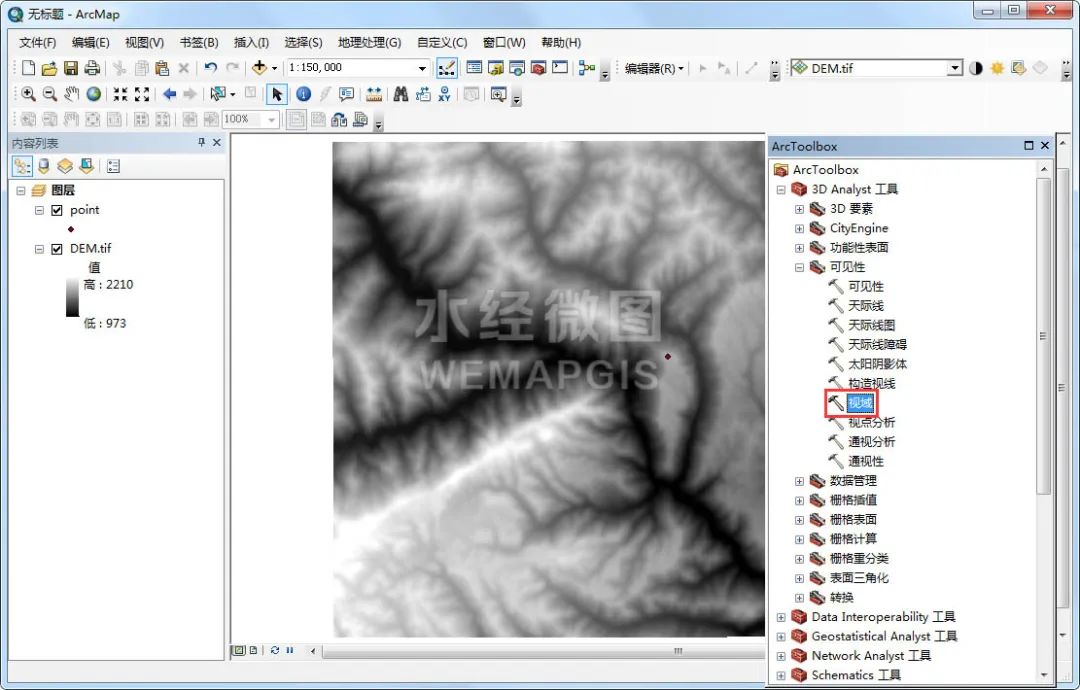
Invoke the viewshed tool
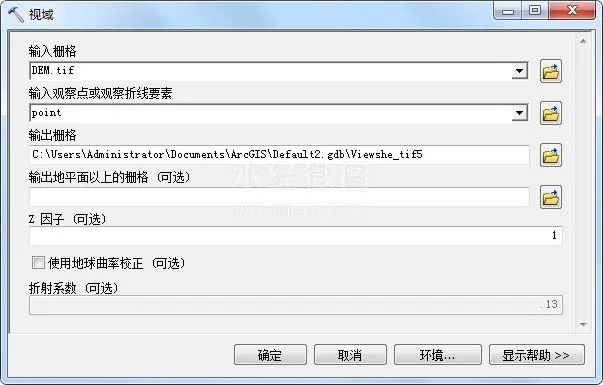
In the displayed Viewshed dialog box, the input grid is the downloaded DEM data, and the input observation point is the prepared viewpoint data.
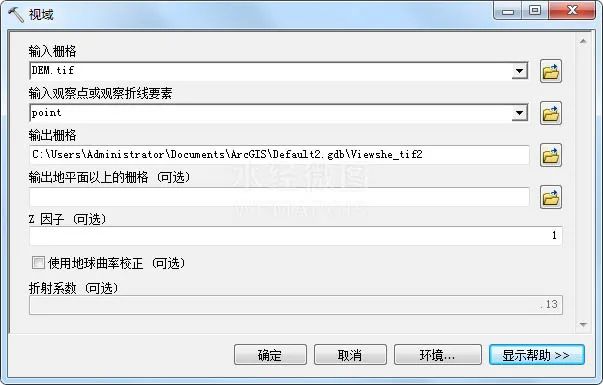
viewshed settings
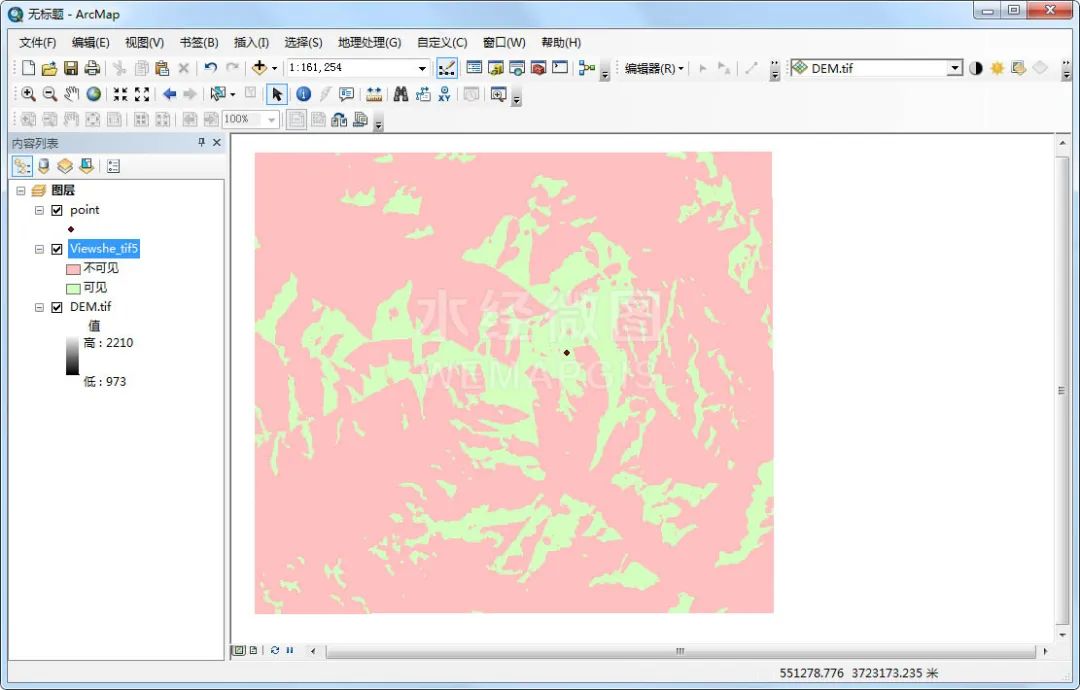
After clicking OK, you can see the field of view of the observation point. Green means visible, and red means invisible, as shown in the figure below.
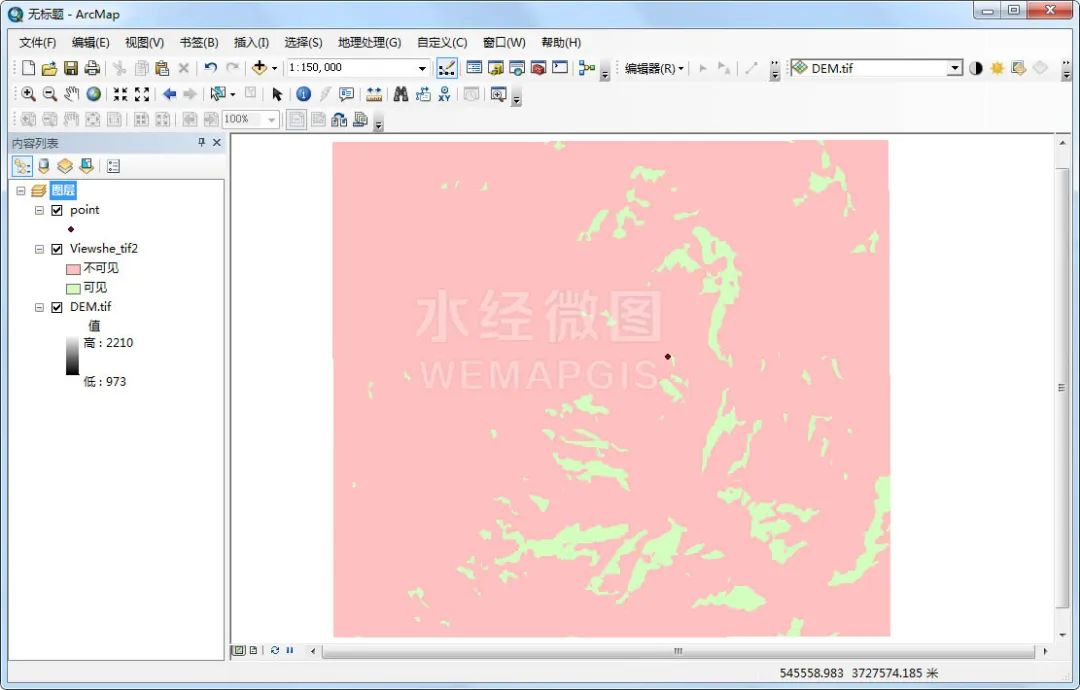
single point of view
06
Changing the height of a single point of view
By default, the DEM height corresponding to the observation point is used for visual domain analysis. If you want to increase the height of the observation point, you can solve it by adding fields to the observation point layer.
Among them, the field name Spot represents the absolute elevation value of the specified observation point; OffisetA represents the elevation of the three-dimensional surface remains unchanged, and the elevation offset value of the observation point is set; OffsetB represents the elevation of the observation point remains unchanged, and the elevation offset value of the three-dimensional surface is set, The field OffsetA is added here, and the value is 100, which means that the height of the observation point is increased by 100m, as shown in the figure below.
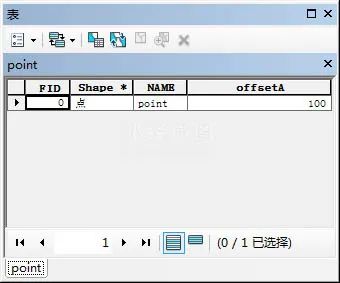
Modified attribute table
Click "3D Analyst Tools\Visibility\Viewshed" in ArcToolbox to call the viewshed tool.
Invoke the viewshed tool
In the viewshed dialog box that appears, the input grid is the downloaded DEM data, and the input observation point is the observation point file after adding fields.
viewshed settings
After clicking OK, the scope of the field of view is significantly wider than before adding fields.
Field of view
07
Path-Based Viewshed Analysis
If you need to analyze the visual domain of a path, you need to convert the path into a 3D Shapefile first, otherwise the analysis result will be wrong.
Click "3D Analyst Tools\Functional Surface\Interpolation Shape" in ArcToolbox to call the interpolation Shape tool.
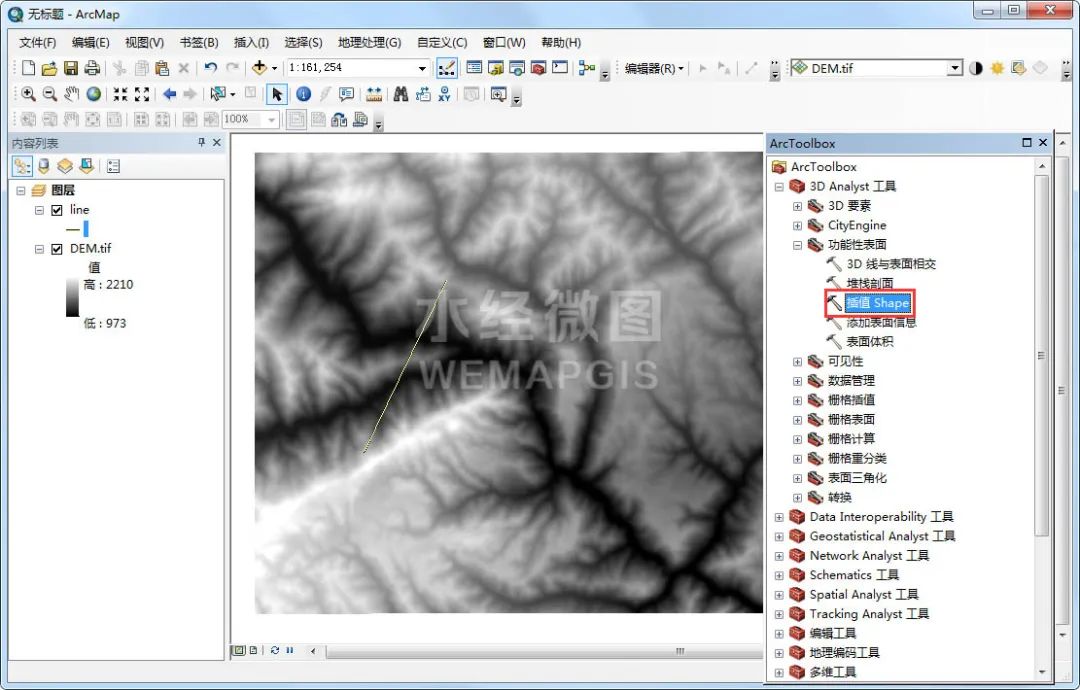
Call the interpolation Shape tool
In the displayed interpolation Shape dialog box, the input surface is the downloaded DEM file, and the input feature class is the line file that needs to be 3D.
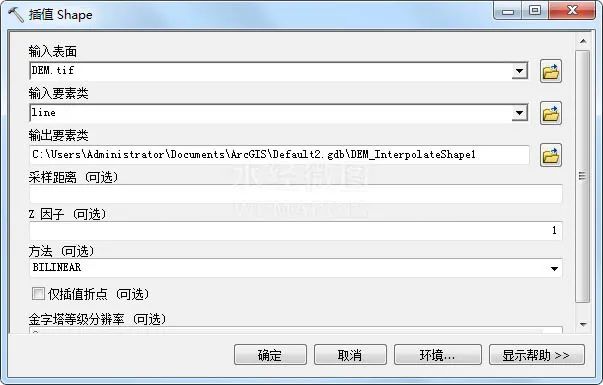
Interpolation Shape Settings
After clicking OK, the 3D line file will be obtained.
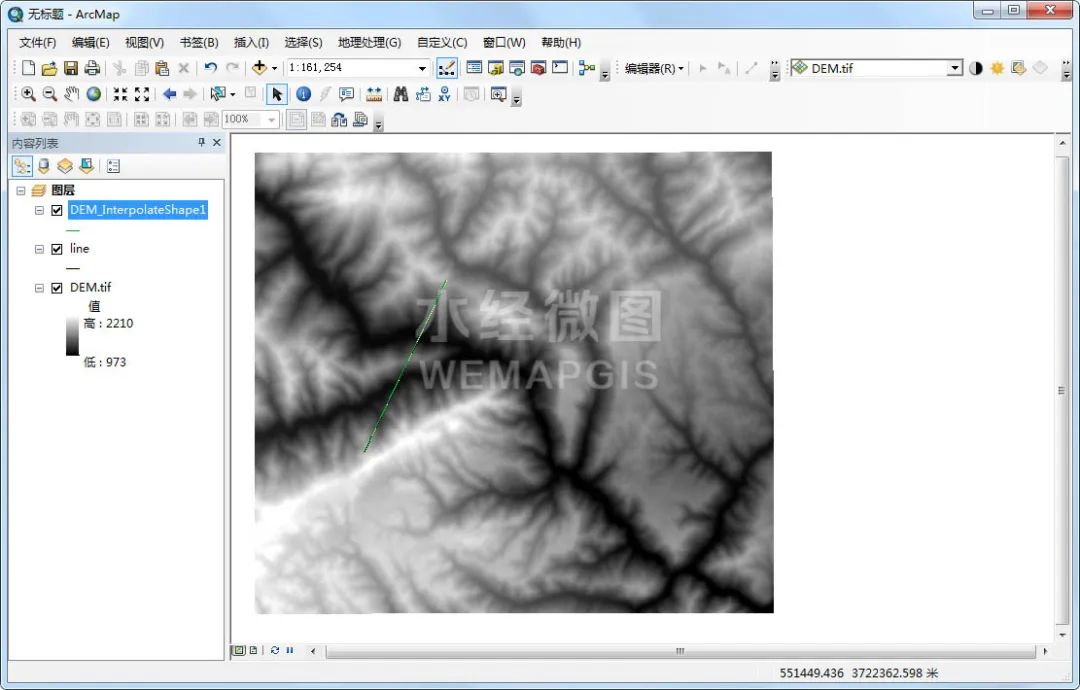
3D line file
Click "3D Analyst Tools\Visibility\Viewshed" in ArcToolbox to call the viewshed tool.
Invoke the viewshed tool
In the displayed viewshed dialog box, the input grid is the downloaded DEM, and the input observation polyline is the 3D route.
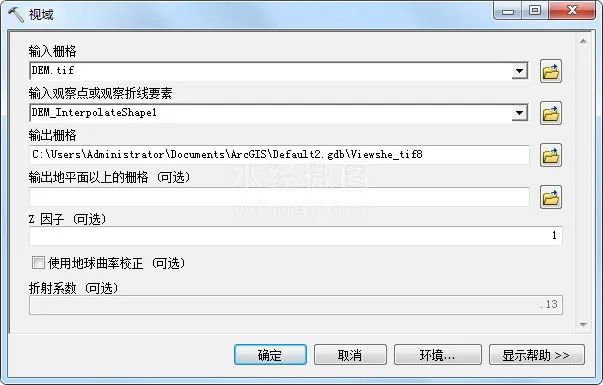
viewshed settings
After clicking OK, you can see the field of view, as shown in the figure below.
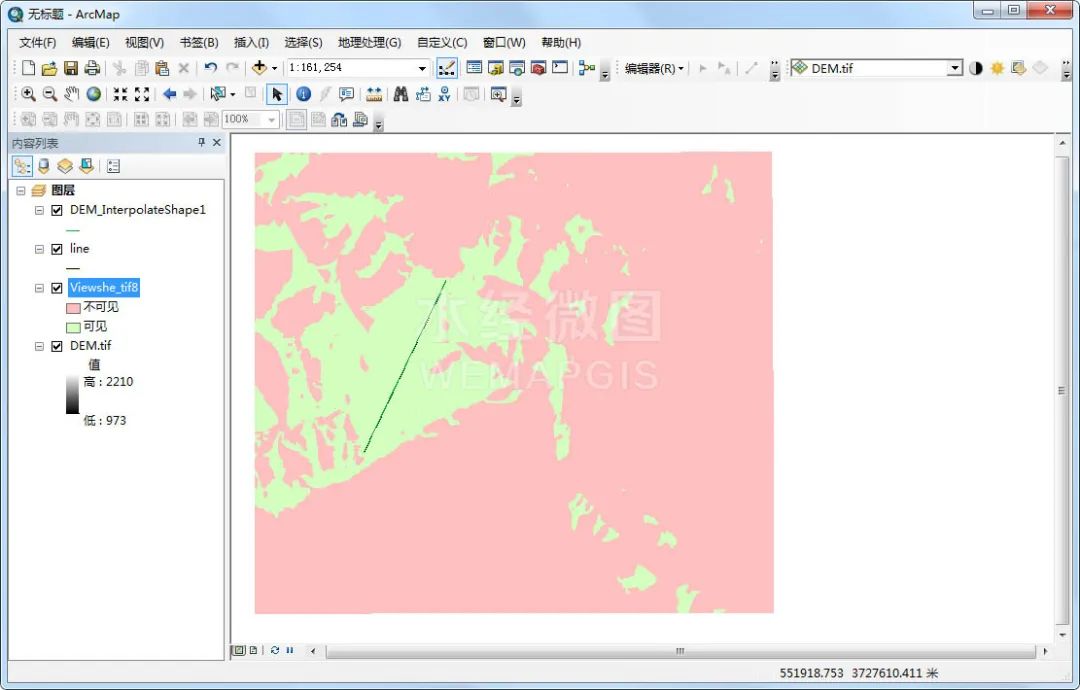
Field of view
Open the attribute table, and you can see that there are two fields, Value and Count, where Value represents the number of times seen, and Count represents the number of grids corresponding to the number of times seen.
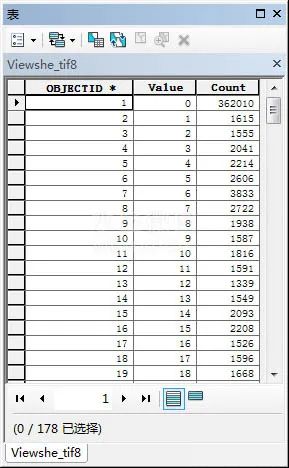
viewport attribute table
08
Visibility Analysis Based on Line Elements
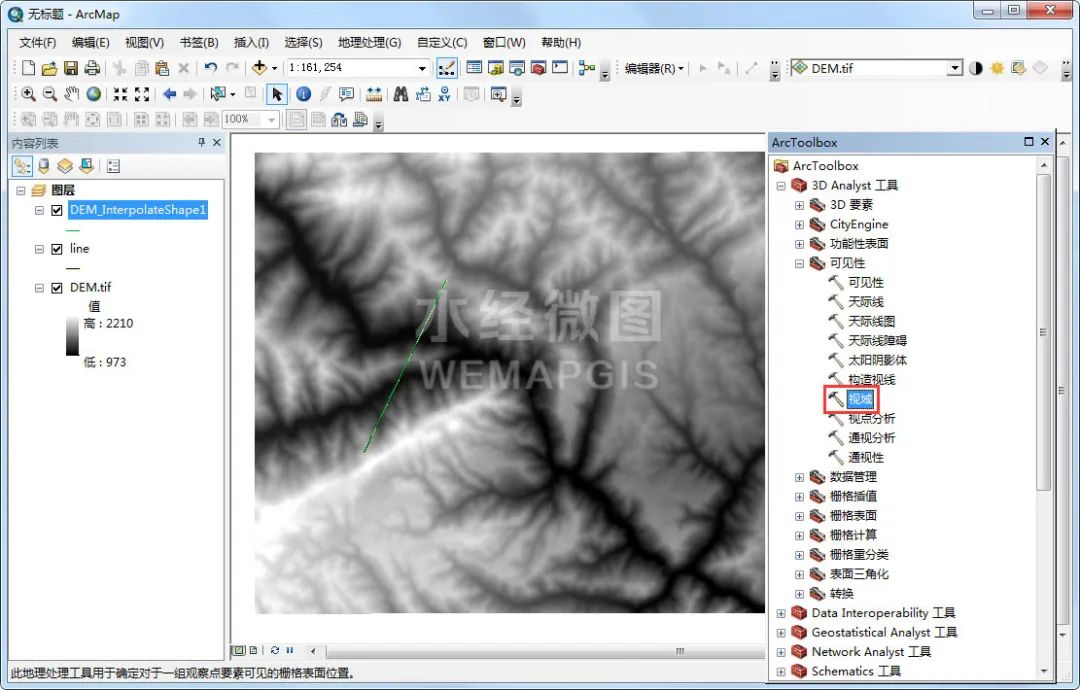
Click "3D Analyst Tools\Visibility\Visual Analysis" in ArcToolbox to call the visual analysis tool.

Invoke line-of-sight analysis tools
In the display dialog box of line-of-sight analysis, the input surface is the downloaded DEM data, and the input line element is the 3D line obtained before.
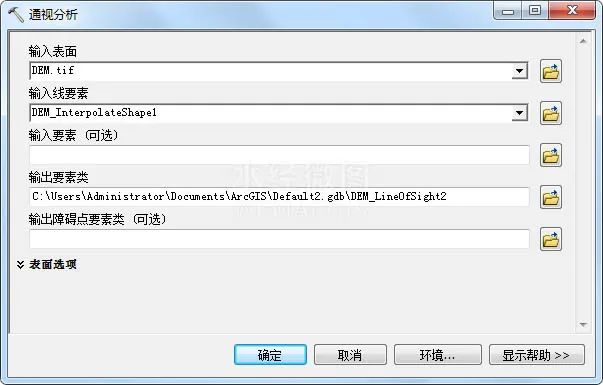
Line-of-sight analysis settings
After clicking OK, you can get the results of the line-of-sight analysis, green means visible, red means invisible.
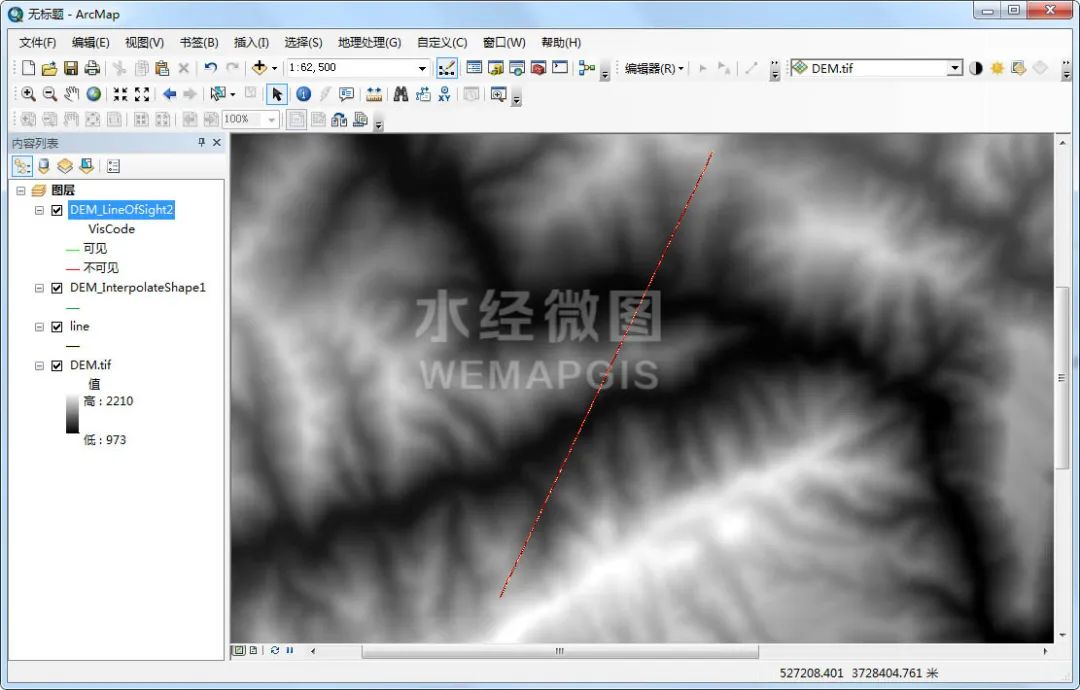
Visibility Analysis Results
09
epilogue
The above is a detailed description of how to use ArcGIS for visual analysis, mainly including data sources, drawing line of sight to determine visibility, changing viewpoint height, single-point-based visual domain analysis, changing single-point viewpoint height, and path-based visual domain Analysis and visibility analysis based on line features.
More free tutorials, resources, and data: Tree Valley Database (updated on August 16, 2023)