Large data visualization screens have become a hot demand recently. Ever since Lao Li posted a message about large visual screens in Moments, customers, relatives, friends, and classmates have all come to ask me how to make such large visual screens. Yes, how much will it cost?
Lao Li was also very honest. He told them directly that it was free, and everyone gave me question marks, saying that I was lying, but it made me very angry! But Lao Li has a good temper, explained to them well, and shared with them the tools and templates he used for free.
This tool and template was originally researched by Lao Li for 3 months, and after experiencing almost all large-screen visualization tools on the market, he picked out the most suitable one, which is FineVis. The operation of this tool is very simple. Novice Xiaobai doesn’t have to worry at all. Just drag and drop the mouse to create a large screen that can blind the boss’s eyes. Lao Li also organized 40+ large screen templates, covering all walks of life. You need It's all here!
Not much to say, just start with the coolest dynamic effects on the big screen, and show you how cool the visual big screen with dynamic effects is. Don’t miss these dynamic effects. The tools and templates are all Put it at the end, and send it all for free.
1. Chart carousel
scenes to be used:
Chart carousel is a built-in function in Fanruan charts. Its function is to display two or more charts in the same area in rotation. There is a certain relationship between the charts or they together form a small theme module.

2. Tab page rotation
scenes to be used:
The tab page carousel can rotate multiple components or a combination of components, not limited to carousel charts. The tab rotation can be automatic or manually click on the tab to switch. The use of tab page carousel can make the information displayed on the large screen richer, and at the same time, it will not make the content of the large screen appear disorganized.

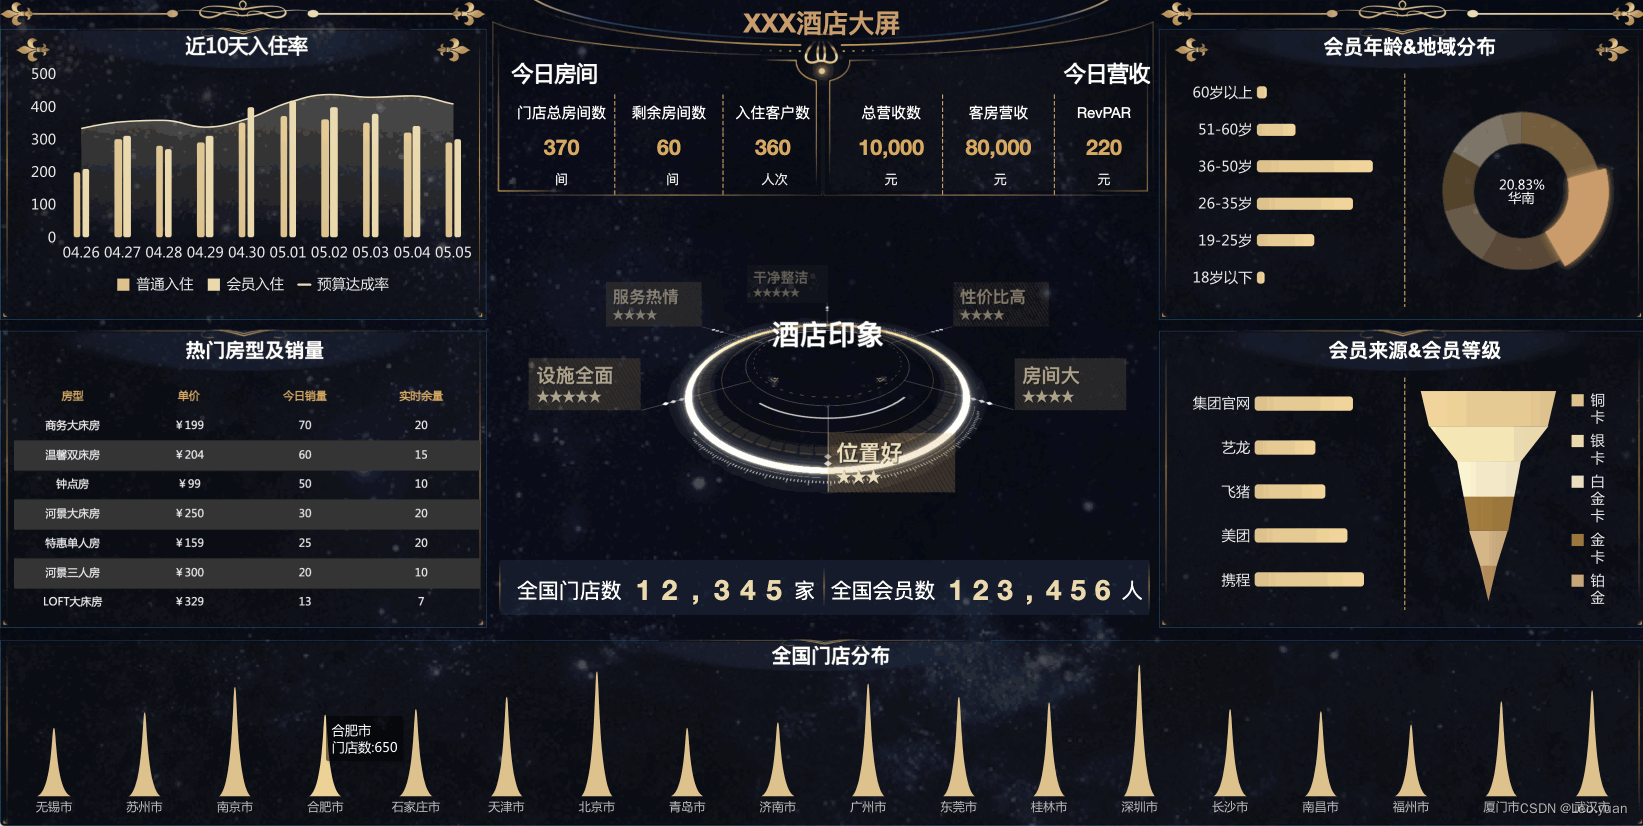
3. The tab block realizes the template carousel
scenes to be used:
Template carousels are also a common requirement on large screens. Taking the large screen in the cockpit as an example, leaders may need to view more than one aspect of data on the TV in the conference room. They must pay attention to store operation data and sales payment data. When a large screen cannot arrange so many data indicators, you can usually create multiple large screens and display them with a carousel effect.
4. Chart data prompt point carousel
scenes to be used:
In order to make the large-screen visual design beautiful and tidy, we usually hide a large number of chart labels, but we want the chart information to be displayed comprehensively. At this time, we can use the chart data prompt point carousel method to rotate the specific details of each series in the chart. value.
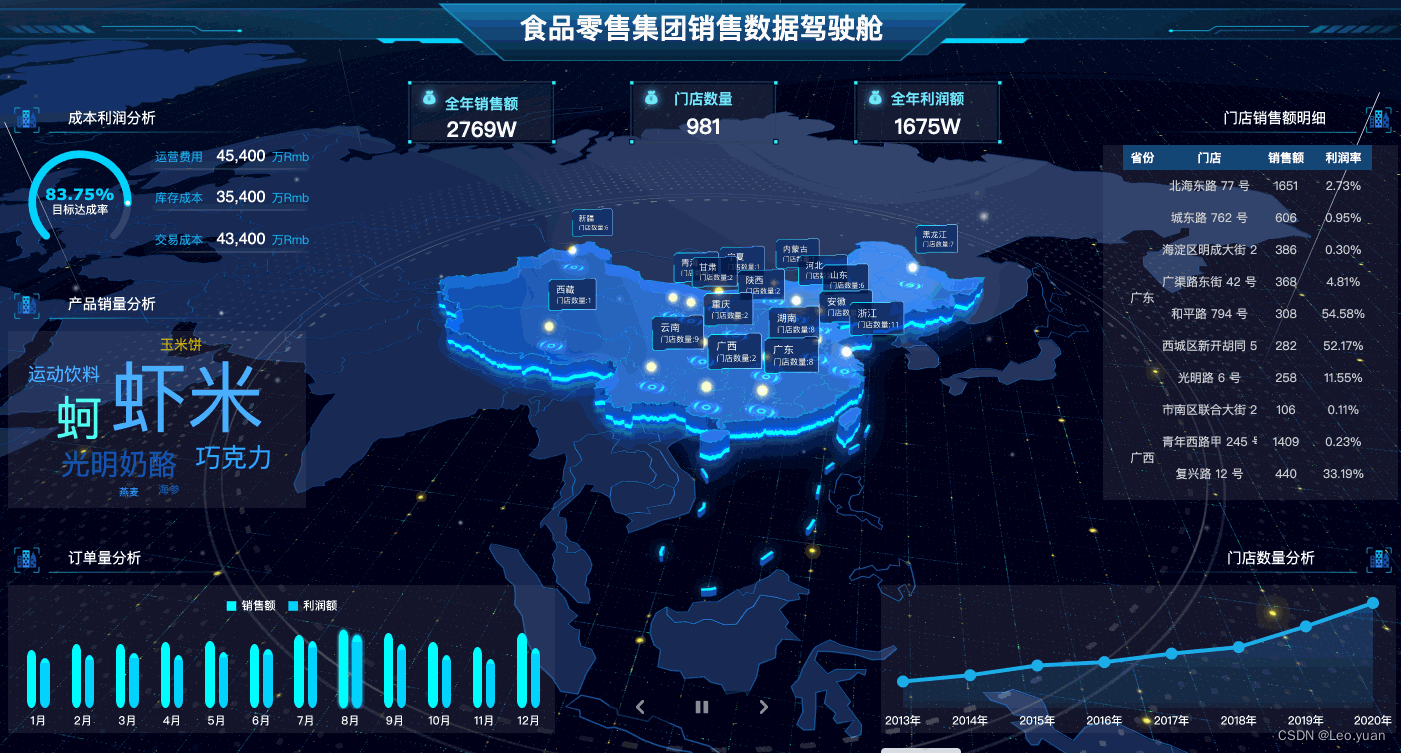
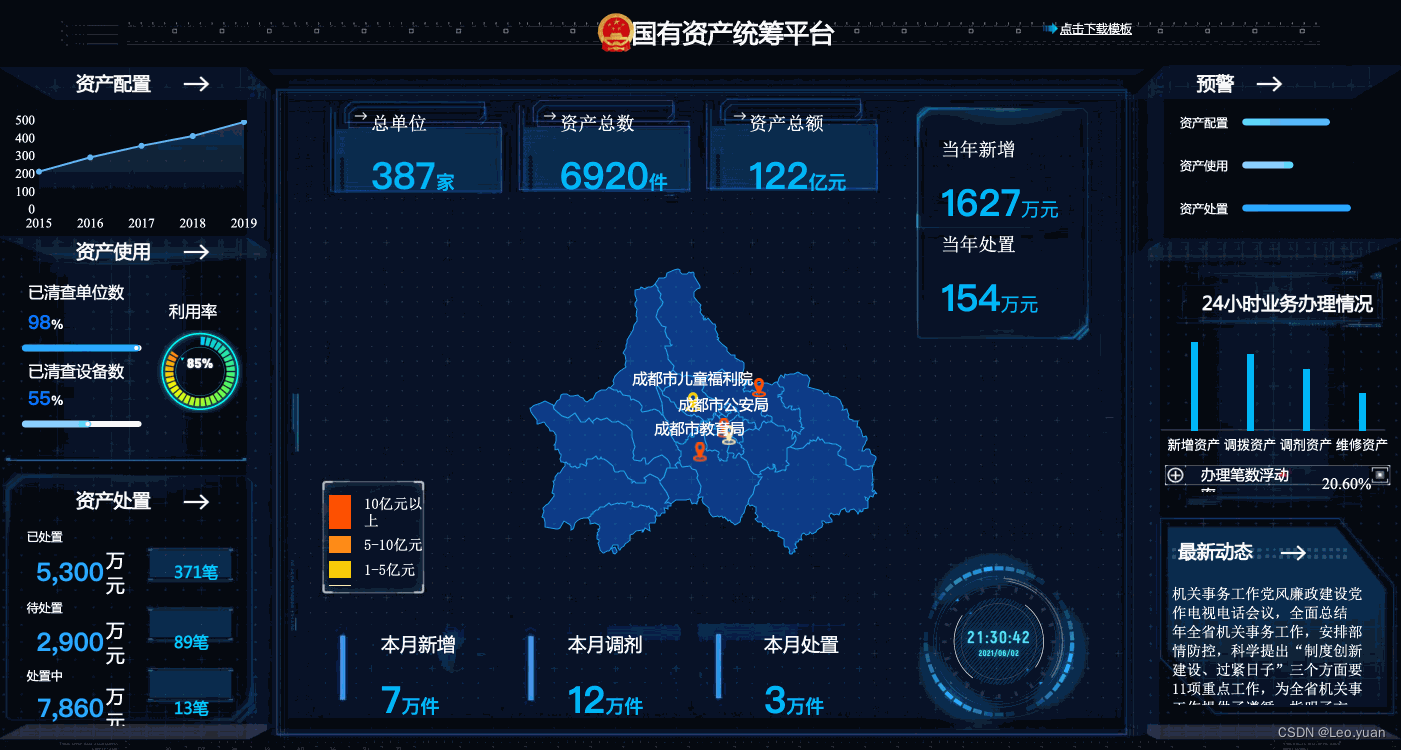
5. Map data prompt point carousel
scenes to be used:
When there are dense areas and data labels on the map, it is not appropriate to display all data points, but not displaying specific data at all will miss a lot of information. At this time, the map data point carousel prompt is a good function application.
6. Table marquee effect
scenes to be used:
Tables are common elements on large screens, but the area ratio of tables on large screens should not be too large, so when the table information cannot be fully displayed, table scrolling effects can be applied (3 forms are like marquees).
7. Rolling messages
scenes to be used:
Scrolling messages are used to display one or more message texts. The text data is static and does not need to be monitored, analyzed, etc., but it also needs to attract the attention of the viewer. Displaying in the form of scrolling does not require too much space and can attract attention through dynamic effects.
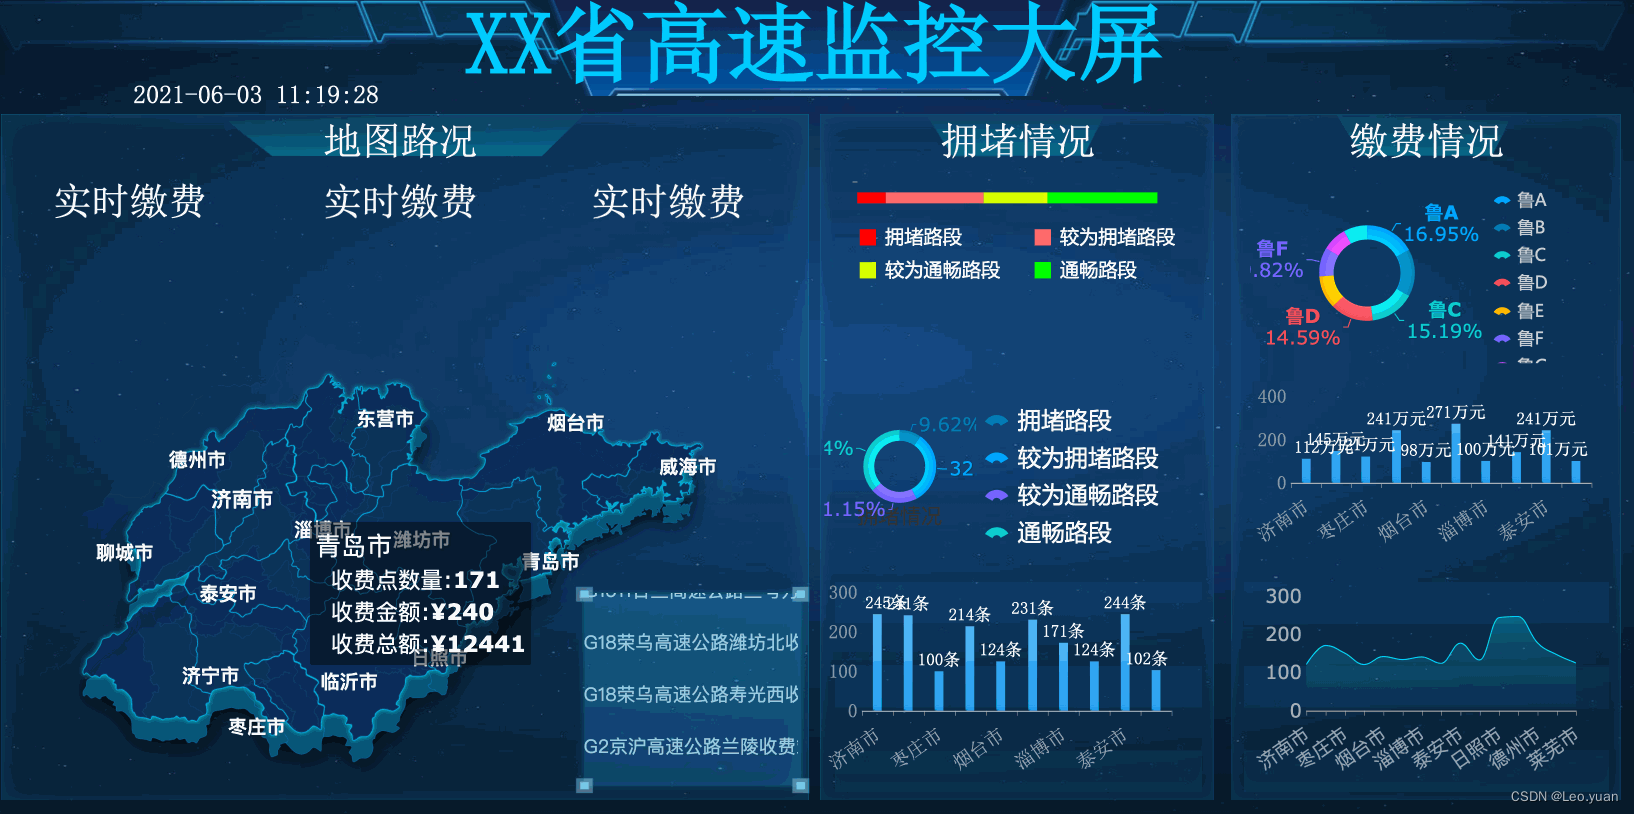
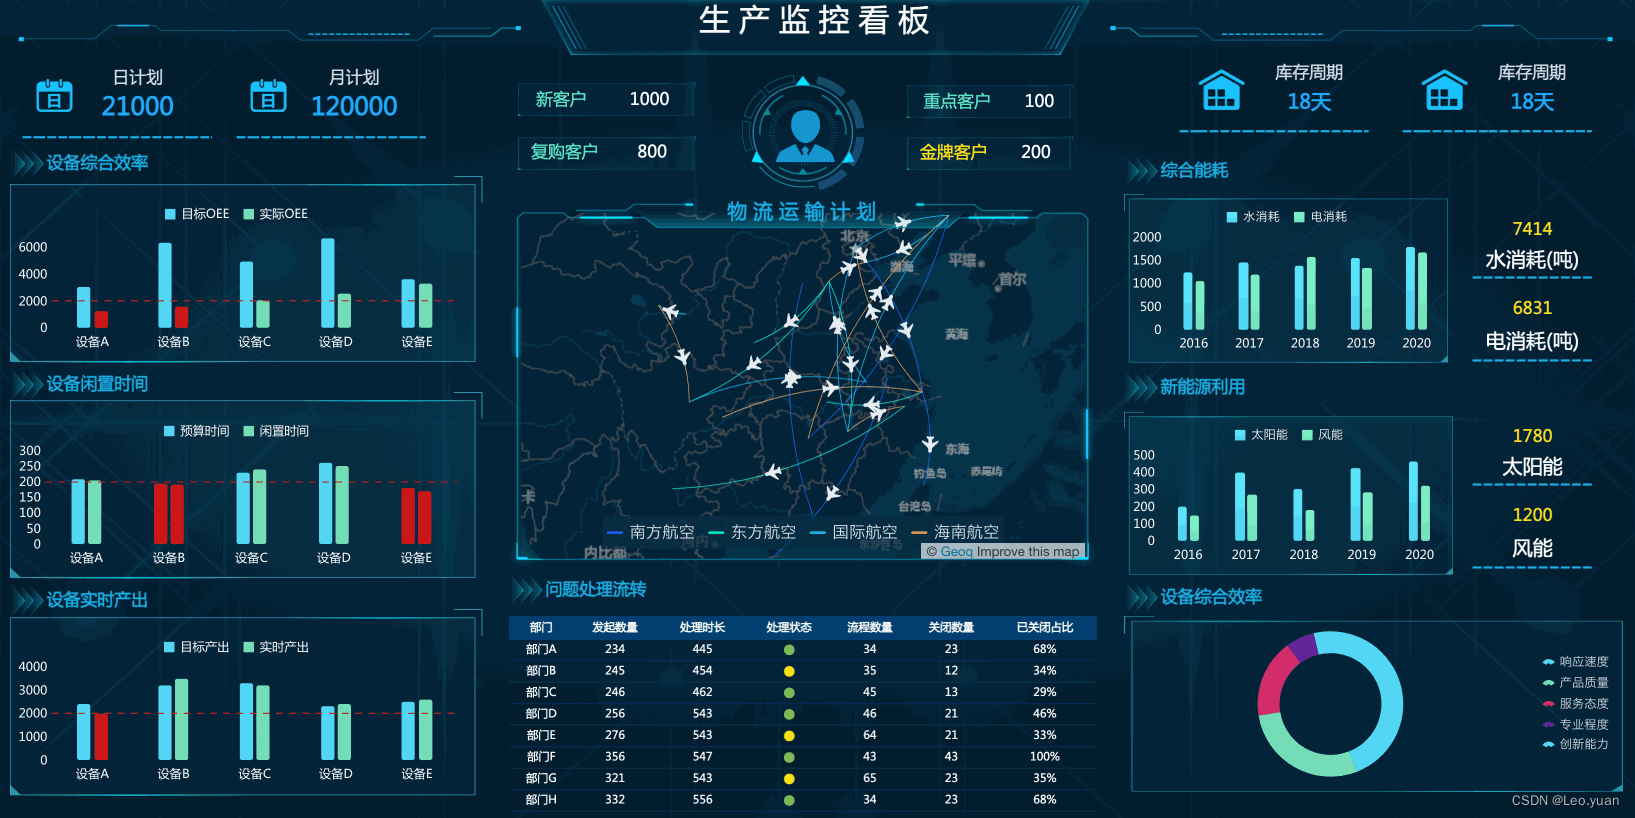
8. Chart flashing animation
scenes to be used:
The chart flickering animation is used to highlight the abnormal data series in the chart or the data series that need special attention. The effect of flickering + warning color is used to make the graph more prominent. It is a common effect in monitoring Kanban.
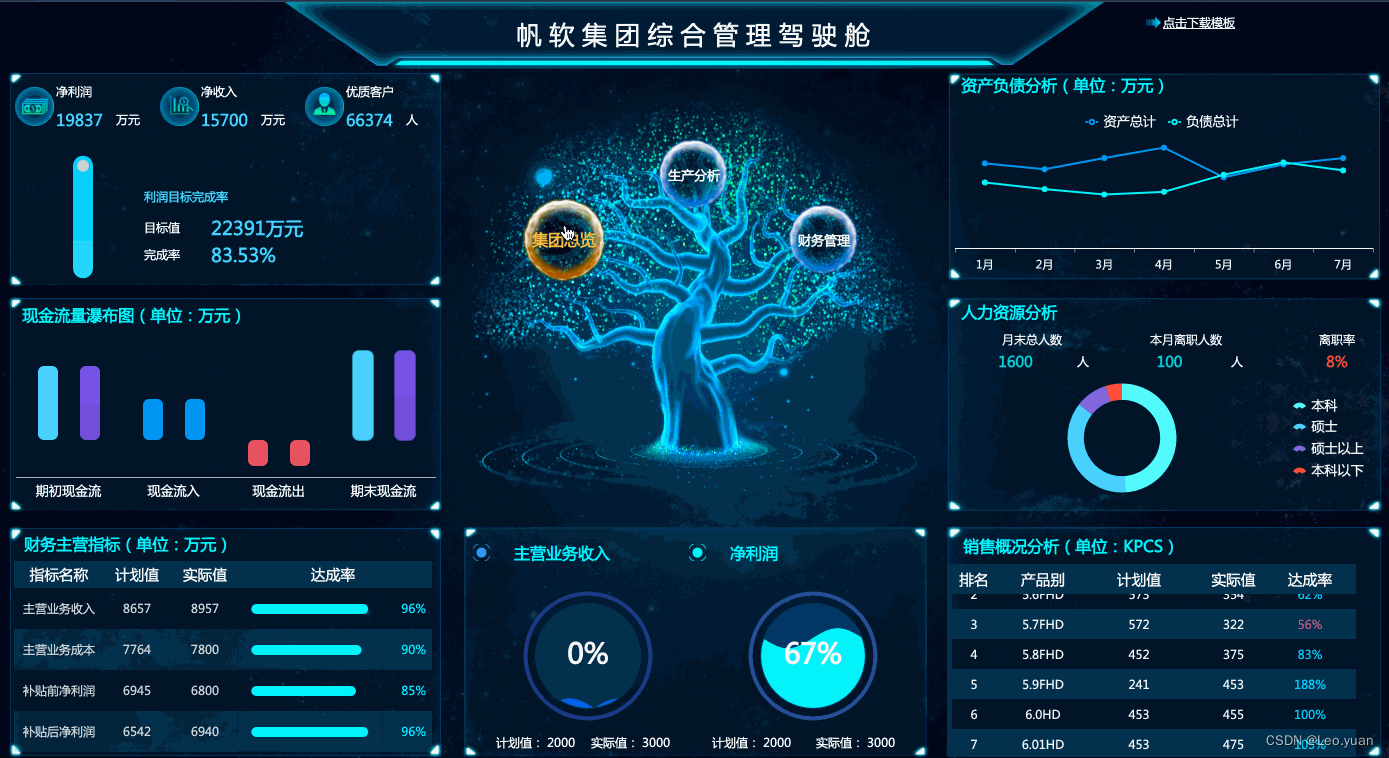
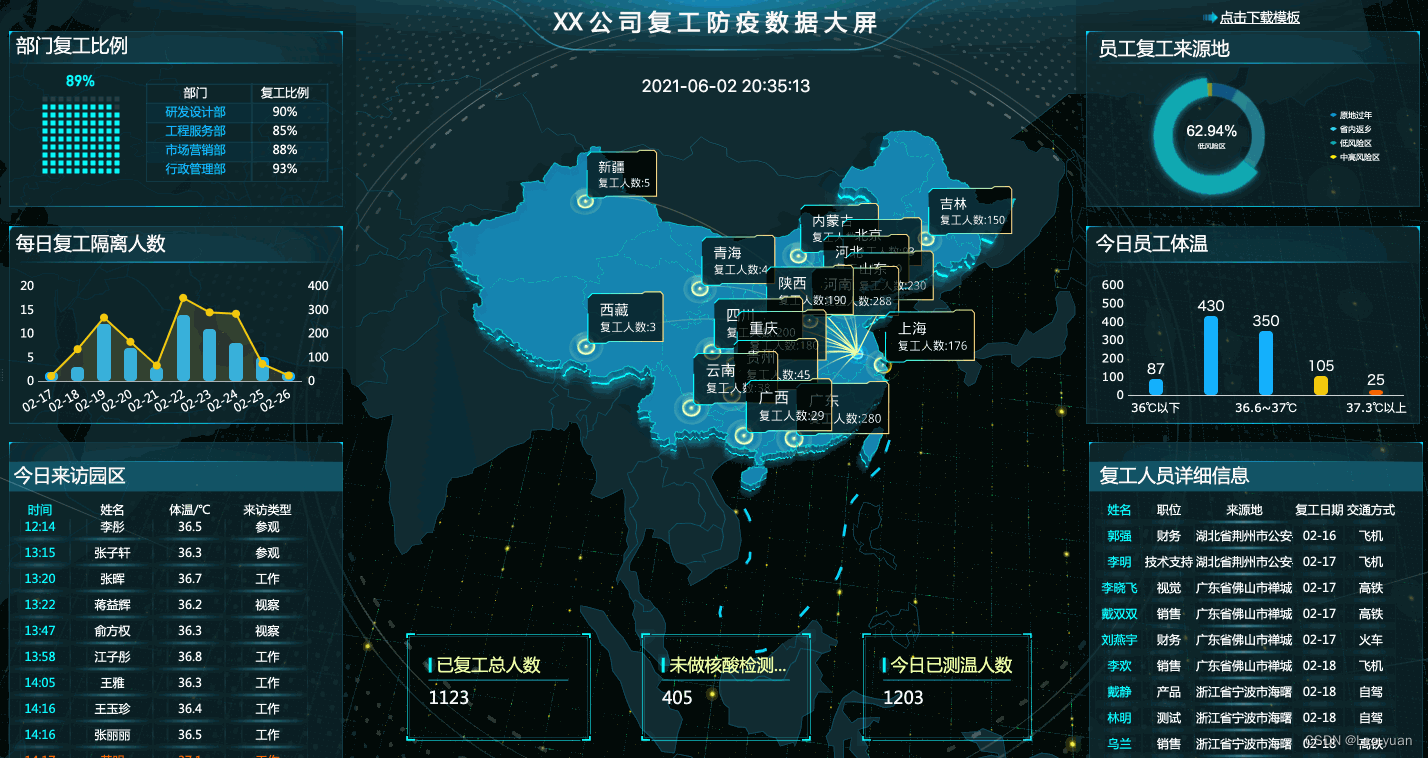
9. Text conditional color change
scenes to be used:
The color change of the text condition is mainly used for real-time monitoring of some data of special concern. Such conditions can be set for the data in the table and the value in the indicator card.
Don't miss this free tool and template , which will directly increase your competitiveness in the workplace by 99%. Promotion and salary increase are small cases! Reply to **"template"** via private message to get it!