Table of contents
1.2 The value of the lines.marker parameter
1.rc parameter setting
In order to make the drawn graphics look better when using matplotlib to draw, you need to set the rc parameter settings for the parameters. You can view the rc parameters of matplotlib through the following code.
import matplotlib as plt
print(plt.rc_params())
Commonly used rc parameters are as follows:
- lines.linewidth: line width
- lines.linestyle: line style
- lines.marker: the shape of the points on the lines
- lines.markersize: the size of the points
1.1 lines.linestype value
- "-":solid line
- "--": long dashed line
- "-.":Dotted line
- ":": short dash
1.2 The value of the lines.marker parameter
| marker value | significance |
| ‘o’ | the circle |
| 'D' | diamond |
| 'H' | hexagon |
| '-' | horizontal line |
| '8' | Octagon |
| 'p' | pentagon |
| '+' | plus |
| '.' | point |
| 's' | square |
| 'd' | small rhombus |
| ' * ' | Asterisk |
1.3 Drawing Chinese preset
plt.rcParams['font.family']=['SimHei']
plt.rcParams['axes.unicode_minus']=False
1.4 Examples
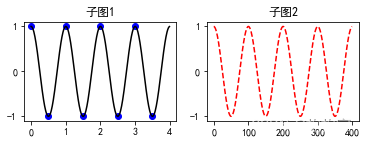
1.4.1 Example 1
import matplotlib.pyplot as plt
import numpy as np
fig ,axes = plt.subplots()
#配置中文显示
plt.rcParams['font.family'] = ['SimHei']
plt.rcParams['axes.unicode_minus'] = False
def f(t):
    return np.cos(2*np.pi*t)
x1 = np.arange(0.0,4.0,0.5)
x2 = np.arange(0.0,4.0,0.01)
plt.figure(1)
plt.subplot(2,2,1)
plt.plot(x1,f(x1),'bo',x2,f(x2),'k')
plt.title('子图1')
plt.subplot(2,2,2)
plt.plot(np.cos(2*np.pi*x2),'r--')
plt.title('子图2')
plt.show()
result:
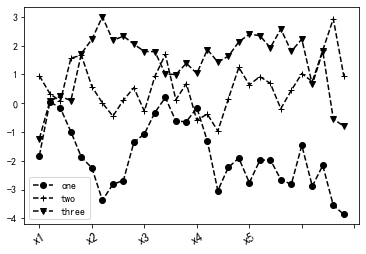
1.4.2 Example 2
fig = plt.figure()
ax = fig.add_subplot(1,1,1)
ax.plot(np.random.randn(30).cumsum(),color = 'k',linestyle = 'dashed',marker = 'o',label = 'one')
ax.plot(np.random.randn(30).cumsum(),color = 'k',linestyle = 'dashed',marker = '+',label = 'two')
ax.plot(np.random.randn(30).cumsum(),color = 'k',linestyle = 'dashed',marker = 'v',label = 'three')
ax.set_xticklabels(['x0','x1','x2','x3','x4','x5'],rotation = 30,fontsize = 'large')
ax.legend(loc = 'best')
result: