Article directory
foreword
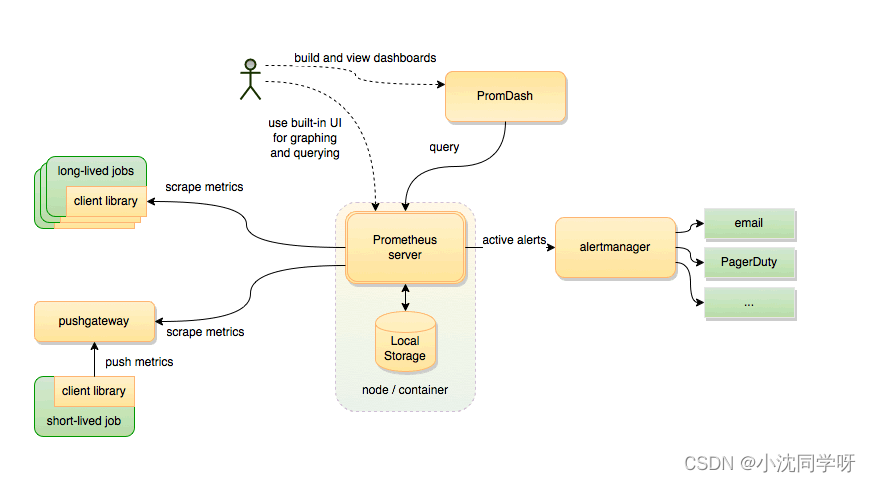
I believe everyone knows that the delivery of a project to production does not mean the end, but more about the operation and maintenance monitoring of online services. Operation and maintenance monitoring mainly involves the resource status of the deployment server, the resource status of each sub-service, garbage collection and throughput, etc., as well as fault alarms and other functions. Of course, as a brick mover, you also need to understand the full-link operation and maintenance monitoring component Prometheus.
knowledge accumulation
What is Prometheus
Prometheus is an open source service monitoring system and time series database.
Features:
High-dimensional data model
Custom query language
Visual data display
Efficient storage strategy
Easy operation and maintenance
Provide various client development libraries
Warning and alarm
Data export
What is Grafana
Grafana is a cross-platform open source measurement analysis and visualization tool, which is mainly used to query and visualize the collected data.
Grafana provides a wealth of visual presentation methods, including fast and flexible client-side charts, panel plug-ins with different visualization indicators and logs, and rich dashboard plug-ins, including heat maps, line charts, charts, etc.
Grafana can help users quickly view and edit the front end of the dashboard. It supports connecting multiple data sources at the same time, and can convert time-series spatio-temporal database (TSDB) data into beautiful charts.
How to complete data collection and monitoring
The main parameter information of Linux is collected through node-exporter, and the Springboot microservice project provides actuator monitoring configuration. The Prometheus server actively pulls the server data collected by the exporter to display the main memory and cpu parameters, and actively calls the actuator interface to pull various operating parameters for display.
In order to meet the various visualization chart requirements of operation and maintenance personnel, we then access the Grafana measurement platform and visual analysis tools. Its various plug-ins and dashboard templates can maximize the quality of monitoring operation and maintenance.
Environment build
For the construction of the Prometheus+Grafana environment, we use docker containerization for deployment management.
Considering that we can change configurations such as alarms and monitored items at will, we mount the main configurations of Grafana and Prometheus outside the container.
文件树:
[root@localhost app]# tree
.
├── docker-compose-prometheus.yaml
├── grafana
│ ├── data
│ │ └── grafana
│ └── grafana.ini
└── prometheus
├── app.json
└── prometheus.yml
docker and docker-compose installation
#安装docker社区版
yum install docker-ce
#版本查看
docker version
#docker-compose插件安装
curl -L https://github.com/docker/compose/releases/download/1.21.2/docker-compose-`uname -s`-`uname -m` -o /usr/local/bin/docker-compose
#可执行权限
chmod +x /usr/local/bin/docker-compose
#版本查看
docker-compose version
docker-compose compose
[root@localhost app]# pwd
/app
[root@localhost app]#
1. Create a Prometheus configuration file
Possible Reference httpspro://metheus.io/docs/prometheus/latest/getting_started
[root@localhost app]# mkdir prometheus
[root@localhost app]# vim prometheus/app.json
[
    {
        "targets": [
            "10.10.18.16:8888"
        ],
        "labels": {
            "instance": "demo",
            "service": "demo-service"
        }
    }
]
[root@localhost app]# vim prometheus/prometheus.yml
global:
  scrape_interval: 10s
  scrape_timeout: 10s
  evaluation_interval: 10m

scrape_configs:
  - job_name: spring-boot # springboot项目
    scrape_interval: 5s
    scrape_timeout: 5s
    metrics_path: /actuator/prometheus
    scheme: http
    file_sd_configs:
      - files:
          - ./*.json
        refresh_interval: 1m

  - job_name: prometheus   # prometheus
    static_configs:
      - targets: ['prometheus:9090']
        labels:
          instance: prometheus


  - job_name: linux  # 采集node exporter监控数据,即linux
    static_configs:
      - targets: ['node-exporter:9100']
        labels:
          instance: localhost
2. Create a Grafana configuration file
[root@localhost app]# mkdir -p ./grafana/data/grafana
[root@localhost app]# chmod -R 777 ./grafana/
Grafana configuration file download:
https://github.com/grafana/grafana/blob/main/conf/sample.ini
Rename the downloaded configuration file to grafana.ini and place it under the newly created folder.
Modify the database configuration:
[root@localhost app]# vim grafana.ini
#################################### Database ############################
[database]
# You can configure the database connection by specifying type, host, name, user and password
# as separate properties or as on string using the url property.

# Either "mysql", "postgres" or "sqlite3", it's your choice
type = mysql
host = 10.10.10.202:6456
name = grafana
user = root
# If the password contains # or ; you have to wrap it with triple quotes. Ex """#password;"""
passw0ord =MyNewPass2021
# Use either URL or the previous fields to configure the database
# Example: mysql://user:secret@host:port/database
url =mysql://root:[email protected]:6456/grafana


# Max idle conn setting default is 2
max_idle_conn = 2

# Max conn setting default is 0 (mean not set)
max_open_conn =100

# Connection Max Lifetime default is 14400 (means 14400 seconds or 4 hours)
conn_max_lifetime = 14400
# Set to true to log the sql calls and execution times.
log_queries =

# For "postgres", use either "disable", "require" or "verify-full"
# For "mysql", use either "true", "false", or "skip-verify".
ssl_mode = disable

# Database drivers may support different transaction isolation levels.
# Currently, only "mysql" driver supports isolation levels.
# If the value is empty - driver's default isolation level is applied.
# For "mysql" use "READ-UNCOMMITTED", "READ-COMMITTED", "REPEATABLE-READ" or "SERIALIZABLE".
isolation_level =

ca_cert_path =
client_key_path =
client_cert_path =
server_cert_name =

# For "sqlite3" only, path relative to data_path setting
path = grafana.db

# For "sqlite3" only. cache mode setting used for connecting to the database
cache_mode = private

# For "sqlite3" only. Enable/disable Write-Ahead Logging, https://sqlite.org/wal.html. Default is false.
wal = false

# For "mysql" only if migrationLocking feature toggle is set. How many seconds to wait before failing to lock the database for the migrations, default is 0.
locking_attempt_timeout_sec = 0

# For "sqlite" only. How many times to retry query in case of database is locked failures. Default is 0 (disabled).
query_retries = 0

# For "sqlite" only. How many times to retry transaction in case of database is locked failures. Default is 5.
transaction_retries = 5

# Set to true to add metrics and tracing for database queries.
instrument_queries = false
#################################### SMTP / Emailing #####################
[smtp]
enabled = false
host = localhost:25
user =
# If the password contains # or ; you have to wrap it with triple quotes. Ex """#password;"""
password =
cert_file =
key_file =
skip_verify = false
from_address = [email protected]
from_name = Grafana
ehlo_identity =
startTLS_policy =

[emails]
welcome_email_on_sign_up = false
templates_pattern = emails/*.html
content_types = text/html
3、docker-compose
[root@localhost app]# vim docker-compose-prometheus.yaml
version: "3"
networks: # 网桥
  prometheus:
    ipam:
      driver: default
      config:
        - subnet: "172.22.0.0/24"

services:
  prometheus: # prometheus
    image: registry.cn-hangzhou.aliyuncs.com/senfel/prometheus:v2.34.0
    container_name: prometheus
    restart: unless-stopped
    volumes:
      - ./prometheus/app.json:/etc/prometheus/app.json
      - ./prometheus/prometheus.yml:/etc/prometheus/prometheus.yml
    command: "--config.file=/etc/prometheus/prometheus.yml --storage.tsdb.path=/prometheus"
    ports:
      - "9090:9090"
    depends_on:
      - node-exporter
    networks:
      prometheus:
        ipv4_address: 172.22.0.11

  node-exporter:  # 采集服务器层面的运行指标
    image: registry.cn-hangzhou.aliyuncs.com/senfel/node-exporter:v1.3.1
    container_name: prometheus-node-exporter
    restart: unless-stopped
    volumes:
      - /proc:/host/proc"
      - /sys:/host/sys"
    ports:
      - "9100:9100"
    networks:
      prometheus:
        ipv4_address: 172.22.0.22

  grafana:  # 用于UI展示
    image: registry.cn-hangzhou.aliyuncs.com/senfel/grafana:8.0.0
    container_name: prometheus-grafana
    restart: unless-stopped
    ports:
      - "3000:3000"
    volumes:
      - ./grafana/data/grafana:/var/lib/grafana
      - /etc/localtime:/etc/localtime
      - ./grafana/plugins:/var/lib/grafana/plugins
      - ./grafana/grafana.ini:/etc/grafana/grafana.ini
    environment:
      GF_EXPLORE_ENABLED: "true"
      GF_SECURITY_ADMIN_PASSWORD: "admin"
      GF_INSTALL_PLUGINS: "grafana-clock-panel,grafana-simple-json-datasource,alexanderzobnin-zabbix-app"
    depends_on:
      - prometheus
    networks:
      prometheus:
        ipv4_address: 172.22.0.33
4. Deploy the Prometheus+Grafana+Exporter container
[root@localhost app]# docker-compose -f docker-compose-prometheus.yaml up -d
prometheus-node-exporter is up-to-date
Recreating prometheus … done
Recreating prometheus-grafana … done
[root@localhost app]# docker ps
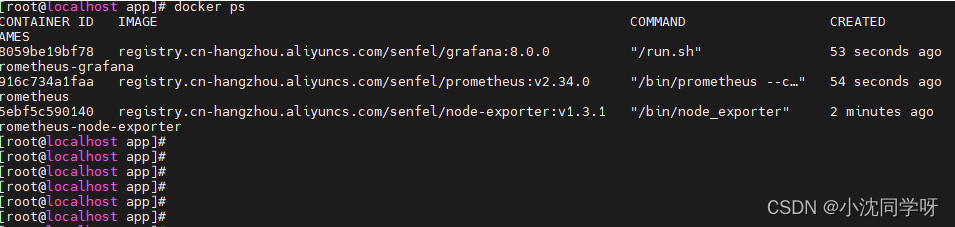
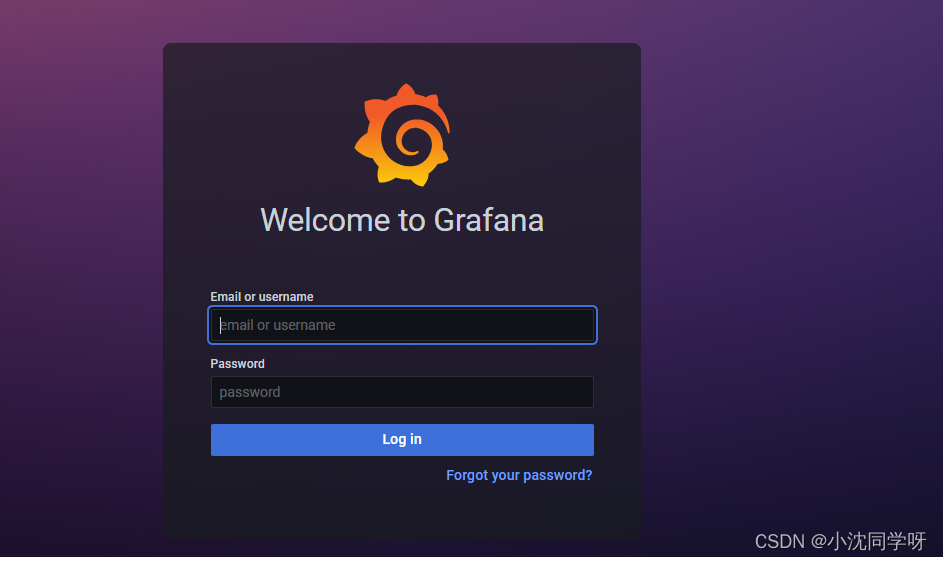
Browser access http://10.10.22.91:3000/login
monitoring configuration
Grafana configures prometheus data source
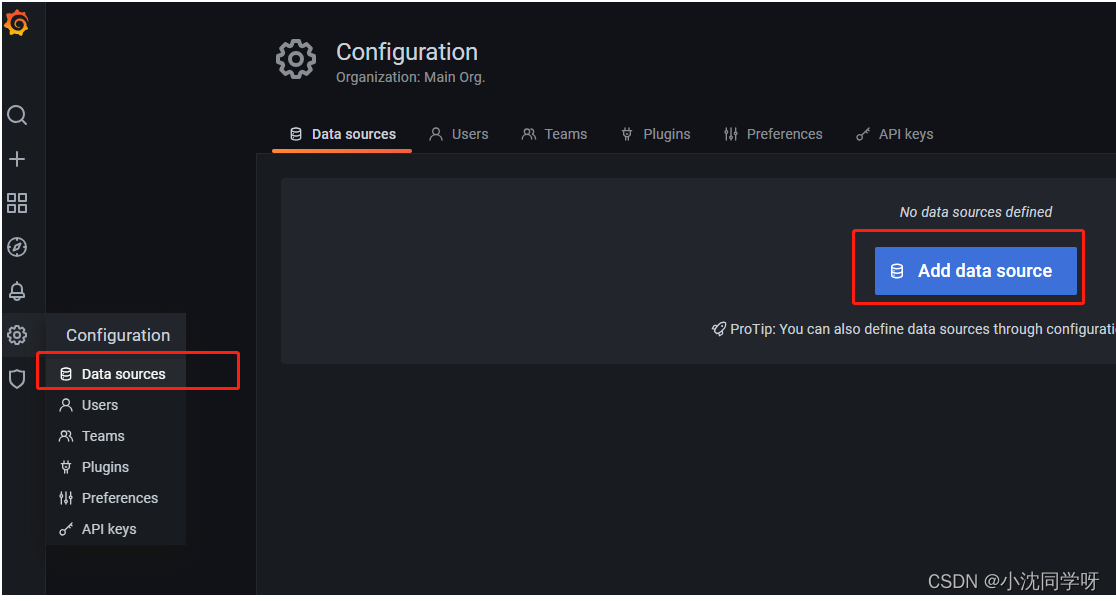
1. Click Settings-data source to add a data source
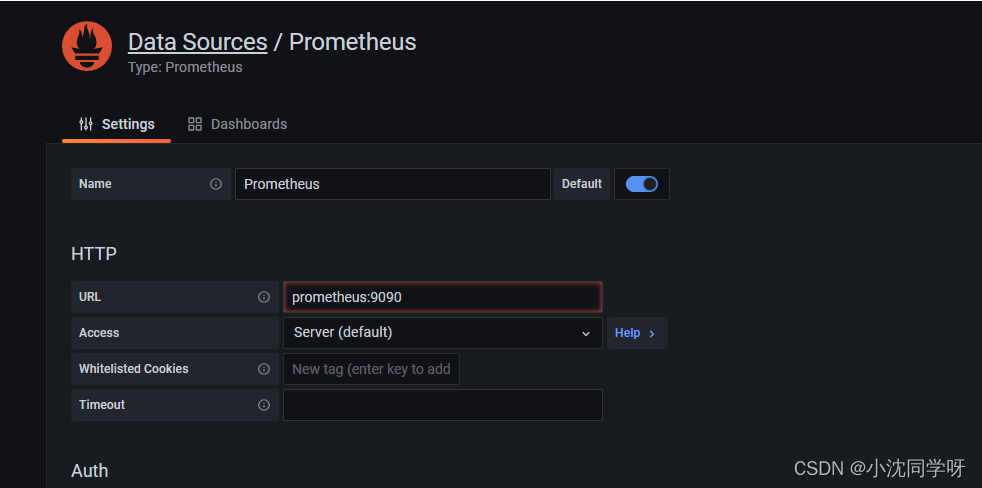
2. Select prometheus and configure the path
Grafana configuration dashboard
Spring Boot 2.1 Statistics:https://grafana.com/grafana/dashboards/10280
JVM (Micrometer):https://grafana.com/grafana/dashboards/4701
Linux Hosts Metrics: https://grafana.com/grafana/dashboards/10180-kds-linux-hosts/
Linux Host Metrics monitoring
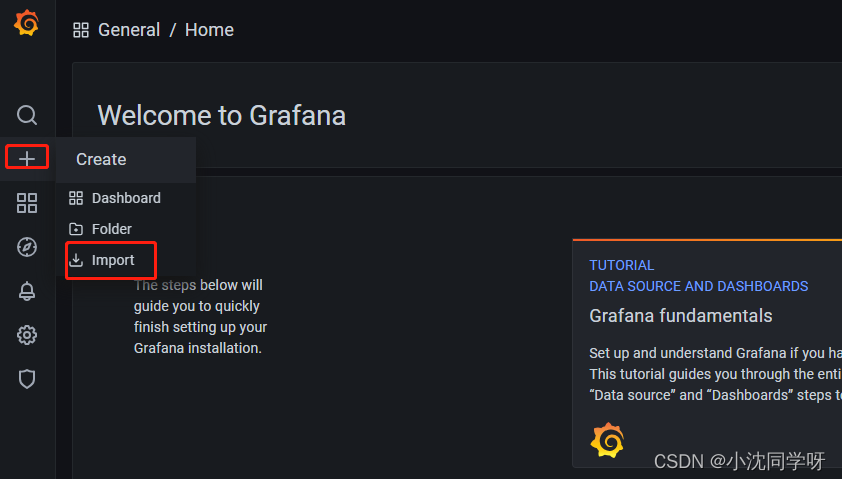
1. Click on the sidebar to add import
2. Enter template ID 10180
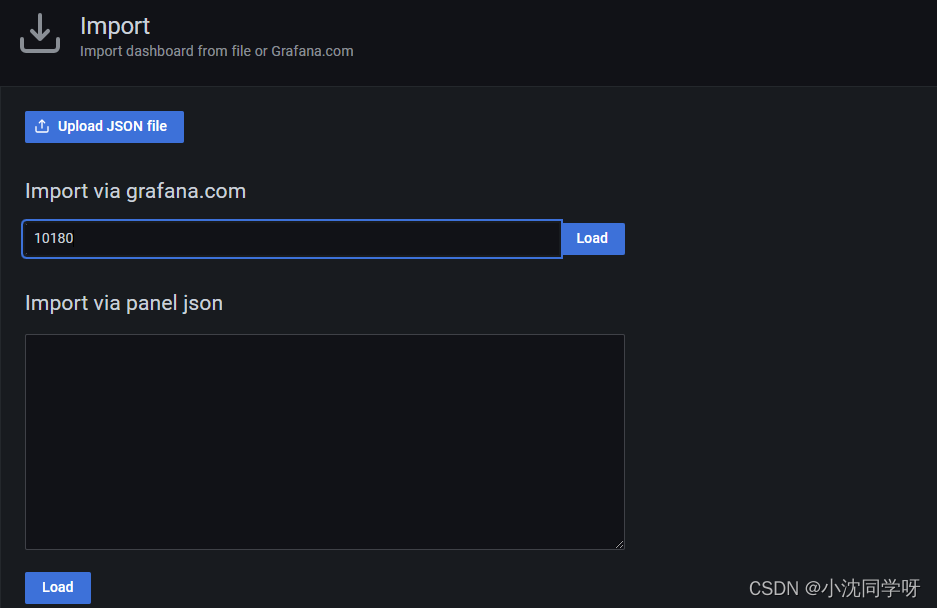
3. Click load to load
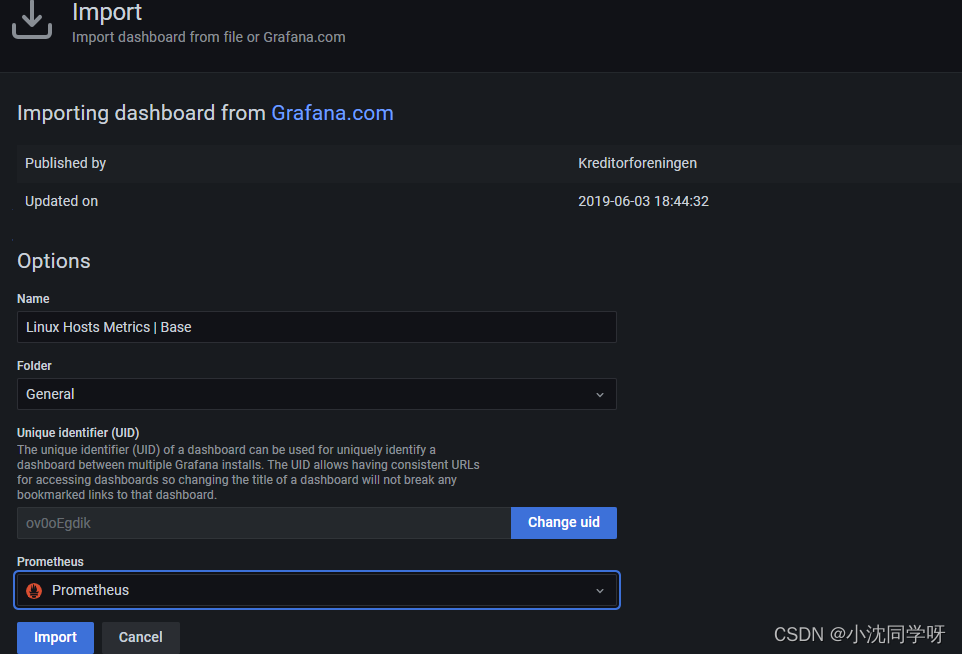
4. Click import to import
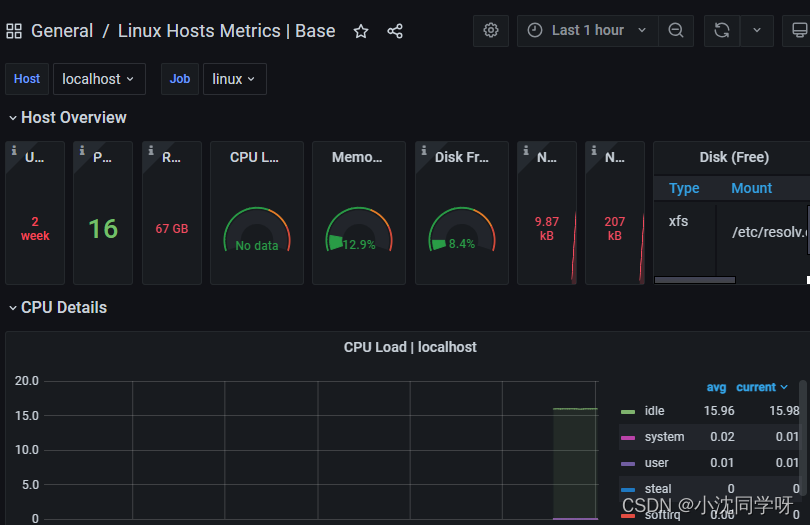
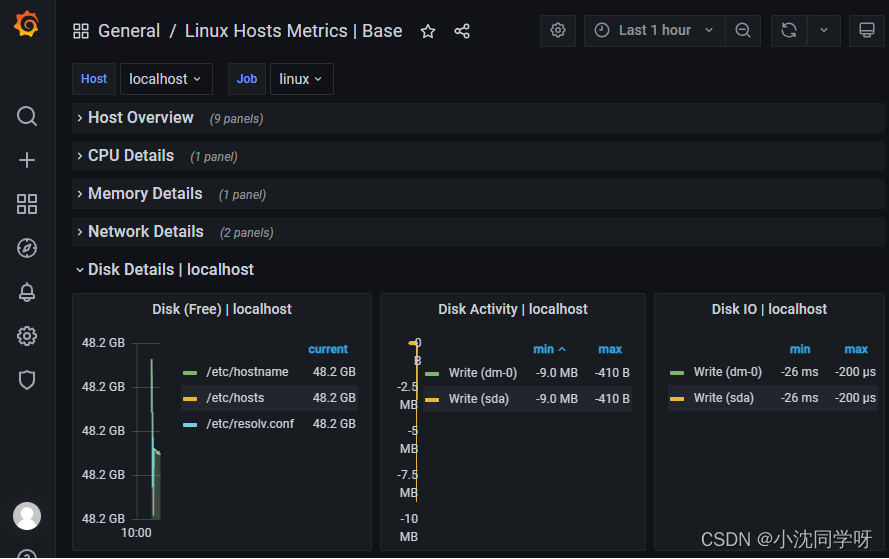
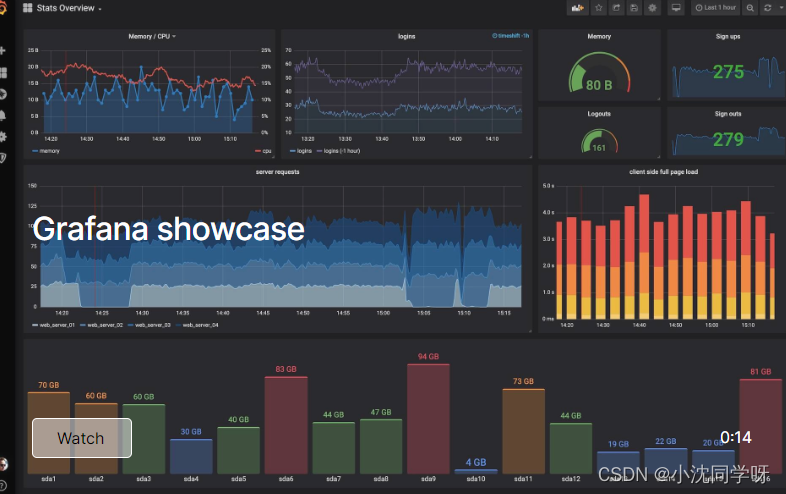
As shown in the figure, it basically covers the monitoring information of the main parameters of the server.
Spring Boot monitoring
Since prometheus actively pulls the indicators of our project, the monitoring port needs to be exposed and the project needs to be modified.
Spring Boot adds monitoring configuration
1. Introducing pom dependencies
org.springframework.boot
spring-boot-starter-actuator
io.micrometer
micrometer-registry-prometheus
2. Add application configuration
management:
  endpoints:
    web:
      exposure:
        include: health,prometheus
3. Test monitoring information
Start the project
postman request 10.10.18.16:8888/actuator/prometheus
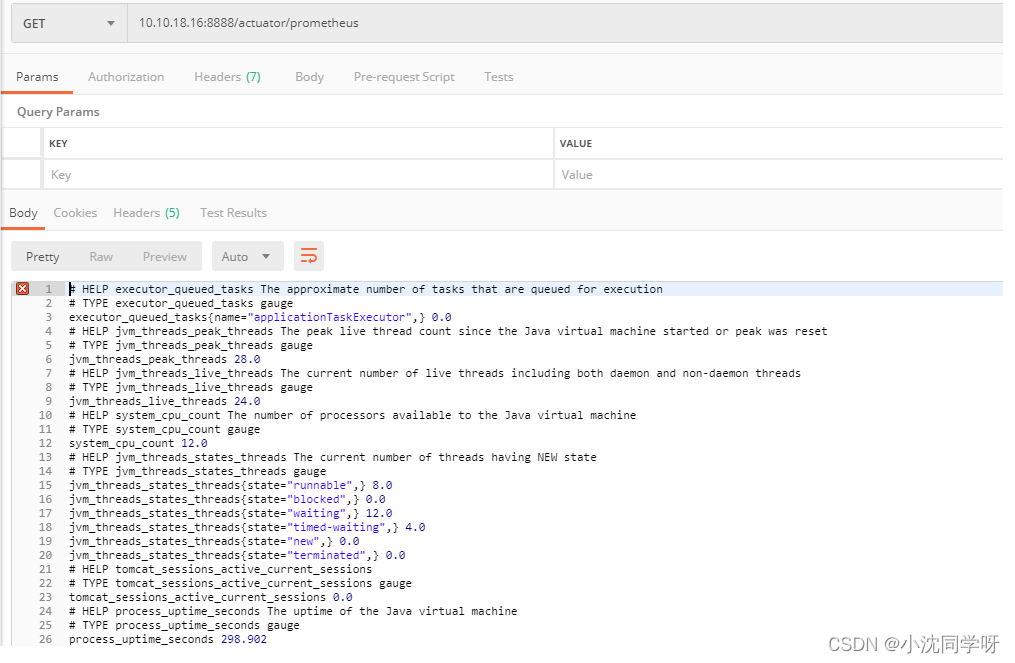
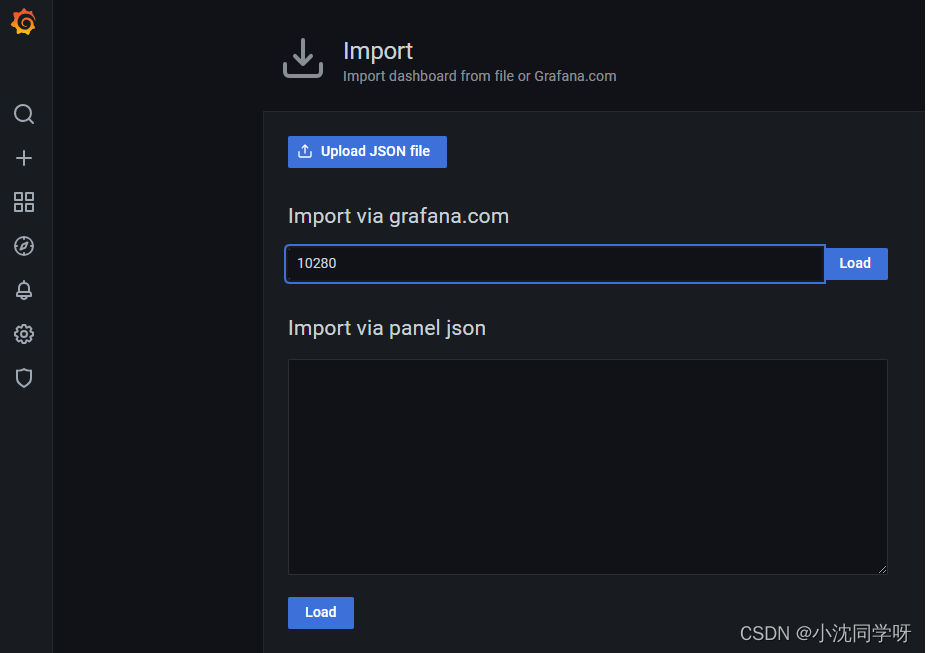
Import Spring Boot 2.1 Statistics
1. Click the import button on the sidebar - enter the template ID 10280
2. Click load to load the dashboard template
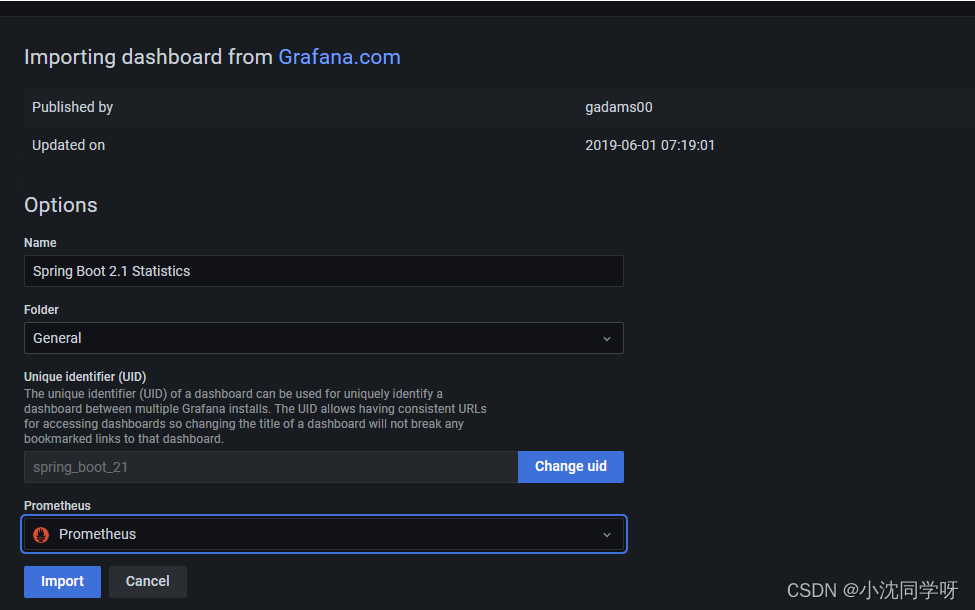
3. Click import to import
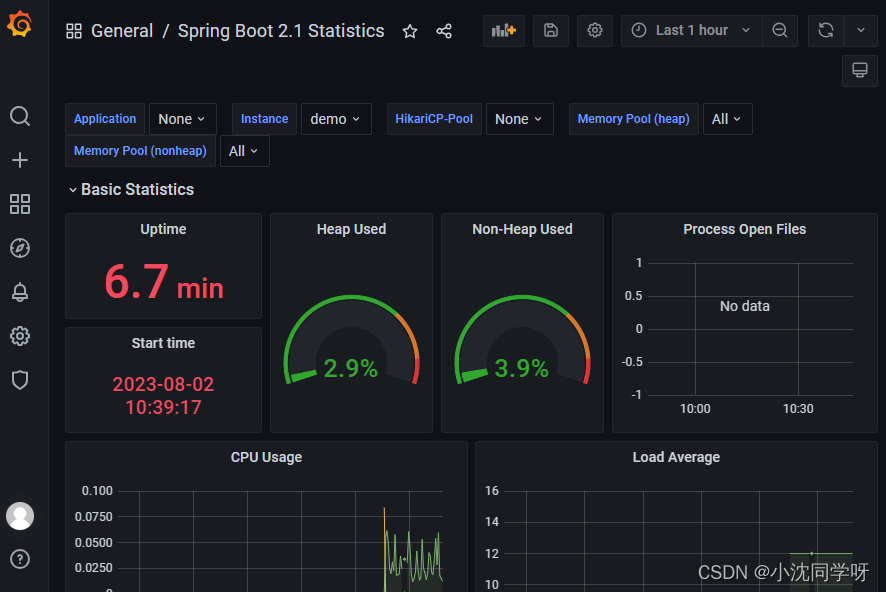
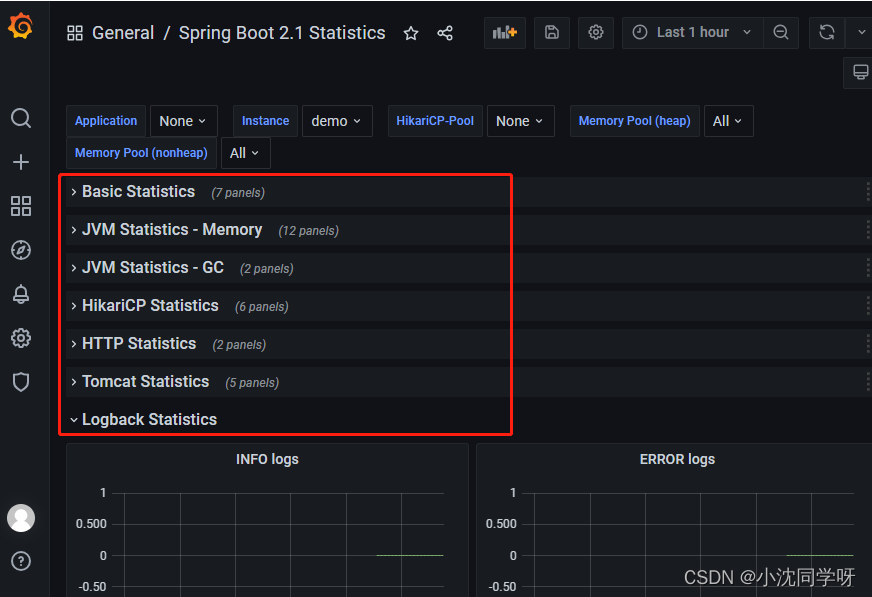
As shown in the figure: it basically covers all project monitoring information.
write at the end
This practical blog post mainly explains the use of docker-compose to arrange Prometheus, node-exporter, and Grafana to realize the monitoring environment construction, and describes the Linux system server indicator monitoring, and the Springboot project exposes the indicator interface for full-link indicator data monitoring. Of course, using the Linux and Springboot monitoring dashboard templates provided by Grafana can be directly put into production.