1. Use the Hilbert transform to calculate the envelope of the signal
The Hilbert transform is most commonly used when finding the envelope of a certain signal, but it is not applicable to the case of finding the envelope of all signals. This is because there is no strict definition for the envelope, and different situations have different requirements when calculating the envelope. The following will introduce the use of the Hilbert transform to obtain the envelope of the signal.
The function of the Hilbert transform that comes with MATLAB is introduced as follows.
Name: hilbert
Function: Hilbert transform the sequence x(n) into y(n), and make x(n) and y(n) into a sequence of analytical signals z(n)=x(n)+jy (n)
Call format:
z=hilbert(x)
Explanation: The function hilbert does not simply convert x(n) to Hilbert transform to obtain y(n), but to obtain y(n) and form an analysis
signal together with x(n) Sequence z(n), and can directly calculate the modulus and phase angle of z(n).
Case 1. Let the signal x(n)=120+96e^[(n/1500)^2]*cos(2π*n/600), n=-5000:20:5000, find the envelope of the signal. After setting the signal, directly call the hilbert function to find the envelope of the signal, and run the first part of the program as follows:
clear all; clc; close all;

n=-5000:20:5000;            % 样点设置
% 程序第一部分:直接做做希尔伯特变换
N=length(n);                % 信号样点数
nt=0:N-1;                   % 设置样点序列号
x=120+96*exp(-(n/1500).^2).*cos(2*pi*n/600); % 设置信号
Hx=hilbert(x);              % 希尔伯特变换
% 作图
plot(nt,x,'k',nt,abs(Hx),'r');
grid; legend('信号','包络');
xlabel('样点'); ylabel('幅值')
title('信号和包络')
set(gcf,'color','w');
pause
The result of the operation is as follows:
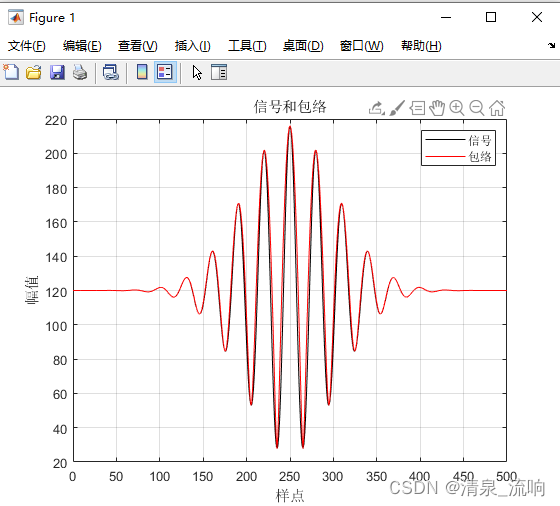
After running the first part of the program, we can get the above figure. From the figure, we can see that the envelope obtained by calculating the signal through the hilbert function does not seem to be the envelope of the signal, but the original signal. Why is this? The reason why such an unsatisfactory envelope is completely caused by the DC component, so the DC component is eliminated from the original signal and then the envelope of the signal is obtained by the hilbert function.
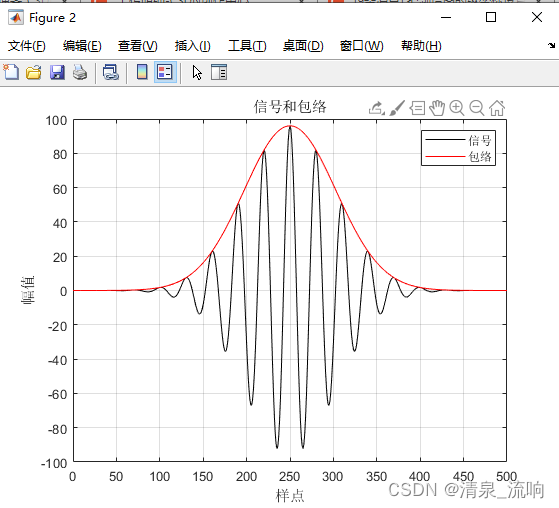
The second part of the program is as follows:
% 程序第二部分:消除直流后做希尔伯特变换
y=x-120;                    % 消除直流分量
Hy=hilbert(y);              % 希尔伯特变换
% 作图
figure(2)
plot(nt,y,'k',nt,abs(Hy),'r');
grid; legend('信号','包络');
xlabel('样点'); ylabel('幅值')
title('信号和包络')
set(gcf,'color','w');
figure(3);
plot(nt,x,'k',nt,abs(Hy)+120,'r');
grid; legend('信号','包络'); hold on;
xlabel('样点'); ylabel('幅值')
title('信号和包络')
set(gcf,'color','w');
pause
The result of the operation is as follows:
At the same time, add the DC component to the envelope and superimpose it on the original signal, modify the incorrect envelope in the above picture, and get the following picture:

This shows that if the signal has a DC component, the envelope of the signal can be obtained by eliminating the DC component first, and then superimposing the DC component on the envelope to restore the envelope of the original signal.
2. Use the cepstrum method to calculate the envelope of the speech signal spectrum
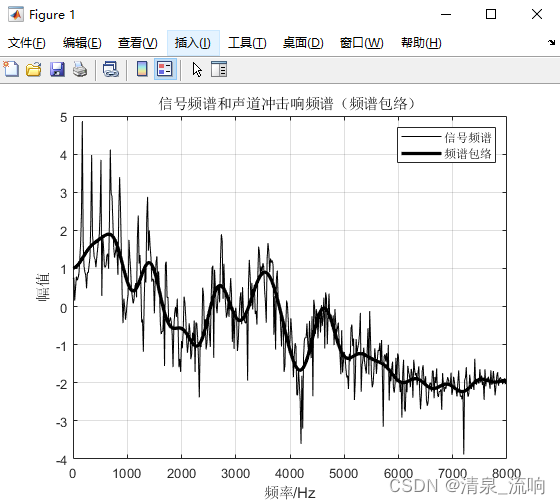
The envelope of the speech signal spectrum is more important for speech analysis. It reflects the resonance structure of the human vocal organ, and the formant parameters (frequency and bandwidth) can be extracted from the envelope of the spectrum. The cepstrum method is commonly used in speech analysis to extract the envelope of the speech signal spectrum.
The essence of cepstrum analysis is to take the logarithm of the amplitude spectrum and then perform spectrum analysis again, so it is also called secondary spectrum analysis.
We know that if two signals have different frequency bands in the frequency domain, the two signals can be separated by filtering. Also in the cepstrum domain, when two signals occupy different cepstrum frequencies in the cepstrum domain, the two signals can also be separated in the cepstrum domain by inverse filtering (Lifter).
The pulse sequence generated by the vocal cords has a higher vibration frequency, while the oral cavity produces sound through muscle movement, and the vibration frequency is lower, so the two are in different cepstrum bands in the cepstrum. The two signals are separated by inverse filtering, and the response of the excitation pulse in the frequency domain and the response of the channel in the frequency domain can be obtained respectively. Generally, the response of the vocal tract in the frequency domain is called the envelope of the speech signal spectrum, through which the formant information of the speech can be extracted.
Case 2. Read in the voice data from the file su1.txt, and obtain the spectrum envelope of the voice signal. The program list is as follows:
clear all; clc; close all;
y=load('su1.txt');                            % 读入数据
fs=16000; nfft=1024;                          % 采样频率和FFT的长度
time=(0:nfft-1)/fs;                           % 时间刻度
nn=1:nfft/2; ff=(nn-1)*fs/nfft;               % 计算频率刻度
Y=log(abs(fft(y)));                           % 取幅值的对数
z=ifft(Y);                                    % 按式(4-3-16)求取倒谱
mcep=29;                                      % 分离声门激励脉冲和声道冲击响应
zy=z(1:mcep+1);
zy=[zy' zeros(1,1024-2*mcep-1) conj(zy(end:-1:2))']; % 构建声道冲击响应的倒谱序列
ZY=fft(zy);                                   % 计算声道冲击响应的频谱
% 作图
plot(ff,Y(nn),'k'); hold on;                  % 画出信号的频谱图
plot(ff,real(ZY(nn)),'k','linewidth',2.5);    % 画出包络线
grid; hold off; ylim([-4 5]);
title('信号频谱和声道冲击响频谱(频谱包络)')
ylabel('幅值'); xlabel('频率/Hz');
legend('信号频谱','频谱包络')
set(gcf,'color','w');
The result of the operation is as follows:
The experimental data su1.txt download link is as follows:
https://mp.csdn.net/mp_download/manage/download/UpDetailed
References: 85 Practical Cases of MATLAB Digital Signal Processing - Introduction to Advanced; Song Zhiyong (edited)