Article directory
1 Introduction
1.1 Introduction to Ridge Regression
Ridge Regression ( Ridge Regression ) is a commonly used linear regression method for dealing with data sets with collinearity problems . In ordinary least squares linear regression, if there is a high degree of correlation between independent variables, the estimated regression coefficients will be unstable or even impossible to estimate accurately. Ridge regression solves this problem by introducing a regularization term.
The key idea of ridge regression is to add an L2 regularization term to the least squares objective function, which penalizes the regression coefficients. This regularization term is implemented by penalizing the sum of squares of the regression coefficients, multiplied by an adjustment parameter alpha. When alphait is 0, ridge regression is equivalent to ordinary least squares regression; and when alpha tends to infinity, the regression coefficient tends to 0. alphaTherefore, ridge regression balances the fitting ability and stability of the regression coefficient by controlling the value.
Advantages :
-
Solve the problem of collinearity: Ridge regression can effectively reduce the impact of multicollinearity on the estimation of regression coefficients. In the presence of highly correlated independent variables, ridge regression can provide more stable and reliable estimates of regression coefficients.
-
Controllable regularization parameters: By adjusting the value of the regularization parameter alpha, you can control the fitting degree of the model and the shrinkage degree of the regression coefficient. This gives ridge regression the flexibility to balance model complexity and fit depending on the specific problem and data.
-
Suitable for high-dimensional data: Ridge regression can provide more stable estimates of regression coefficients when there are a large number of independent variables or features in the data set. It reduces overfitting to noise and irrelevant features by controlling the size of the regression coefficients, thereby improving the generalization ability of the model.
Disadvantages :
-
Introducing bias: Ridge regression may introduce a certain bias by penalizing the regression coefficients. The existence of the regularization term will cause the estimation of the regression coefficient to deviate from the ordinary least squares estimation, which may cause a certain loss of information.
-
Regularization parameters need to be set: The performance of ridge regression is affected by the regularization parameter alpha. Selecting an appropriate alpha value requires some experience or a parameter tuning process. An alpha value that is too large or too small may lead to model performance degradation or overfitting problems.
-
No feature selection ability: Compared with Lasso regression, ridge regression does not have explicit feature selection ability. It performs shrinkage on all independent variables without shrinking some coefficients to zero. Therefore, in cases where feature selection is required, Lasso regression may be more suitable.
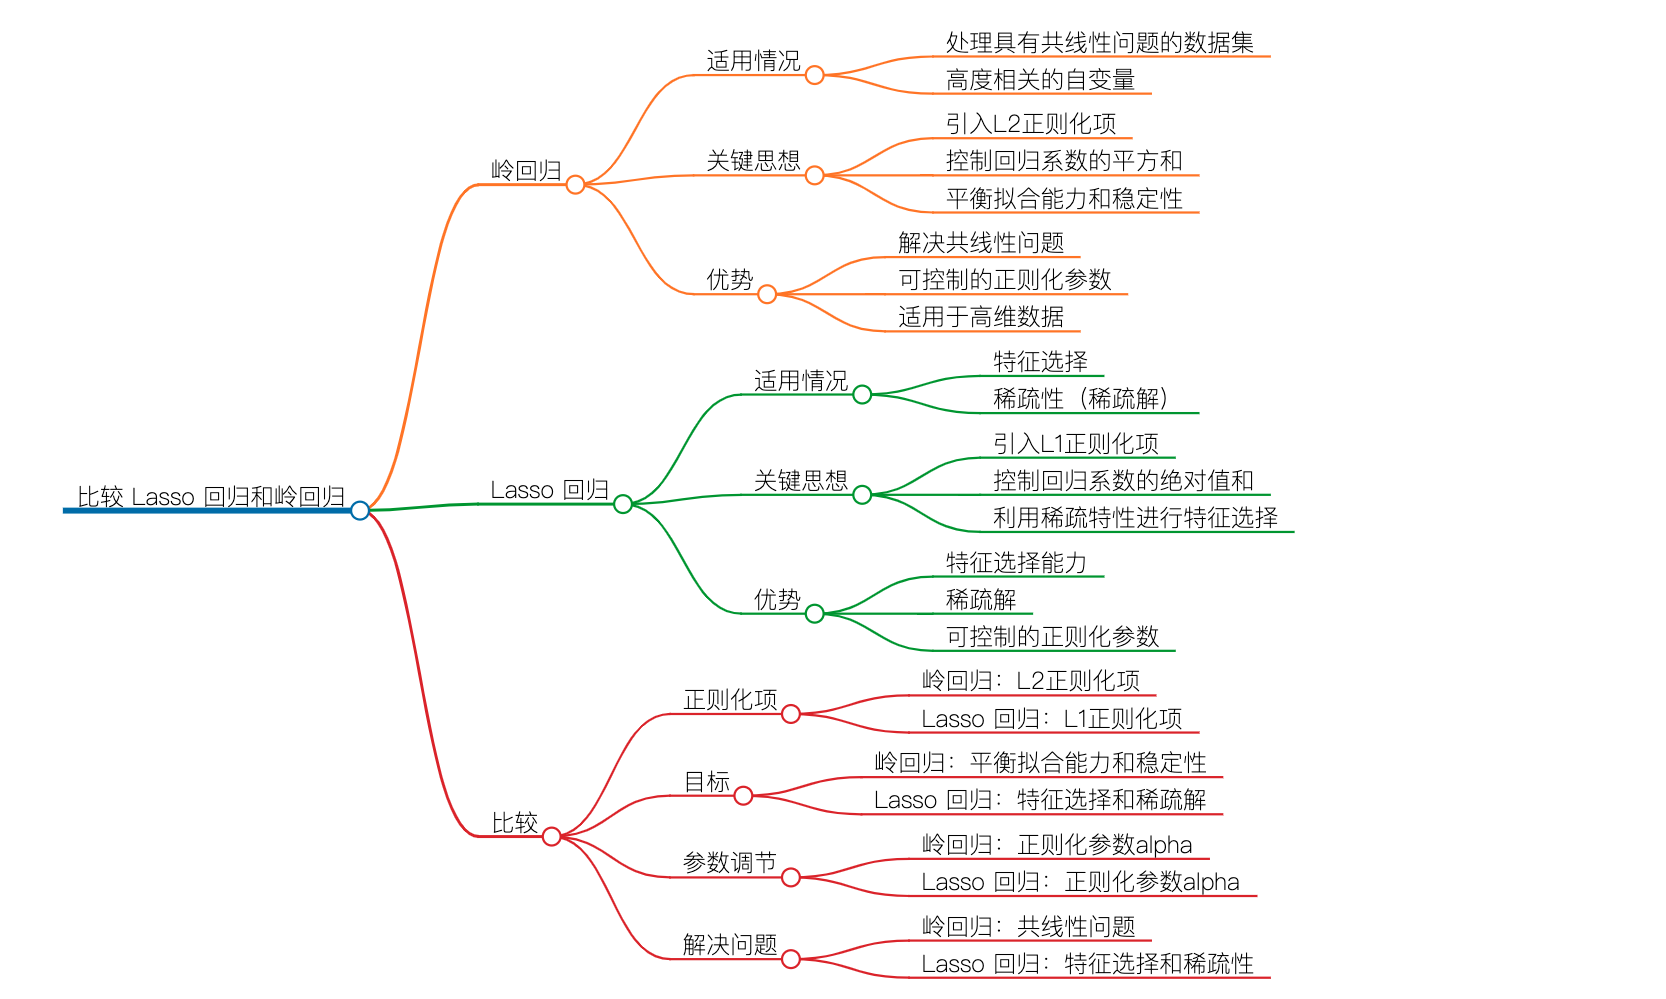
A picture to understand LASSO regression and ridge regression
1.2 Application of Ridge Regression
-
Economics and Finance: Ridge regression can be used to establish asset pricing models, predict economic indicators, and study the influence of factors in financial markets, etc. In the financial field, ridge regression can help identify and analyze the impact of relevant factors on financial markets and asset prices.
-
Medicine and Biology: Ridge regression can be applied to data analysis and prediction tasks in the fields of medicine and biology. For example, in gene expression analysis, ridge regression can help identify genes associated with a particular disease or biological process and predict the relationship between gene expression and associated outcomes.
-
Social Science: Ridge regression can be used for data analysis and modeling in social science fields such as demography, socioeconomics, psychology, etc. It can help to study the correlation between demographic characteristics, socioeconomic indicators, etc., and specific social phenomena or behaviors.
-
Engineering and Physics: Ridge regression is also widely used in engineering and physics. For example, in signal processing, ridge regression can be used for signal restoration and noise filtering tasks. In materials science, ridge regression can be used to model the relationship between material properties and various characteristic parameters.
-
Data analysis and forecasting: Ridge regression is widely used in data analysis and forecasting tasks due to its advantages in dealing with multicollinearity and high-dimensional data. Ridge regression can help to build accurate and stable forecasting models for various application areas such as sales forecasting, market analysis, real estate valuation, etc.
2. Practical demonstration of custom data sets
2.1 Import function
from sklearn.datasets import make_regression
from matplotlib import pyplot as plt
import numpy as np
from sklearn.linear_model import Ridge
2.2 Create a dataset
A, b, coefficients = make_regression(
    n_samples=50,
    n_features=1,
    n_informative=1,
    n_targets=1,
    noise=5,
    coef=True,
    random_state=1
)
2.3 Cases of alpha=0, 1, 10, 100
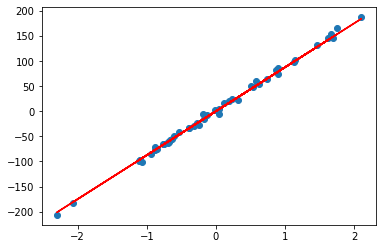
When alpha is equal to 0, ridge regression degenerates into least squares ( Ordinary Least Squares , OLS ) regression. In ridge regression, the regularization term has a coefficient of 0 and does not impose any constraints or penalties on the regression coefficients.
alpha = 0
n, m = A.shape

I = np.identity(m)
w = np.dot(np.dot(np.linalg.inv(np.dot(A.T, A) + alpha * I), A.T), b)
plt.scatter(A, b)
plt.plot(A, w*A, c='red')

## w = array([89.22901347])

When alpha=1:
rr = Ridge(alpha=1)
rr.fit(A, b)
w = rr.coef_
print(w)
## Output w = array([87.39928165])

plt.scatter(A, b)
plt.plot(A, w*A, c='red')
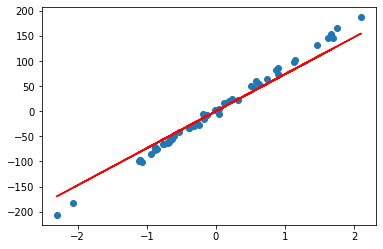
When alpha=10:
rr = Ridge(alpha=10)
rr.fit(A, b)
w = rr.coef_
print(w)
## Output w = array([73.60064637])

plt.scatter(A, b)
plt.plot(A, w*A, c='red')
When alpha=100:
rr = Ridge(alpha=100)
rr.fit(A, b)
w = rr.coef_
print(w)
## Output w = array([28.54061056])

plt.scatter(A, b)
plt.plot(A, w*A, c='red')
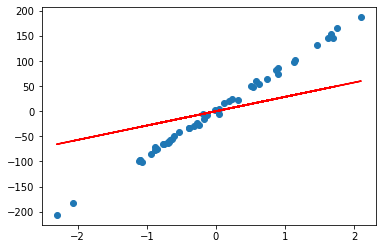
It is not difficult to understand that when the alpha value is large, the regularization term increases the penalty on the regression coefficient, making the regression coefficient closer to zero. A slope of the regression line close to zero means that the predictor function has less influence on the input features, so the regression line can be seen as a plane that averages zero over the entire dataset. This effectively minimizes the variance between different datasets.
By increasing the alpha value, the ridge regression model will place more emphasis on fitting the training data as a whole and reduce overfitting on specific samples or outliers. This improves the generalization ability of the model, making its predictions more stable for new data and reducing the variation of the model across different datasets.
3. Dushanbe_house dataset actual combat demonstration
3.1 Import functions and data
import io
import urllib3
import pandas as pd
http = urllib3.PoolManager()
r = http.request('GET', 'https://hands-on.cloud/wp-content/uploads/2022/04/Dushanbe_house.csv')
Dushanbe = pd.read_csv(io.StringIO(r.data.decode('utf-8')))
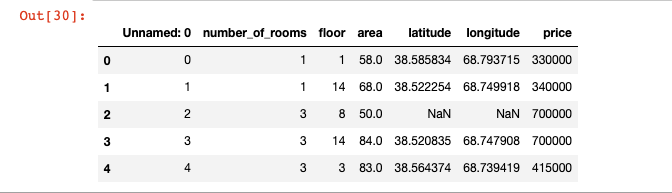
# 查看数据示例
Dushanbe.head()
3.2 Elimination of null values and visualization
# 删除空值
Dushanbe.dropna(axis=0, inplace=True)

# 如果存在空值,显示空值数量
Dushanbe.isnull().sum()
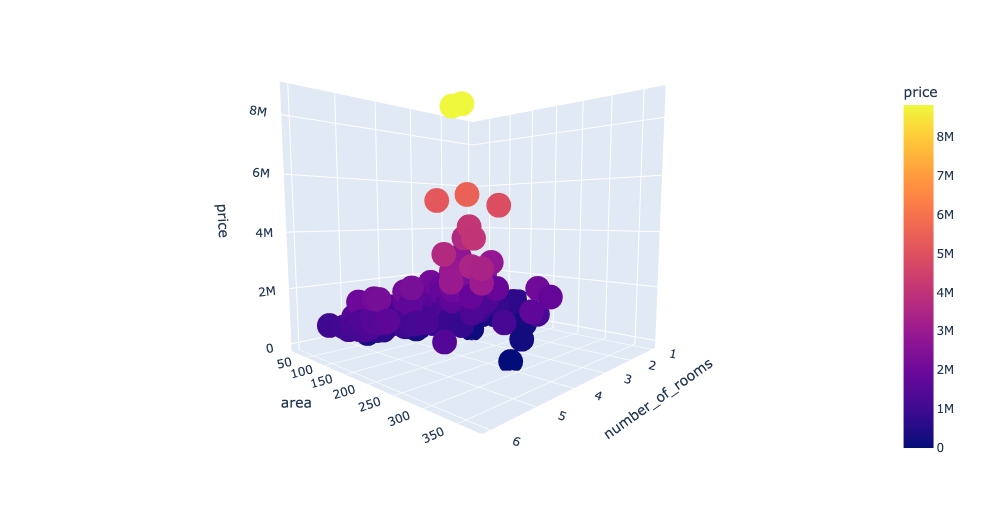
# 使用 plotly.express 导入模块
import plotly.express as px

# 绘制三维散点图
fig = px.scatter_3d(Dushanbe, x='number_of_rooms', y='area', z='price',
                    color='price')
fig.show()
3.3 Organize data
# 提取数据集的列名
columns = Dushanbe.columns

# 存储输入和输出变量
Inputs = Dushanbe[columns[0:-1]]  # 输入变量
outputs = Dushanbe[columns[-1]]  # 输出变量
3.4 Training and testing datasets
from sklearn.model_selection import train_test_split

# 导入模块
from sklearn.model_selection import train_test_split

# 拆分训练数据和测试数据
X_train, X_test, y_train, y_test = train_test_split(Inputs, outputs, test_size=0.3, random_state=42)

# 导入 Ridge 模型
from sklearn.linear_model import Ridge
# 设置 alpha 参数为 0.9 并初始化 Ridge 回归模型
model = Ridge(alpha=0.9)
# 使用训练数据拟合 Ridge 回归模型
model.fit(X_train, y_train)

# 预测
y_pred = model.predict(X_test)
3.5 Evaluation dataset
from sklearn.metrics import r2_score
print('R-square score is:', r2_score(y_test, y_pred))
## R-square score is : 0.3787461308826928
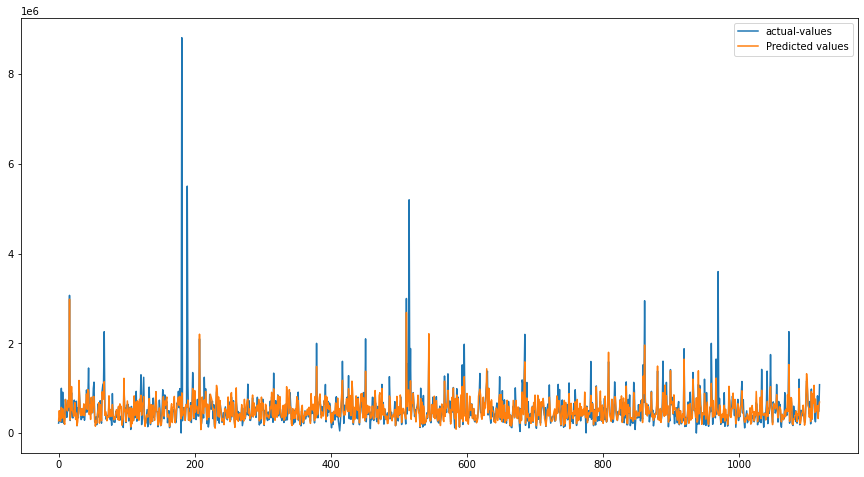
import matplotlib.pyplot as plt
# 设置图形大小
plt.figure(figsize=(15, 8))
# 绘制实际值和预测值的图形
plt.plot([i for i in range(len(y_test))], y_test, label="实际值")
plt.plot([i for i in range(len(y_test))], y_pred, label="预测值")
# 添加图例
plt.legend()
# 显示绘图结果
plt.show()
In addition, model performance can be evaluated with multiple matrix evaluation metrics:
 from sklearn.metrics import mean_squared_error, mean_absolute_error, r2_score
# 计算均方误差(MSE)
mse = mean_squared_error(y_test, y_pred)
# 计算均方根误差(RMSE)
rmse = mean_squared_error(y_test, y_pred, squared=False)
# 计算决定系数(R^2)
r2 = r2_score(y_test, y_pred)
# 计算平均绝对误差(MAE)
mae = mean_absolute_error(y_test, y_pred)

# 打印评估结果
print("Mean Squared Error (MSE):", mse)
print("Root Mean Squared Error (RMSE):", rmse)
print("R-squared (R^2):", r2)
print("Mean Absolute Error (MAE):", mae)

## 结果
# Mean Squared Error (MSE): 138264386141.42395
# Root Mean Squared Error (RMSE): 371839.1939285367
# R-squared (R^2): 0.3787461308826928
# Mean Absolute Error (MAE): 143605.94681857855
4. Discussion
Ridge regression is a regularization-based linear regression technique that balances the fitting ability and complexity of the model by introducing an L2 norm penalty term. It has significant advantages in dealing with multicollinearity and high-dimensional data, which can improve the stability and generalization ability of the model. Ridge regression reduces the influence of the correlation between variables on model prediction by constraining the size of the coefficients, and avoids the problem of overfitting. By adjusting the regularization parameter alpha, the degree of shrinkage of the ridge regression model can be controlled, thereby balancing the bias and variance of the model.
Ridge regression and Lasso regression are complementary to some extent, and they each have different advantages in terms of feature selection and coefficient reduction. Therefore, according to the characteristics of the specific problem and the situation of the data set, choosing to use ridge regression or Lasso regression, or combining the two methods, can better handle the linear regression problem and obtain a more accurate and stable model.