why use
The distributed system is huge and complex, with many services, and the calling relationship network is also very complicated.
- If some errors occur after the service is launched, it will be difficult to locate the error exception.
- A request may call a lot of links, and we need to know which one is wrong.
In the end, we hope to have a link tracking system. From each request to its final end, how many microservices are called among them, including how long each service call takes.
Only when the link tracking system is finally combined can the fuse downgrade be done. Through the link tracking system, it is found that a certain service is particularly slow, but it is still running normally, so we will directly downgrade it to prevent the avalanche of our entire system. question.
The microservice architecture is a distributed architecture, which divides service units by business, and a distributed system often has many service units. Due to the large number of service units and the complexity of the business, it is difficult to locate errors and exceptions if they occur.
It is mainly reflected in that a request may need to call many services, and the complexity of calling internal services makes it difficult to locate the problem.
Therefore, in the microservice architecture, distributed link tracking must be implemented to follow up which services participate in a request and what is the order of participation, so that the steps of each request are clearly visible, and if there is a problem, it can be quickly located .
Therefore, it is very necessary to build a service link tracking system in a distributed system.
Link tracking components include Google's Dapper, Twitter's Zipkin, and Ali's Eagleeye (Eagle Eye), etc., which are all excellent link tracking open source components.
Basic Terminology and Process
-
Span (span): The basic unit of work. Sending a remote scheduling task will generate a Span. Span is uniquely identified by a 64-bit ID. Trace is uniquely identified by another 64-bit ID. Span has other data information, such as Summary, timestamped event, ID of the span, and progress ID.
-
Trace (tracking): A tree structure composed of a series of Span. Request the API interface of a microservice system. This API interface needs to call multiple microservices. Calling each microservice will generate a new Span. All the Spans generated by this request form this Trace.
-
Annotation: Used to record an event in time, some core annotations are used to define the beginning and end of a request. These annotations include the following:
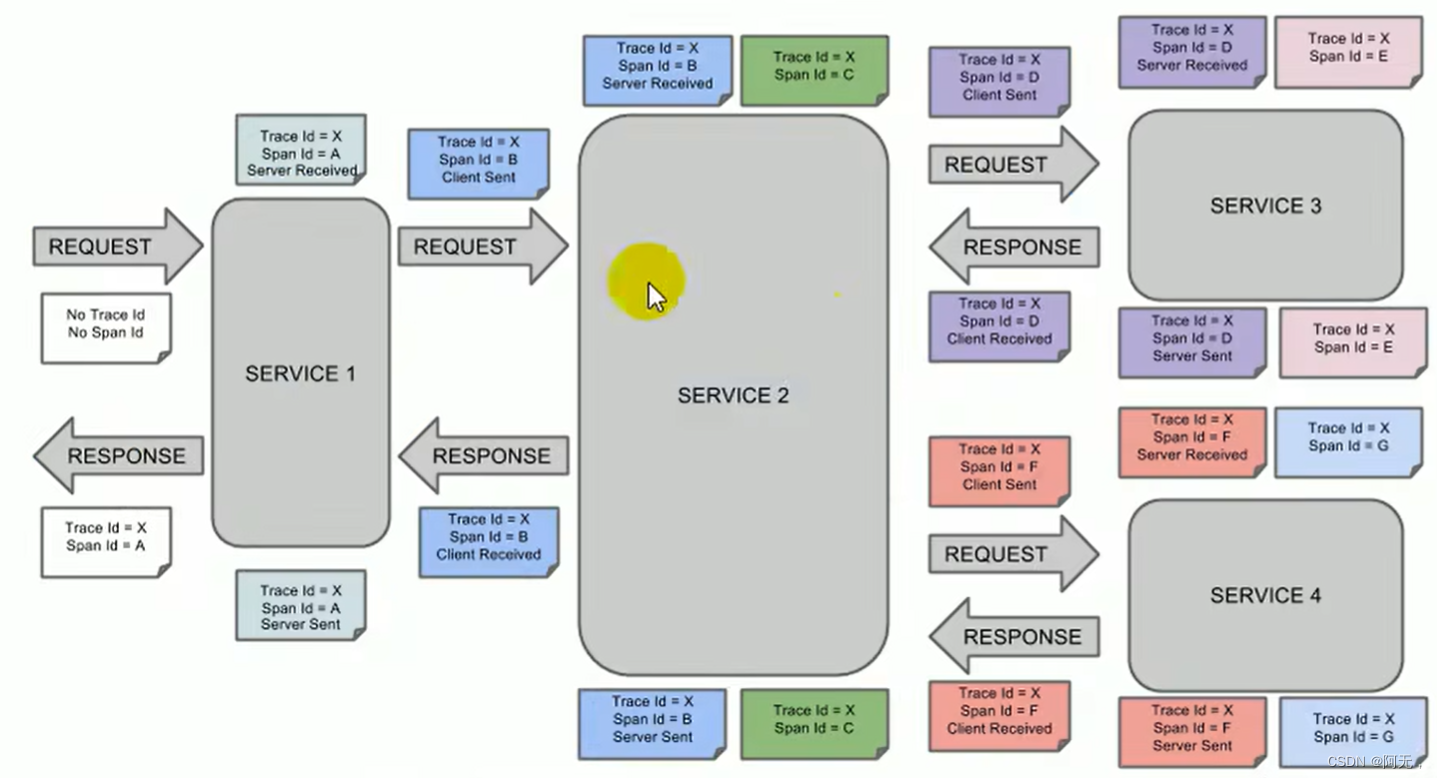
- cs - Client Sent - The client sends a request, this annotation describes the start of the Span
- sr - Server Received - The server gets the request and is ready to start processing it. If you subtract the cs timestamp from its sr, you can get the time of network transmission.
- ss - Server Sent (the server sends a response) – this annotation indicates the completion of the request processing (when the request returns to the client), if the timestamp of ss minus the timestamp of sr, the time of the server request can be obtained.
- cr - Client Received (the client receives the response) - the end of the Span at this time, if the timestamp of cr minus the timestamp of cs, the time consumed by the entire request can be obtained.
-
The browser sends a request to service1, generates span A, records trace id, span id, and identifies Server Received (representing when the request was received), and service1 processes it.
Because the request is sent by the browser, Client Sent will not be recorded. -
Then call service2 remotely to send the request, and a spanB will be generated to record the client sent (time to send the request) and Server Received. The subtraction of the two is the transmission time we can.
-
After the service2 processing is completed, spanC (which represents the next request) is generated and sent out concurrently, and two different spans will be generated, SpanD and spanF, which record the client sent respectively.
-
service3 receives the request record Server Received, and generates spanE after the processing is completed, but we no longer call the remote method, and spanE can be discarded.
After service3 finishes processing spanD, record serverSent, and the subtraction of serverSent and serverRecived is the time for service3 to process the request. -
In the returned response, record Client Received, that is, the response time received by the client and service2.
-
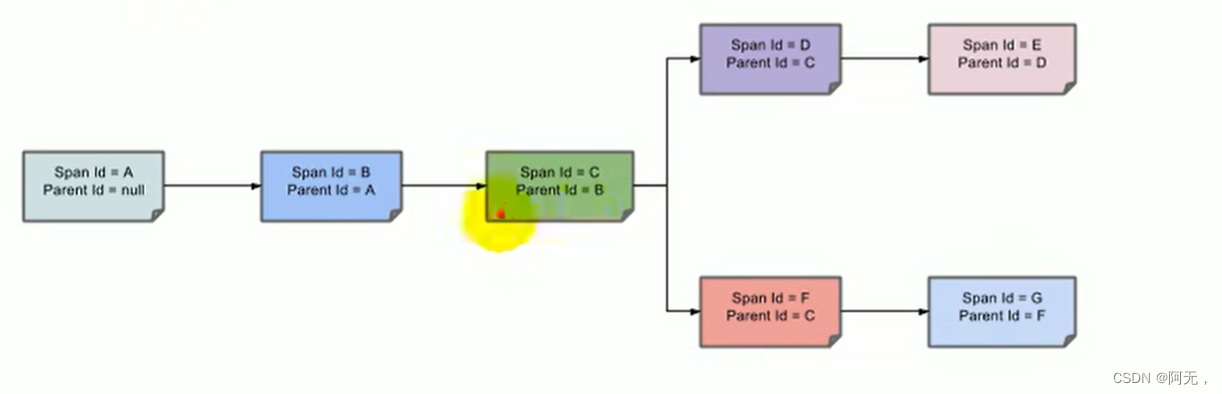
The link at this time can be traced, spanA - spanB - spanD (spanC is not counted, it is just a span generated by business processing), and then spanD returns a response.
-
The link of service4 is the same as that of service3.
To determine whether it is a network failure or a service failure, take spanF as an example,
- serverSent minus serverRecived If the time is too long, then there is a problem with the service
- If serverRecived minus clientSent takes too long, then there is a problem with the network
The transmission time in the middle of the link and the processing time of each service are tagged, so we can all get these data.
Tags have a parent-child relationship, and the parent tag of each lower-level tag is a higher-level tag.
After the parent-child relationship is established, the tree structure of the entire call chain can be drawn, including its link structure.
springboot integrates Sleuth and zipkin
# 服务提供者与消费者导入依赖
# 所以我们直接把依赖导入到common模块中
<dependency>
            <groupId>org.springframework.cloud</groupId>
            <artifactId>spring-cloud-starter-sleuth</artifactId>
        </dependency>
Through the call chain monitoring information generated by Sleuth, you can know the call links between microservices, but the monitoring information is only output
to the console and is not convenient to view. We need a graphical tool - zipkin. Zipkin is Twitter's open-source distributed tracking
system, which is mainly used to collect time series data of the system, so as to track the calling problems of the system.
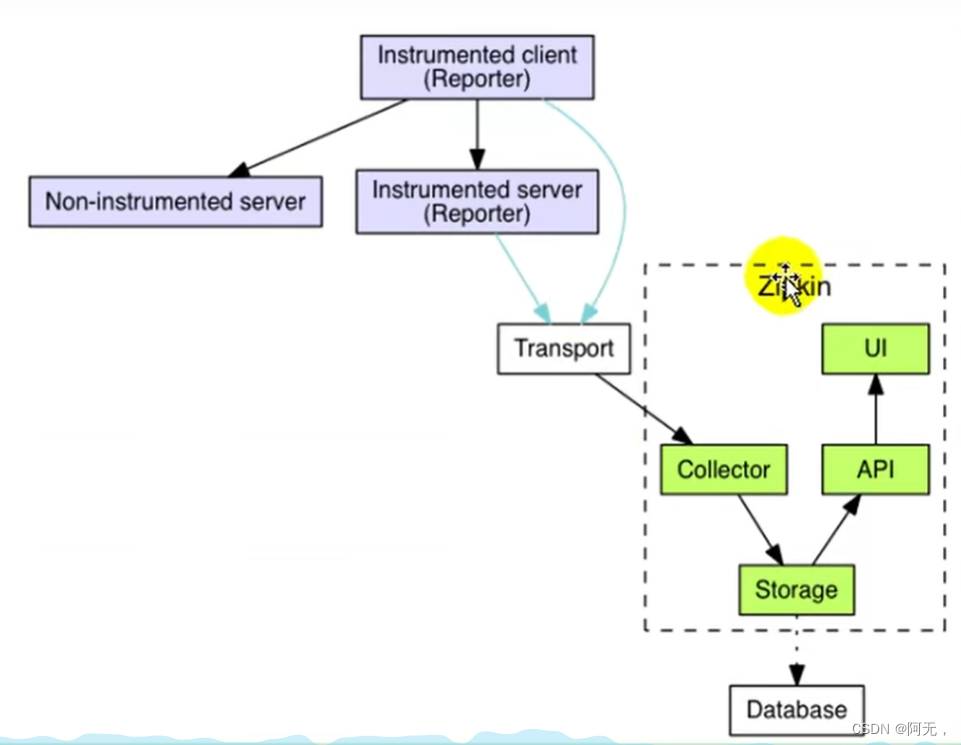
Zipkin has a ui interface and related api operations. It can also store data in one place and collect data at the same time.
Zipkin can collect the data of our service, and the client of our service will report the data to it, so we need to import the dependency of zipkin, and our client can report the data, and the reported data will be collected into the zipkin server for visualization.
By default, Zipkin stores monitoring data in memory. If Zipkin hangs or restarts, the monitoring data will be lost. So if you want to build a production-available Zipkin, you need to implement the persistence of monitoring data.
To achieve data persistence, it is natural to store the data in the database. zipkin supports storing data in
- memory (default)
- MySQL
- Elasticsearch (we use this)
- Cassandra
 docker run -d -p 9411:9411 openzipkin/zipkin

# 启动zipkin,将数据保存至es中
docker run --env STORAGE_TYPE=elasticsearch --env ES_HOSTS=192.168.56.10:9200
openzipkin/zipkin-dependencies

# 也是导入到common中
# zipkin中已经导入了sleuth,所以之前的sleuth依赖可以去掉
<dependency>
<groupId>org.springframework.cloud</groupId>
<artifactId>spring-cloud-starter-zipkin</artifactId>
</dependency>
application.properties
spring.cache.type=redis
spring.cache.redis.time-to-live=3600000
spring.cache.redis.use-key-prefix=true
spring.cache.redis.cache-null-values=true


gulimall.thread.core-size=20
gulimall.thread.keep-alive-time=10
gulimall.thread.max-size=200

spring.session.store-type=redis


# actuator 暴露所有资源
management.endpoints.web.exposure.include=*
# sentinel dashboard 地址
spring.cloud.sentinel.transport.dashboard=localhost:8333
# 限流成功指定返回的内容类型
spring.cloud.sentinel.scg.fallback.content-type=application/json
spring.cloud.sentinel.scg.fallback.response-status=400

# 开启feign的sentinel远程保护
feign.sentinel.enabled=true

# 开启debug日志
logging.level.org.springframework.cloud.openfeign=debug
logging.level.org.springframework.cloud.sleuth=debug

# zipkin服务器地址
spring.zipkin.base-url=http://192.168.56.10:9411/
# 关闭服务发现,否则spring cloud会把zipkin的url当作服务名称
spring.zipkin.discovery-client-enabled=false
# zipkin以web http的方式发送数据
spring.zipkin.sender.type=web
# 采样器,默认为0.1,即百分之十,只采样百分之十的请求数据
spring.sleuth.sampler.probability=1
The needs of enterprises are realistic, because we must solve real problems, but education should not focus on real needs, but should be future-oriented.
https://baijiahao.baidu.com/s?id=1760664270073856317&wfr=spider&for=pc
Shine the Fireworks and Create the Future Together—Ren Zhengfei’s Speech at the Symposium on the Fireworks Awards of "Unveiling the Problems"
Ren Zhengfei