Under the microservice architecture, a request may be completed through at least three or four service calls, and may span dozens or even hundreds of service nodes. Then the questions come one after another:
1) How to dynamically display the service call link? (For example, what other services does service A call - dependencies)
2) How to analyze the bottleneck nodes in the service calling link and tune them? (For example, A->B->C, C service processing time is particularly long)
3) How to quickly detect service link faults?
This is the purpose and significance of the existence of distributed link tracking technology
Table of contents
Essence: logging
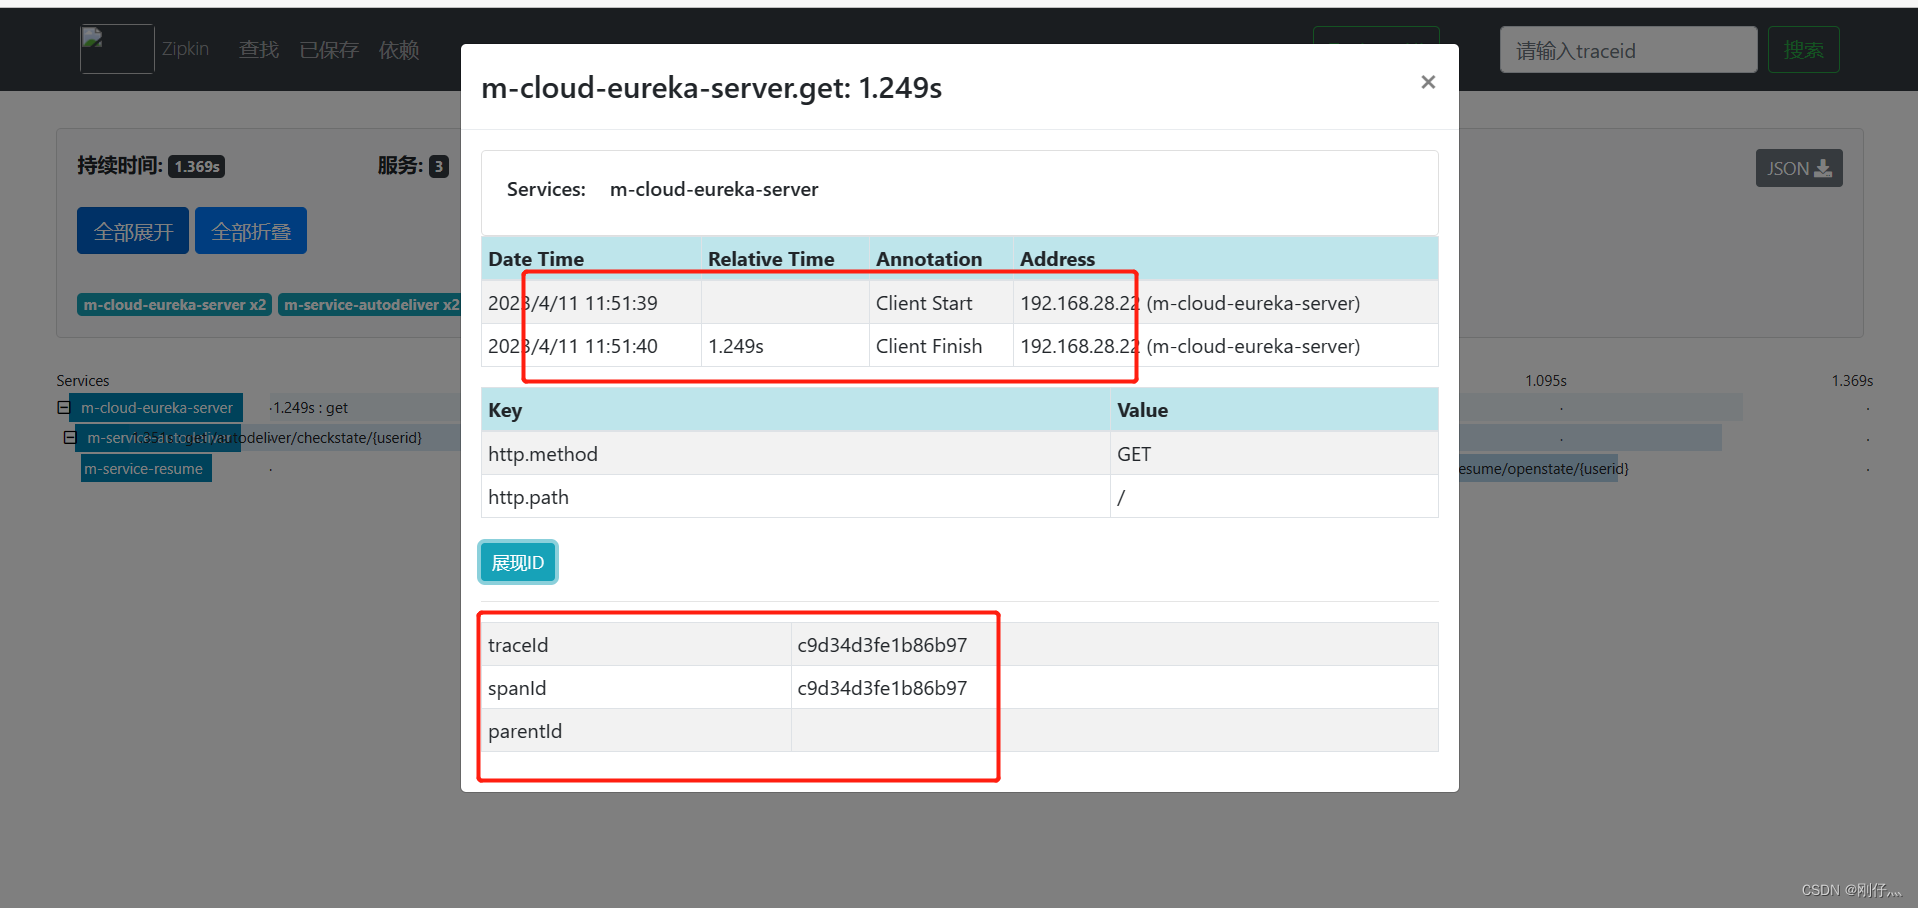
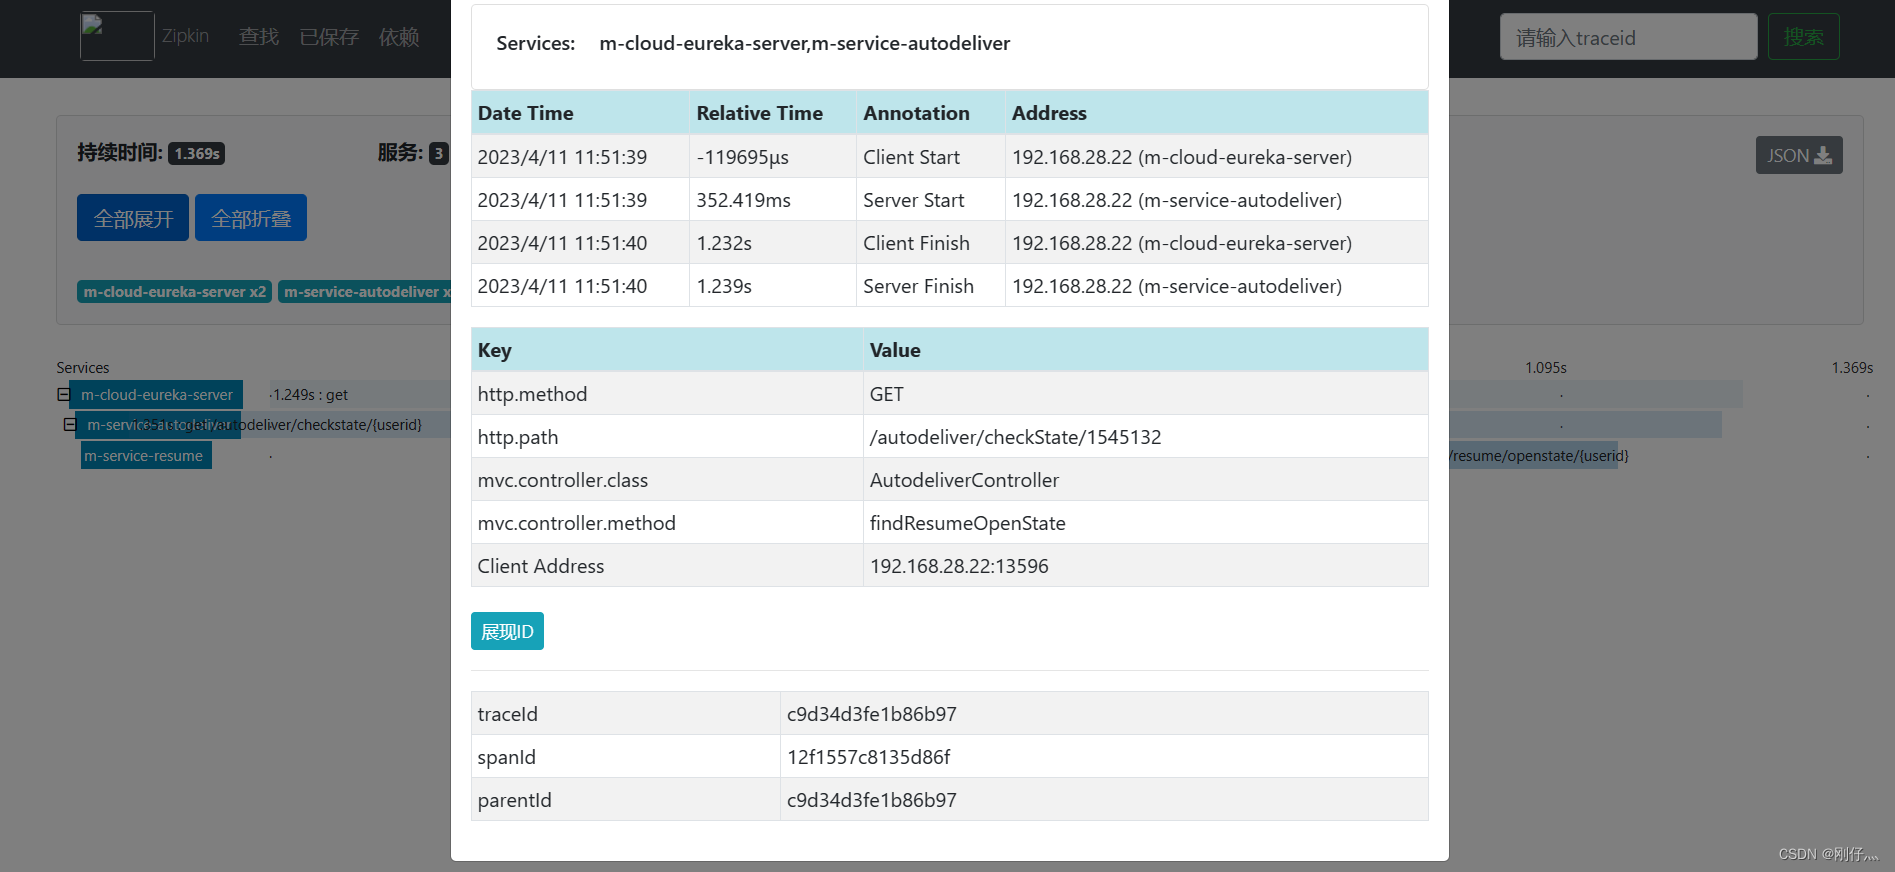
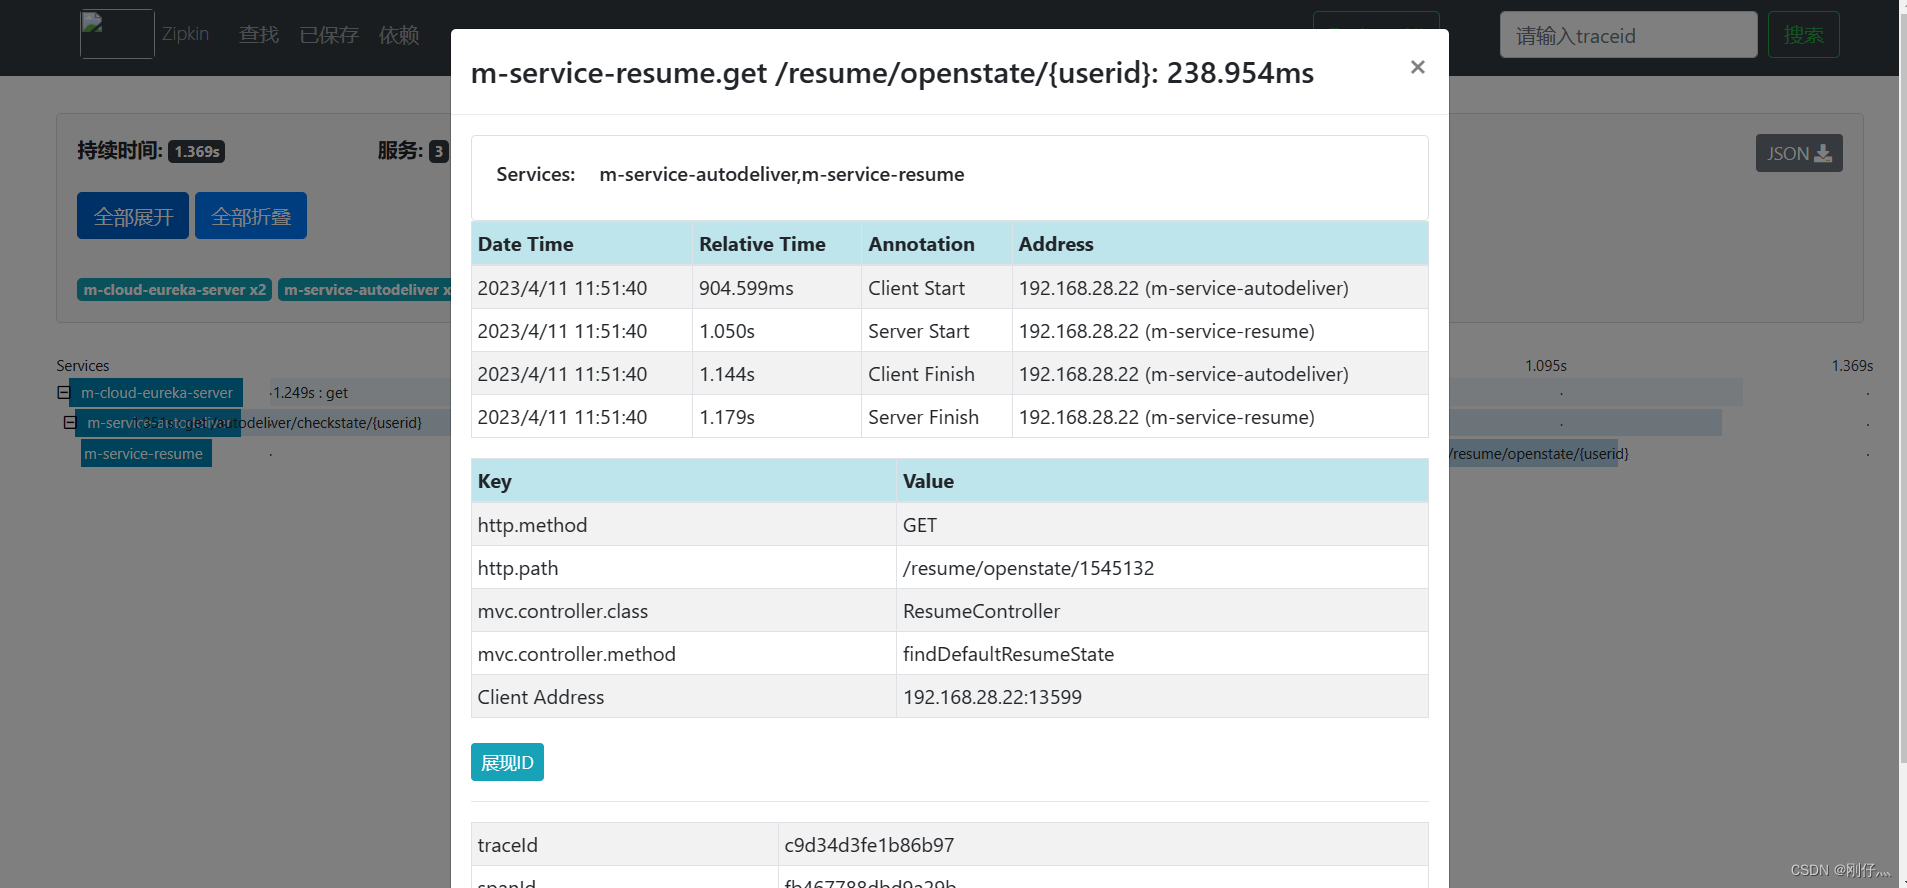
A request link, a link is uniquely identified by TraceId, and span identifies the request information initiated. Each span is associated by parrentId. Trace
: The tracking unit of service tracking is the boundary where the request (request) is initiated by the customer and reaches the tracked system. The process begins and ends when the tracked system returns a response to the client.
Trace ID : In order to implement request tracking, when a request is sent to the inlet endpoint of the distributed system, the service tracking framework only needs to create a unique trace ID for the request. At the same time, when it is circulated within the distributed system, The missing frame maintains this unique identification until a Trace is returned to the requester. It consists of one or more Span. Each Span has a SpanId, and the TraceId will be recorded in the Span.
ParentId points to the SpanId of another Span, indicating the parent-child relationship. In fact, it essentially expresses the dependency relationship.
Span ID : In order to count the time delay of each processing unit, when a request reaches each service component, a unique identifier SpanID is also used to mark its start, specific process and end. For each Span, it must have two start and end nodes. By recording the timestamps of the start Span and the end Span, the time delay of the Span can be calculated. In addition to the timestamp record, it can also include Some other metadata, such as time name, request information, etc. Each Span will have a unique tracking identifier Span ID. If several ordered spans form a trace.
Span can be considered as a log data structure. Some log information will be recorded at some special timing points, such as timestamp, spanId, TraceId, parentIde, etc.
Span also abstracts another concept called events, the core events are as follows
- CS: client send/start The client/consumer sends a request, describing the start of a span
- SR: server received/start server/producer receives request SR-CS belongs to the network delay of request sending
- SS: server send/finish The server/producer sends the response SS-SR, which is the time consumed by the server.
- CR: client received/finished client/consumer receive response CR-SS indicates the time required for reply (network delay of response)
Spring Cloud Sleuth (tracking service framework) can track calls between services. Sleuth can record which services a service request passes through, service processing time, etc. Based on these, we can clarify the calling relationships and processes between microservices. Issue tracking analysis.
-
Time-consuming analysis : Use Sleuth to understand the time-consuming of sampling requests and analyze service performance issues (which service calls are more time-consuming)
-
Link optimization : discover frequently called services, targeted optimization, etc.
-
Sleuth records trace data through logging.
Service build
Sleuth+ Zipkin
- Each microservice project that needs to be tracked introduces dependency coordinates
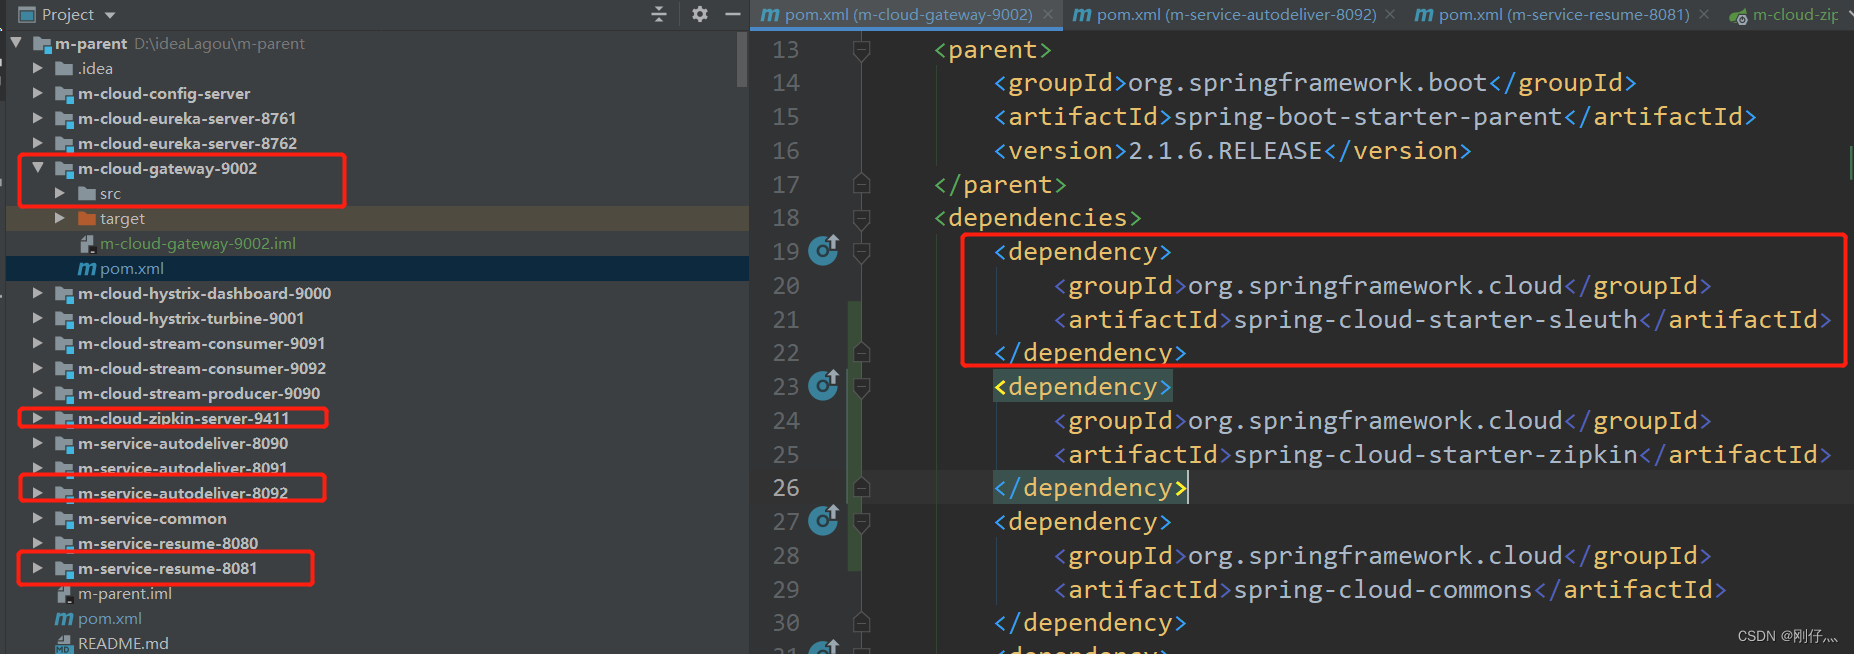
  <dependency>
     <groupId>org.springframework.cloud</groupId>
      <artifactId>spring-cloud-starter-sleuth</artifactId>
 </dependency>
- Modify the application.yml configuration file for each microservice and add a log level
#分布式链路追踪
logging:
  level:
    org.springframework.web.servlet.DispatcherServlet: debug
    org.springframework.cloud.sleuth: debug
- Start the service observation console
Combined with Zipkin to display tracking data
Zipkin includes Zipkin Server and Zipkin Client. Zipkin Server is a separate service, and Zipkin Client is a
specific microservice.
- Zipkin Server build (create new module under m-parent)
2. Dependencies
 <!--zipkin-server的依赖坐标-->
		        <dependency>
		            <groupId>io.zipkin.java</groupId>
		            <artifactId>zipkin-server</artifactId>
		            <version>2.12.3</version>
		            <exclusions>
		                <!--排除掉log4j2的传递依赖,避免和springboot依赖的⽇志组件冲突-->
		                <exclusion>
		                    <groupId>org.springframework.boot</groupId>
		                    <artifactId>spring-boot-starter-log4j2</artifactId>
		                </exclusion>
		            </exclusions>
		        </dependency>
		        <!--zipkin-server ui界⾯依赖坐标-->
		        <dependency>
		            <groupId>io.zipkin.java</groupId>
		            <artifactId>zipkin-autoconfigure-ui</artifactId>
		            <version>2.12.3</version>
		        </dependency>
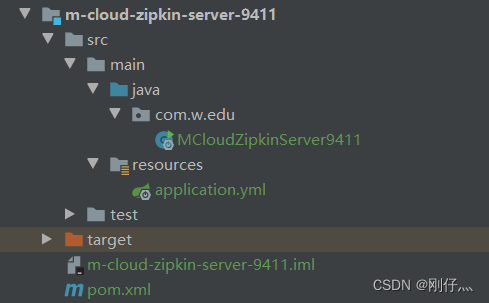
- Startup class
@SpringBootApplication
@EnableZipkinServer //开启ZipkinServer
public class MCloudZipkinServer9411 {


    public static void main(String[] args) {


        SpringApplication.run(MCloudZipkinServer9411.class,args);
    }
}
- Configuration
server:
  port: 9411

management:
  metrics:
    web:
      server:
        auto-time-requests: false #关闭自动检测
- Zipkin Client construction (modified in specific microservices)
- Add zipkin dependency in pom
<dependency>
 <groupId>org.springframework.cloud</groupId>
 <artifactId>spring-cloud-starter-zipkin</artifactId>
</dependency>
- Add a reference to zipkin server in application.yml
  # zipkin链路追踪配置
spring:
  zipkin:
    base-url: http://localhost:9411
    sender:
      type: web
  sleuth:
    sampler:
      probability: 1 #采样率 1代表100%全采集,默认0.1 10%
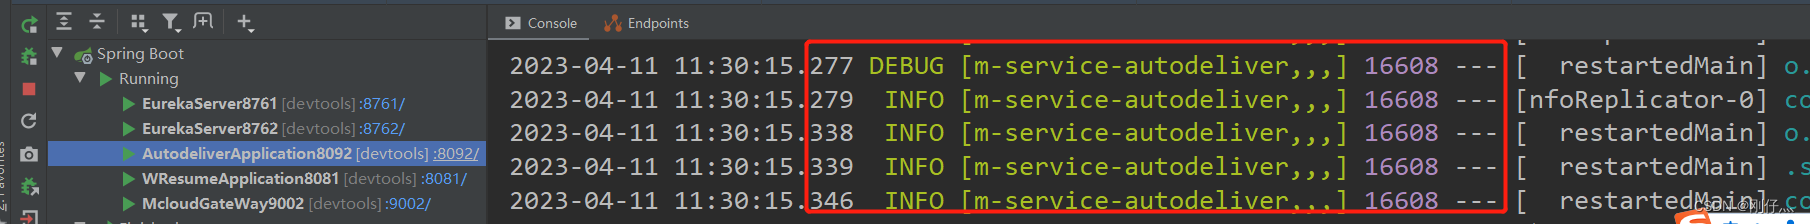
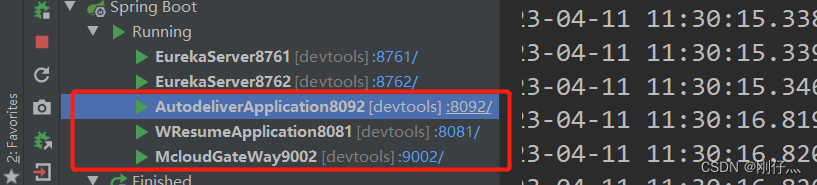
- Start Zipkin Server and restart the following services
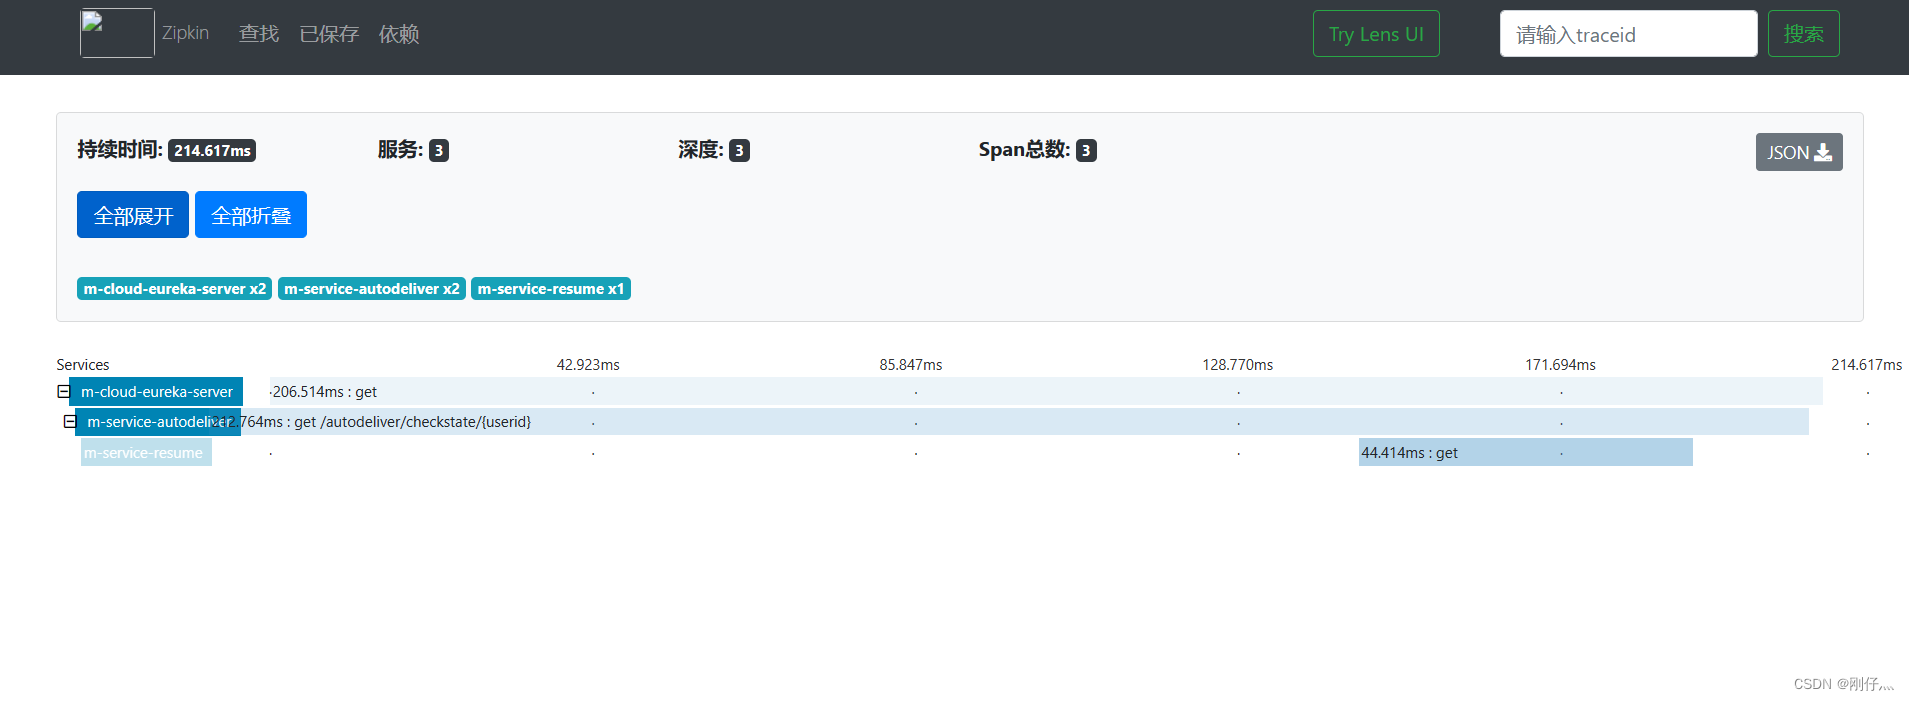
- Visit http://localhost:9411/zipkin/
- Call microservices to generate link information
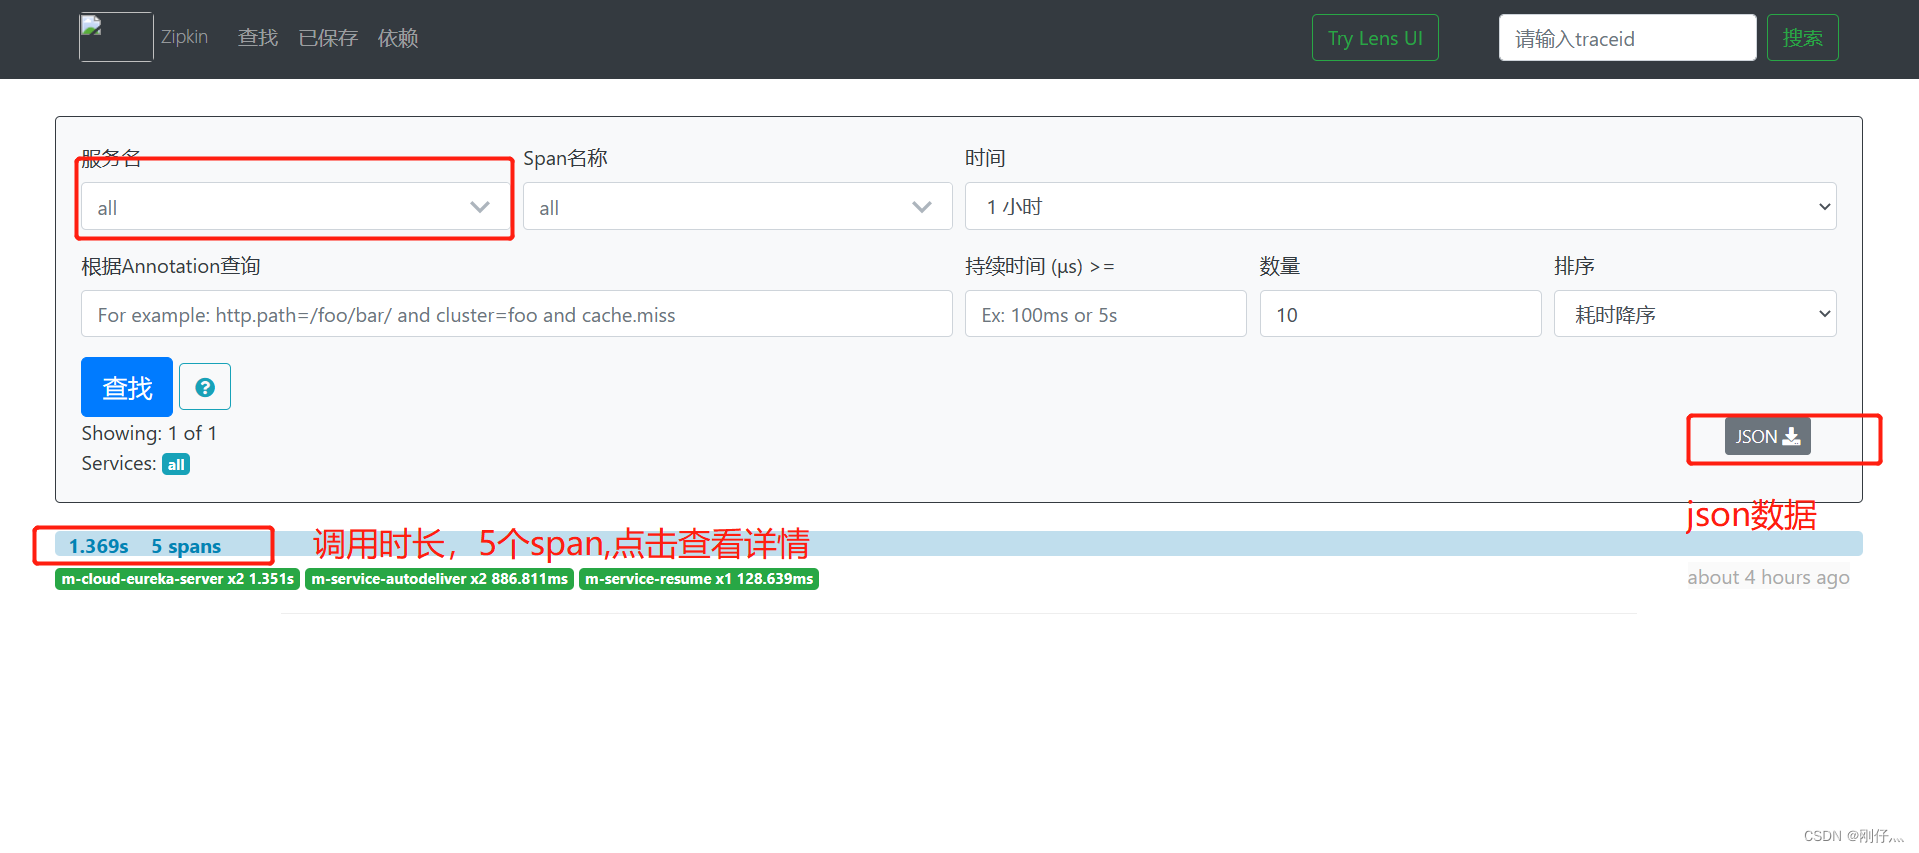
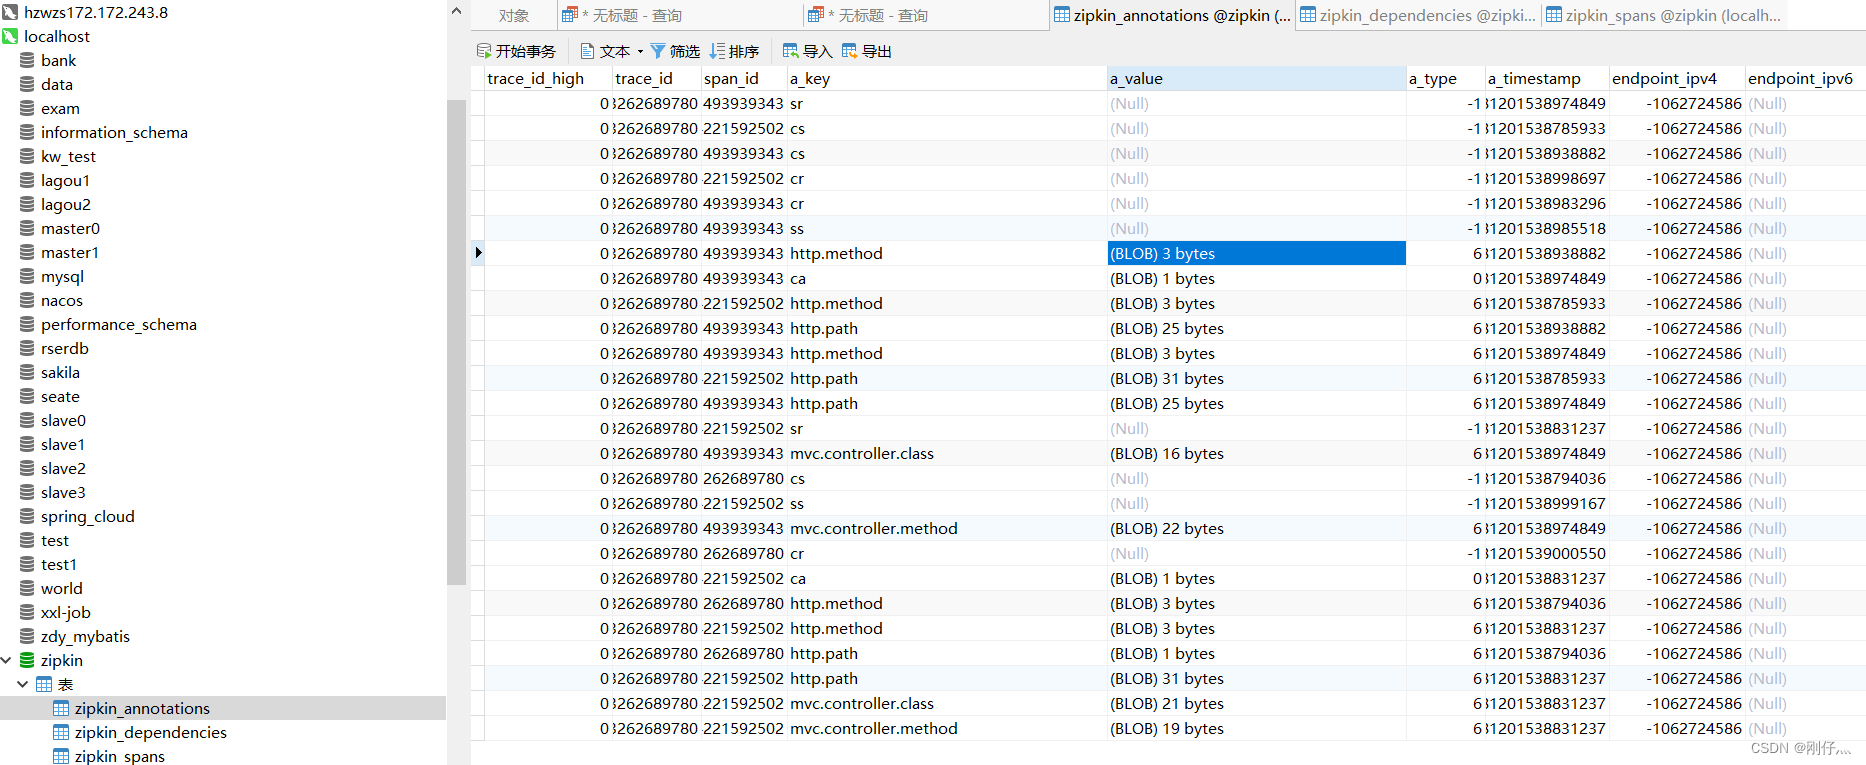
Tracking data Zipkin persists to mysql
Without persistence, the data disappears after the data service is restarted.
- Create a
zipkindatabase named in mysql and execute the following sql statement (officially provided)
--
-- Copyright 2015-2019 The OpenZipkin Authors
--
-- Licensed under the Apache License, Version 2.0 (the "License"); you may not use this file except
-- in compliance with the License. You may obtain a copy of the License at
--
-- http://www.apache.org/licenses/LICENSE-2.0
--
-- Unless required by applicable law or agreed to in writing, software distributed under the License
-- is distributed on an "AS IS" BASIS, WITHOUT WARRANTIES OR CONDITIONS OF ANY KIND, either express
-- or implied. See the License for the specific language governing permissions and limitations under
-- the License.
--

CREATE TABLE IF NOT EXISTS zipkin_spans (
  `trace_id_high` BIGINT NOT NULL DEFAULT 0 COMMENT 'If non zero, this means the trace uses 128 bit traceIds instead of 64 bit',
  `trace_id` BIGINT NOT NULL,
  `id` BIGINT NOT NULL,
  `name` VARCHAR(255) NOT NULL,
  `remote_service_name` VARCHAR(255),
  `parent_id` BIGINT,
  `debug` BIT(1),
  `start_ts` BIGINT COMMENT 'Span.timestamp(): epoch micros used for endTs query and to implement TTL',
  `duration` BIGINT COMMENT 'Span.duration(): micros used for minDuration and maxDuration query',
  PRIMARY KEY (`trace_id_high`, `trace_id`, `id`)
) ENGINE=InnoDB ROW_FORMAT=COMPRESSED CHARACTER SET=utf8 COLLATE utf8_general_ci;

ALTER TABLE zipkin_spans ADD INDEX(`trace_id_high`, `trace_id`) COMMENT 'for getTracesByIds';
ALTER TABLE zipkin_spans ADD INDEX(`name`) COMMENT 'for getTraces and getSpanNames';
ALTER TABLE zipkin_spans ADD INDEX(`remote_service_name`) COMMENT 'for getTraces and getRemoteServiceNames';
ALTER TABLE zipkin_spans ADD INDEX(`start_ts`) COMMENT 'for getTraces ordering and range';

CREATE TABLE IF NOT EXISTS zipkin_annotations (
  `trace_id_high` BIGINT NOT NULL DEFAULT 0 COMMENT 'If non zero, this means the trace uses 128 bit traceIds instead of 64 bit',
  `trace_id` BIGINT NOT NULL COMMENT 'coincides with zipkin_spans.trace_id',
  `span_id` BIGINT NOT NULL COMMENT 'coincides with zipkin_spans.id',
  `a_key` VARCHAR(255) NOT NULL COMMENT 'BinaryAnnotation.key or Annotation.value if type == -1',
  `a_value` BLOB COMMENT 'BinaryAnnotation.value(), which must be smaller than 64KB',
  `a_type` INT NOT NULL COMMENT 'BinaryAnnotation.type() or -1 if Annotation',
  `a_timestamp` BIGINT COMMENT 'Used to implement TTL; Annotation.timestamp or zipkin_spans.timestamp',
  `endpoint_ipv4` INT COMMENT 'Null when Binary/Annotation.endpoint is null',
  `endpoint_ipv6` BINARY(16) COMMENT 'Null when Binary/Annotation.endpoint is null, or no IPv6 address',
  `endpoint_port` SMALLINT COMMENT 'Null when Binary/Annotation.endpoint is null',
  `endpoint_service_name` VARCHAR(255) COMMENT 'Null when Binary/Annotation.endpoint is null'
) ENGINE=InnoDB ROW_FORMAT=COMPRESSED CHARACTER SET=utf8 COLLATE utf8_general_ci;

ALTER TABLE zipkin_annotations ADD UNIQUE KEY(`trace_id_high`, `trace_id`, `span_id`, `a_key`, `a_timestamp`) COMMENT 'Ignore insert on duplicate';
ALTER TABLE zipkin_annotations ADD INDEX(`trace_id_high`, `trace_id`, `span_id`) COMMENT 'for joining with zipkin_spans';
ALTER TABLE zipkin_annotations ADD INDEX(`trace_id_high`, `trace_id`) COMMENT 'for getTraces/ByIds';
ALTER TABLE zipkin_annotations ADD INDEX(`endpoint_service_name`) COMMENT 'for getTraces and getServiceNames';
ALTER TABLE zipkin_annotations ADD INDEX(`a_type`) COMMENT 'for getTraces and autocomplete values';
ALTER TABLE zipkin_annotations ADD INDEX(`a_key`) COMMENT 'for getTraces and autocomplete values';
ALTER TABLE zipkin_annotations ADD INDEX(`trace_id`, `span_id`, `a_key`) COMMENT 'for dependencies job';

CREATE TABLE IF NOT EXISTS zipkin_dependencies (
  `day` DATE NOT NULL,
  `parent` VARCHAR(255) NOT NULL,
  `child` VARCHAR(255) NOT NULL,
  `call_count` BIGINT,
  `error_count` BIGINT,
  PRIMARY KEY (`day`, `parent`, `child`)
) ENGINE=InnoDB ROW_FORMAT=COMPRESSED CHARACTER SET=utf8 COLLATE utf8_general_ci;
- Zipkin Server, pom file introduces related dependencies
 <dependency>
            <groupId>io.zipkin.java</groupId>
            <artifactId>zipkin-autoconfigure-storage-mysql</artifactId>
            <version>2.12.3</version>
        </dependency>
        <dependency>
            <groupId>mysql</groupId>
            <artifactId>mysql-connector-java</artifactId>
        </dependency>
        <dependency>
            <groupId>com.alibaba</groupId>
            <artifactId>druid-spring-boot-starter</artifactId>
            <version>1.1.10</version>
        </dependency>
        <dependency>
            <groupId>org.springframework</groupId>
            <artifactId>spring-tx</artifactId>
        </dependency>
        <dependency>
            <groupId>org.springframework</groupId>
            <artifactId>spring-jdbc</artifactId>
        </dependency>
- Modify configuration file
spring:
  datasource:
    driver-class-name: com.mysql.jdbc.Driver
    url: jdbc:mysql://localhost:3306/zipkin?useUnicode=true&characterEncoding=utf-8&useSSL=false&allowMultiQueries=true&serverTimezone=UTC
    username: root
    password: root
    druid:
      initialSize: 10
      minIdle: 10
      maxActive: 30
      maxWait: 50000
# 指定zipkin持久化介质为mysql
zipkin:
  storage:
    type: mysql
- Inject the transaction manager into the startup class
@Bean
public PlatformTransactionManager txManager(DataSource dataSource) {


 return new DataSourceTransactionManager(dataSource);
}
- Start service verification persistence