1. Introduction to JVM
1.1 What is JVM?
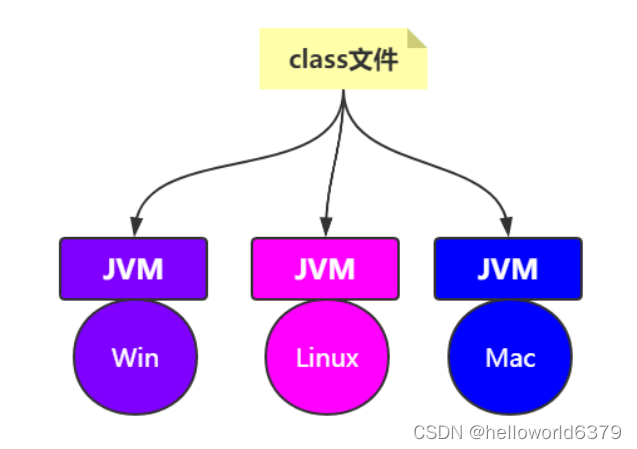
Java Virtual Machine (Java Virtual Machine)
Write Once Run Anywhere
1.2 JDK JRE JVM
Java official website: https://docs.oracle.com/javase/8/
Reference -> Developer Guides -> Navigate to:
https://docs.oracle.com/javase/8/docs/index.html
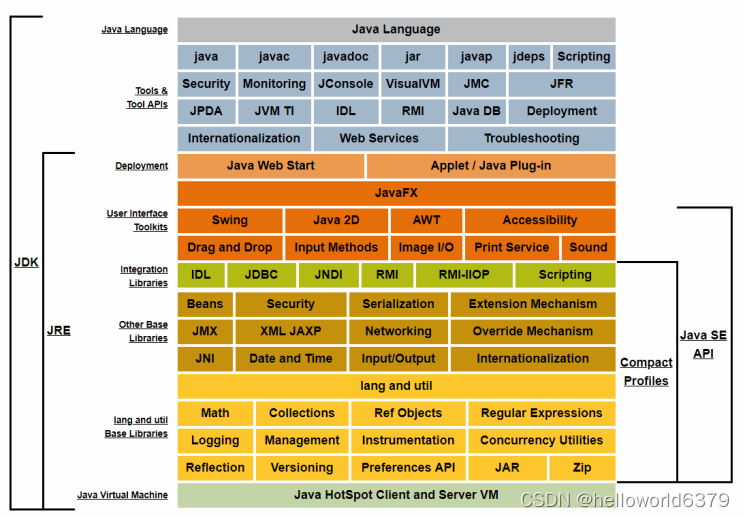
JDK 8 is a superset of JRE 8, and contains everything that is in JRE 8, plus
tools such as the compilers and debuggers necessary for developing applets and applications. JRE 8 provides the libraries, the Java Virtual Machine (JVM), and other components to run applets and applications written in the Java programming language. Note that the JRE includes components not required by the Java SE specification, including both standard and non-standard Java components.
Two JVM operating mechanism
2.1 Source code to class files
2.1.1 Source code demo
class Person{


	private String name="刘同学";
	private int age;
	private final double salary=100;
	private static String address;
	private final static String hobby="Programming";
	private static Object obj=new Object();
	public void say(){


		System.out.println("person say...");
	}
	public static int calc(int op1,int op2){


	op1=3;
	int result=op1+op2;
	Object obj=new Object();
		return result;
	}
	public static void main(String[] args){


		calc(1,2);
	}
}
Compile: javac -g:vars Person.java —> Person.class
2.1.2 Pre-compilation
Person.java -> Lexical Analyzer -> tokens stream -> Syntax Analyzer -> Syntax Tree/Abstract Syntax Tree
-> Semantic Analyzer -> Annotation Abstract Syntax Tree -> Bytecode Generator -> Person.class file
2.1.3 Class files (Class files)
2.1.3.1 Hexadecimal
cafe babe 0000 0034 003f 0a00 0a00 2b08
002c 0900 0d00 2d06 4059 0000 0000 0000
0900 0d00 2e09 002f 0030 0800 310a 0032
0033 0700 340a 000d 0035 0900 0d00 3607
0037 0100 046e 616d 6501 0012 4c6a 6176
612f 6c61 6e67 2f53 7472 696e 673b 0100
0361 6765 0100 0149 0100 0673 616c 6172
7901 0001 4401 000d 436f 6e73 7461 6e74
…
2.1.3.2 The ClassFile Structure
Official website: https://docs.oracle.com/javase/specs/jvms/se8/html/jvms-4.html
ClassFile {
u4 magic;
u2 minor_version;
u2 major_version;
u2 constant_pool_count;
cp_info constant_pool[constant_pool_count-1];
u2 access_flags;
u2 this_class;
u2 super_class;
u2 interfaces_count;
u2 interfaces[interfaces_count];
u2 fields_count;
field_info fields[fields_count];
u2 methods_count;
method_info methods[methods_count];
u2 attributes_count;
attribute_info attributes[attributes_count];
}
2.1.3.3 Simple analysis
u4 :cafebabe
magic:The magic item supplies the magic number identifying the class file
format
u2+u2:0000+0034, 34 is equal to 52 in decimal, which means JDK8
minor_version
major_version
u2:003f=63 (decimal system)
constant_pool_count:
The value of the constant_pool_count item is equal to the number of entries
in the constant_pool table plus one.
Indicates that the number in the constant pool is 62
cp_info constant_pool[constant_pool_count-1]
The constant_pool is a table of structures representing various string constants, class and interface names, field names, and other constants that are referred to within the ClassFile structure and its substructures. The format of each constant_pool table entry is indicated by its first “tag” byte.
The constant_pool table is indexed from 1 to constant_pool_count - 1.
The constant pool mainly stores two aspects: Literal and Symbolic References
Literal quantity: text string, final modification, etc.
Symbol reference: fully qualified name of class and interface, field name and descriptor, method name and descriptor
2.1.3.4 javap verification
Commands that come with the JDK
javap -h
You can verify the correctness of the first few pieces of the above Classfile Structure
javap -v -p Person.class to decompile, view information such as bytecode information and instructions
Do you have a feeling?
Compared with class files, JVM can be understood as an operating system; compared with JVM, class files can be understood as assembly language or machine language.
2.1.3.5 Continous analysis
The above analysis shows that the number of constants in the constant pool is 62. Next, let’s analyze these 62 constants in detail. cp_info constant_pool[constant_pool_count-1] is the information included in this piece. cp_info is actually in the form of a table. All constant_pool table entries have
the following general format:
cp_info{
u1tag;
u1info[];
}
Official website: https://docs.oracle.com/javase/specs/jvms/se8/html/jvms-4.html#jvms-4.4
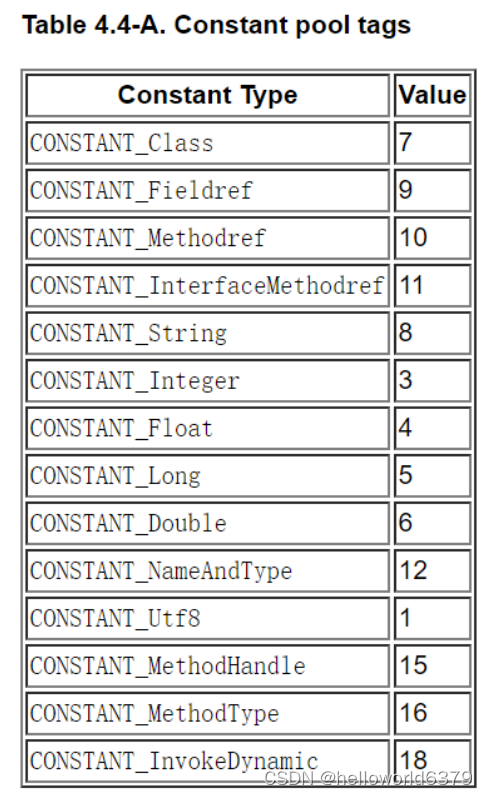
(1) Count down a u1 , that is, 0a->10: it represents CONSTANT_Methodref, indicating that this is a method reference
CONSTANT_Fieldref_info {
u1 tag;
u2 class_index;
u2 name_and_type_index;
}
Count down u2 and u2
u2, that is, 00 0a->10: represents class_index, indicating the index
u2 of the class to which the method belongs in the constant pool, that is, 00 2b->43: represents name_and_type_index, indicating the method’s Index of names and types
#1 = Methodref #10,#43
(2) Count down u1 , that is, 08->8: it means CONSTANT_String, which means the string type
CONSTANT_String_info {
u1 tag;
u2 string_index;
}
Count down u2
u2, that is, 00 2c->44: represents string_index
#1 = Methodref #10,#43
#2 = String #44
(3) Count down u1 , that is, 09->9: it means CONSTANT_Fieldref, which means the field type
CONSTANT_Fieldref_info {
u1 tag;
u2 class_index;
u2 name_and_type_index;
}
Count down u2 and u2
u2, that is, 00 0d->13: represents class_index
u2, that is, 00 2d->45: represents name_and_type_index
#1 = Methodref #10.#43
#2 = String #44
#3 = Fieldref #13.#45
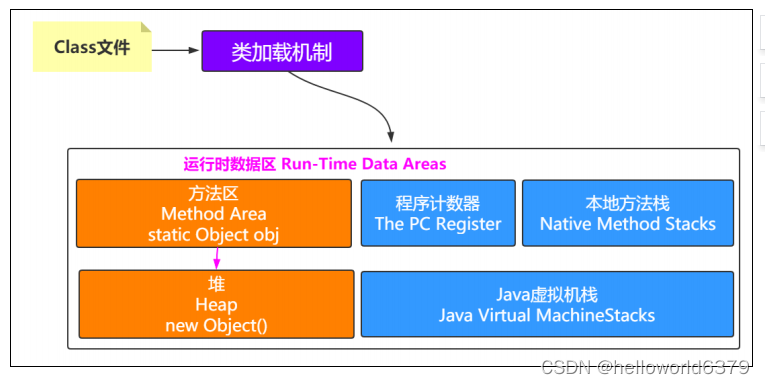
2.2 Class file to virtual machine (class loading mechanism)
The so-called class loading mechanism is
The virtual machine loads the Class file into memory
and verifies the data, converts, parses, and initializes
to form a Java type that can be directly used by the virtual machine, namely java.lang.Class
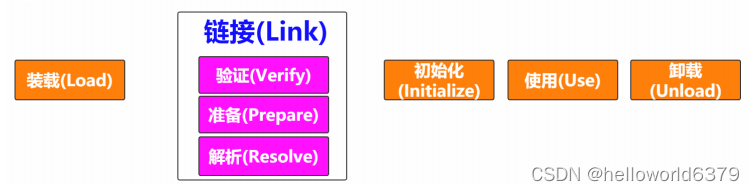
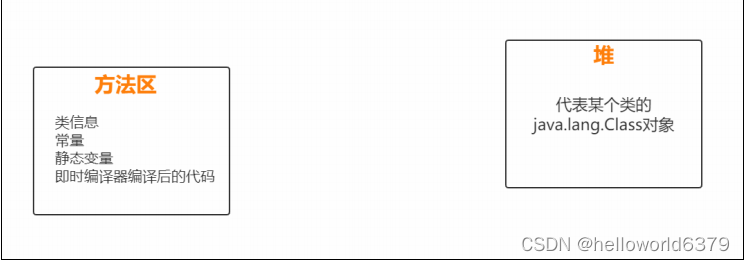
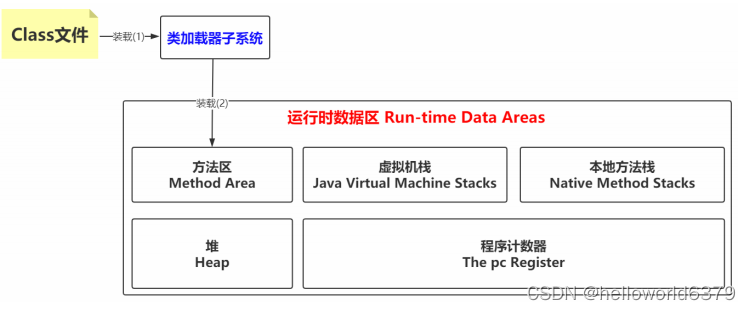
2.2.1 Loading
Find and import class files
(1) Obtain the binary byte stream defining this class through the fully qualified name of a class
(2) Convert the static storage structure represented by this byte stream into the runtime data structure of the method area
(3) Generate a java.lang.Class object representing this class in the Java heap as an access entry to the data in the method area
The Class object encapsulates the data structure of the class in the method area, and provides Java programmers with an interface to access the data structure in the method area. Generate a java.lang.Class object representing this class in
the Java heap as an access entry to the data in the method area
2.2.2 Link
2.2.2.1 Verify
Ensure the correctness of loaded classes
File Format Validation
Metadata Validation
Bytecode Validation
Symbol Reference Validation
2.2.2.2 Prepare
Allocate memory for static variables of the class and initialize them to default values
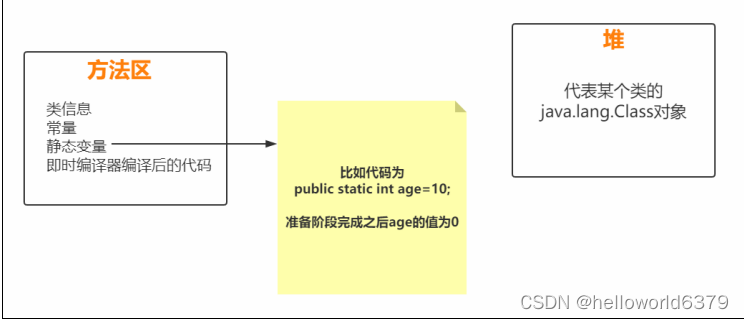
public class Demo1 {


	private static int i;
	public static void main(String[] args) {


		// 正常打印出0,因为静态变量i在准备阶段会有默认值0
		System.out.println(i);
	}
}
public class Demo2 {


	public static void main(String[] args) {


		// 编译通不过,因为局部变量没有赋值不能被使用
		int i;
		System.out.println(i);
	}
}
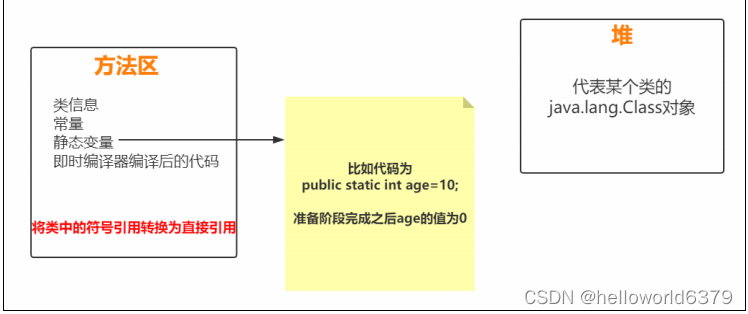
2.2.2.3 Resolve
Convert symbolic references in classes to direct references
A symbol reference is a set of symbols to describe the target, which can be any literal.
A direct reference is a pointer directly to the target, a relative offset, or a handle that indirectly locates the target.
The parsing phase is the process in which the virtual machine replaces symbolic references in the constant pool with direct references.
The parsing action is mainly performed on 7 types of symbol references of class or interface, field, class method, interface method, method type, method handle and call qualifier.
2.2.3 Initialize
Perform initialization operations on static variables and static code blocks of the class
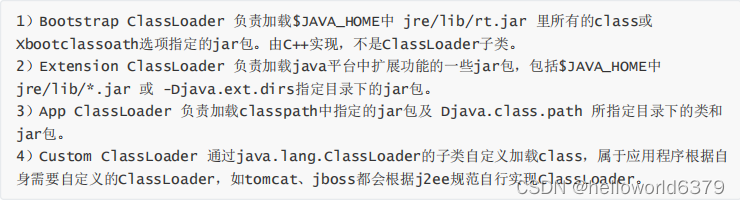
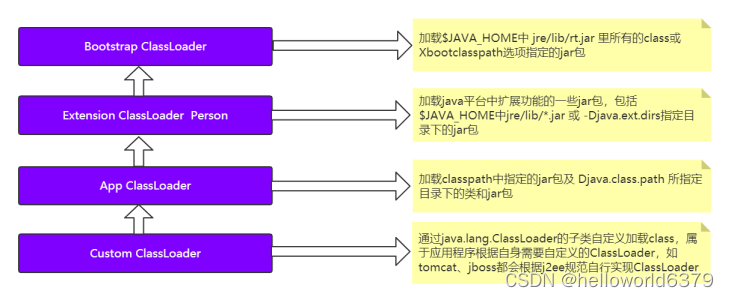
2.2.4 Class Loader ClassLoader
In the loading (Load) stage, the step (1): obtain the binary byte stream defined by the fully qualified name of the class, which needs to be completed with the help of a class loader. As the name suggests, it is used to load the Class file.
2.2.4.1 Classification
2.2.4.2 Diagram
public class Demo3 {


	public static void main(String[] args) {


	// App ClassLoader
	System.out.println(new Worker().getClass().getClassLoader());
	// Ext ClassLoader
	System.out.println(new
	Worker().getClass().getClassLoader().getParent());
	// Bootstrap ClassLoader
	System.out.println(new
	Worker().getClass().getClassLoader().getParent().getParent());
	System.out.println(new String().getClass().getClassLoader());
	}
}
sun.misc.Launcher$AppClassLoader@18b4aac2
sun.misc.Launcher$ExtClassLoader@3a71f4dd
null
null
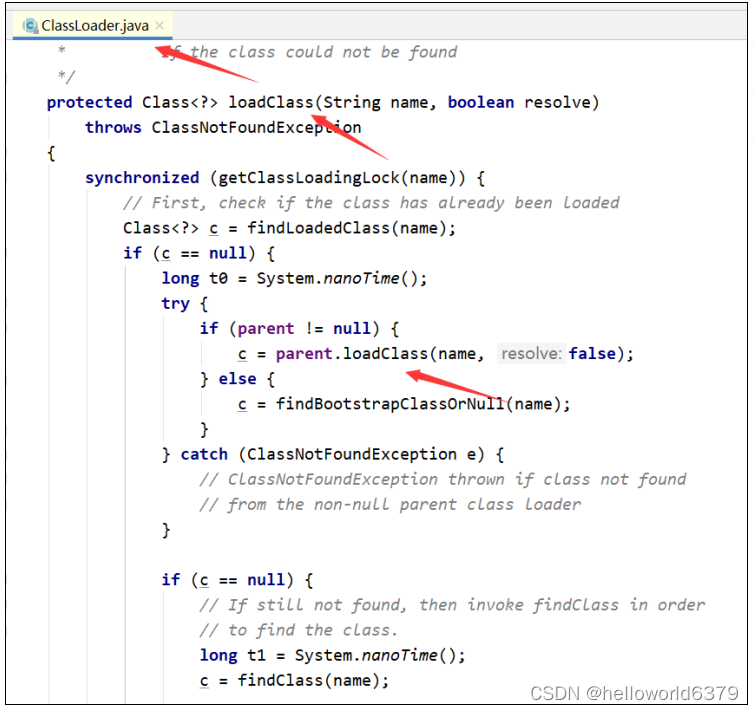
2.2.4.3 Loading principle [parent delegation]
(1) Check whether a certain class has been loaded.
From bottom to top, check layer by layer from Custom ClassLoader to BootStrap ClassLoader. As long as a certain Classloader has been loaded, it is considered to have loaded this class, ensuring that this class is only loaded once by all ClassLoaders.
(2) The order of loading
is top-down, that is, the upper layer tries to load this class layer by layer.
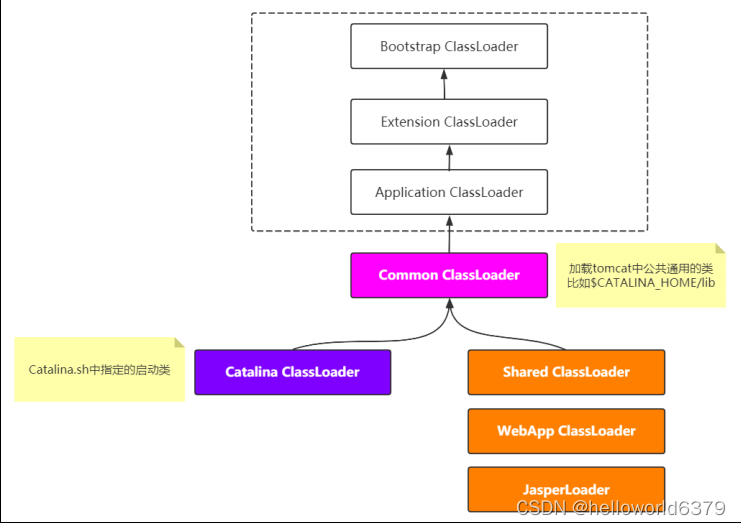
2.2.4.4 Breaking Parental Delegation
(1)tomcat
(2) SPI mechanism
(3) OSGi
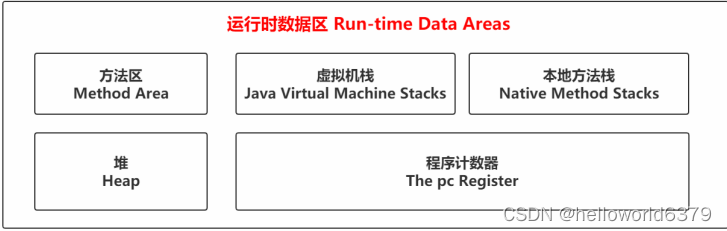
2.3 Run-Time Data Areas
In steps (2) and (3) of the loading phase, it can be found that there are nouns such as runtime data, heap, and method area. (
2) Convert the static storage structure represented by this byte stream into the runtime data structure of the method area
( 3) Generate a java.lang.Class object representing this class in the Java heap as an access entry to the data in the method area. To put it
bluntly, after the class file is loaded by the class loader, the contents of the class (such as variables, Constants, methods, objects and other data must have a place to go, that is, to be stored, and the storage location must have a corresponding space in the JVM)
2.3.1 Overview of the official website
Official website: https://docs.oracle.com/javase/specs/jvms/se8/html/index.html
The Java Virtual Machine defines various run-time data areas that are used during execution of a program. Some of these data areas are created on Java Virtual Machine start-up and are destroyed only when the Java Virtual Machine exits. Other data areas are per thread. Per-thread data areas are created when a thread is created and destroyed when the thread exits.
2.3.2 Diagram
Each run-time constant pool is allocated from the Java Virtual Machine’s method area (§2.5.4).s
2.3.3 Initial understanding
2.3.3.1 Method Area
(1) The method area is a memory area shared by each thread, which is created when the virtual machine starts
The Java Virtual Machine has a method area that is shared among all Java Virtual Machine threads.The method area is created on virtual machine start-up.
(2) Although the Java virtual machine specification describes the method area as a logical part of the heap, it has another alias called Non-Heap (non-heap), which aims to distinguish it from the Java heap
Although the method area is logically part of the heap,…
(3) Used to store data such as class information, constants, static variables, code compiled by a real-time compiler, etc. that have been loaded by the virtual machine
It stores per-class structures such as the run-time constant pool, field and
method data, and the code for methods and constructors, including the special methods (§2.9) used in class and instance initialization and interface
initialization.
(4) When the method area cannot meet the memory allocation requirements, an OutOfMemoryError exception will be thrown
If memory in the method area cannot be made available to satisfy an allocation request, the Java Virtual Machine throws an OutOfMemoryError.
Noteworthy
The JVM runtime data area is a specification, and the real implementation
is Metaspace in JDK 8, and Perm Space in JDK6 or 7
2.3.3.2 Heap (heap)
(1) The Java heap is the largest piece of memory managed by the Java virtual machine. It is created when the virtual machine starts and is shared by all threads.
(2) Java object instances and arrays are allocated on the heap.
The Java Virtual Machine has a heap that is shared among all Java Virtual Machine
threads. The heap is the run-time data area from which memory for all class
instances and arrays is allocated.
The heap is created on virtual machine start-up.
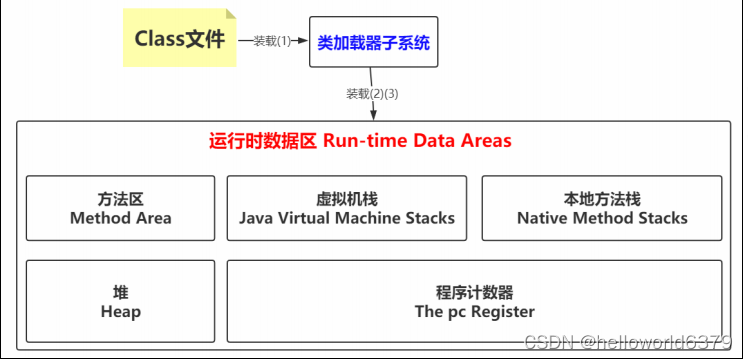
At this time, look back at the third step of the loading phase, and generate a java.lang.Class object representing this class in the Java heap as an access entry for these data in the method area
At this time, the picture of loading (1)(2)(3) can be changed
2.3.3.3 Java Virtual Machine Stacks (virtual machine stack)
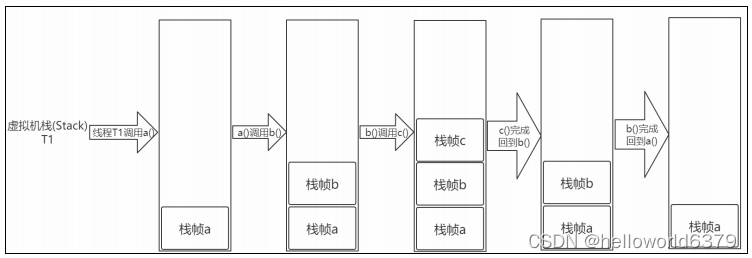
(1) The virtual machine stack is an area where a thread executes, which saves the calling state of a method in a thread. In other words, the running state of a Java thread is saved by a virtual machine stack, so the virtual machine stack must be thread-private, unique, and created with the creation of the thread.
Each Java Virtual Machine thread has a private Java Virtual Machine stack,created at the same time as the thread.
(2) Each method executed by a thread is a stack frame in the stack, that is, each method corresponds to a stack frame.
When a method is called, a stack frame will be pushed into the stack; when a method call is completed, the stack frame will be popped from the stack.
A Java Virtual Machine stack stores frames (§2.6).
A new frame is created each time a method is invoked. A frame is
destroyed when its method invocation completes.
Graphical stacks and stack frames
void a(){


 b();
}
void b(){


 c();
}
void c(){


}
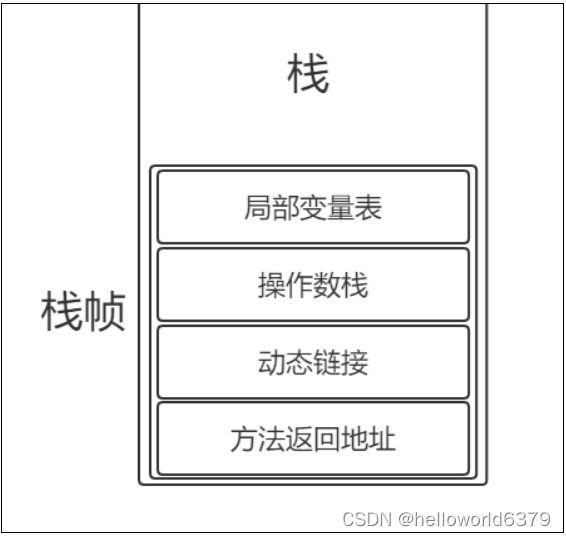
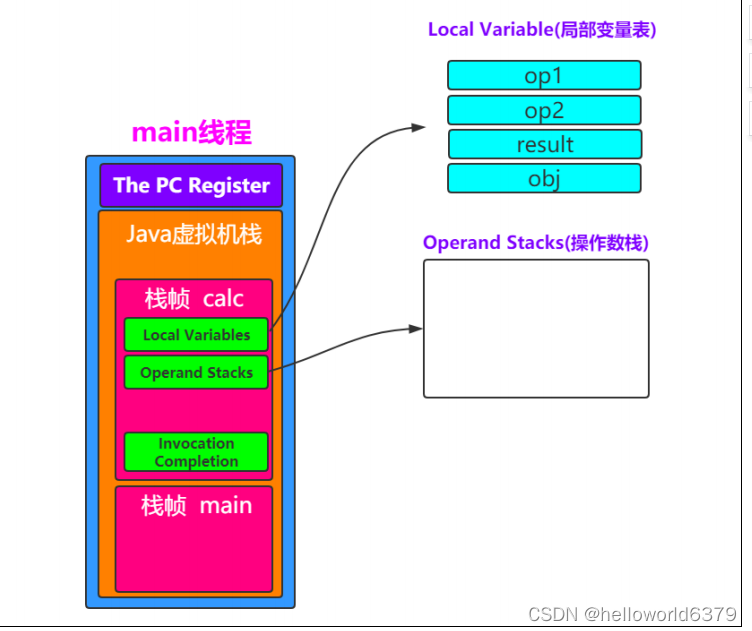
Stack frame
official website: https://docs.oracle.com/javase/specs/jvms/se8/html/jvms-2.html#jvms-2.6
Stack frame: Each stack frame corresponds to a called method, which can be understood as the running space of a method.
Each stack frame includes local variable table (Local Variables), operand stack (Operand Stack), reference to the run-time constant pool (Areference to the run-time constant pool), method return address (Return Address) and additional information .
Local variable table: The local variables defined in the method and the parameters of the method are stored in this table.
The variables in the local variable table cannot be used directly. If they need to be used, they must be loaded into the operand stack through relevant instructions and used as operands.
Operand stack: Store operands in the form of push and pop
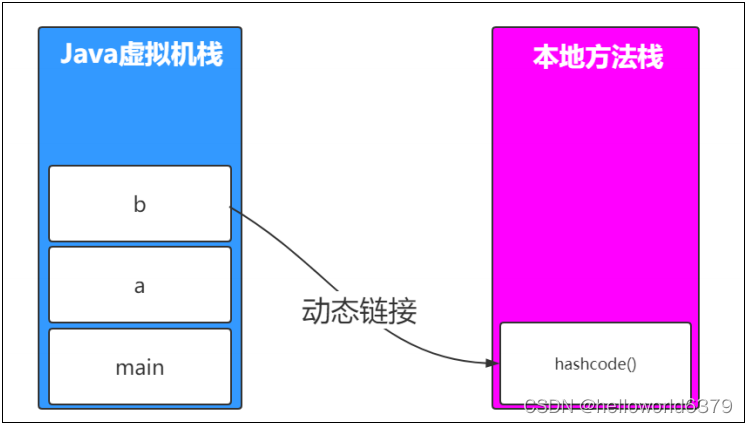
Dynamic linking: Each stack frame contains a reference to the method to which the stack frame belongs in the runtime constant pool. This reference is held to support dynamic linking (Dynamic Linking) during the method call.
Method return address: When a method starts to execute, there are only two ways to exit, one is to encounter the bytecode instruction returned by the method; the other is to encounter an exception, and the exception is not handled in the method body.
Combined with bytecode instructions to understand the stack frame
javap -c Person.class > Person.txt
Compiled from "Person.java"
class Person {


...
public static int calc(int, int);
Code:
0: iconst_3 //将int类型常量3压入[操作数栈]
1: istore_0 //将int类型值存入[局部变量0]
2: iload_0 //从[局部变量0]中装载int类型值入栈
3: iload_1 //从[局部变量1]中装载int类型值入栈
4: iadd //将栈顶元素弹出栈,执行int类型的加法,结果入栈
5: istore_2 //将栈顶int类型值保存到[局部变量2]中
6: iload_2 //从[局部变量2]中装载int类型值入栈
7: ireturn //从方法中返回int类型的数据
...
}
Thinking: Is the value of index 0 or 1
On class method invocation, any parameters are passed in consecutive local variables starting from local variable 0. On instance method invocation, local variable 0 is always used to pass a reference to the object on which the instance method is being invoked (this in the Java programming language). Any parameters are subsequently passed in consecutive local variables starting from local variable 1.
2.3.3.4 The pc Register (program counter)
We all know that there are multiple threads executing in a JVM process, and whether the content in the thread can have execution rights is based on CPU scheduling.
If thread A is executing somewhere, suddenly loses the execution right of the CPU, and switches to thread B, then when thread A obtains the
execution right of the CPU again, how can it continue to execute? This is the need to maintain a variable in the thread to record where the thread is executed.
If the thread is executing a Java method, the counter records the address of the virtual machine bytecode instruction being executed;
if the Native method is being executed, the counter is empty.
The Java Virtual Machine can support many threads of execution at once (JLS §17).Each Java Virtual Machine thread has its own pc (program counter) register. At any point, each Java Virtual Machine thread is executing the code of a single method, namely the current method (§2.6) for that thread. If that method is not native, the pc register contains the address of the Java Virtual Machine
instruction currently being executed. If the method currently being executed by the thread is native, the value of the Java Virtual Machine’s pc register is undefined. The Java Virtual Machine’s pc register is wide enough to hold a returnAddress or a native pointer on the specific platform.
2.3.3.5 Native Method Stacks (local method stack)
If the methods executed by the current thread are of Native type, these methods will be executed in the native method stack.
So what if the native method is called when the Java method is executed?
2.3.4 Toss
2.3.4.1 Stack points to heap
If there is a variable in the stack frame, the type is a reference type, such as Object obj=new Object(), then it is a typical element in the stack pointing to the object in the heap.

2.3.4.2 The method area points to the heap
Static variables, constants and other data are stored in the method area. If this is the case, the elements in the typical method area point to objects in the heap.
private static Object obj=new Object();
2.3.4.3 The heap points to the method area
Can the heap still point to the method area?
Note that the method area will contain class information, and there will be objects in the heap, so how do you know which class created the object?

Thinking:
How does an object know which class it was created from? How to record it? This requires understanding the specific information of a Java object.
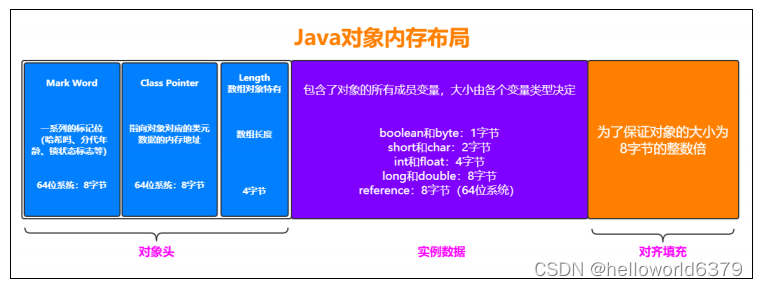
2.3.4.4 Java object memory model
A Java object consists of 3 parts in memory: object header, instance data and alignment padding
2.4 JVM memory model
2.4.1 and runtime data area
The above describes a lot about the runtime data area. In fact, the focus of data storage is the heap and the method area (not the heap), so the memory design also focuses on these two areas (note that these two areas are shared by threads).
For the virtual machine stack, the native method stack, and the program counter are all thread-private.
It can be understood that the JVM runtime data area is a specification, and the JVM memory model is the implementation of the specification
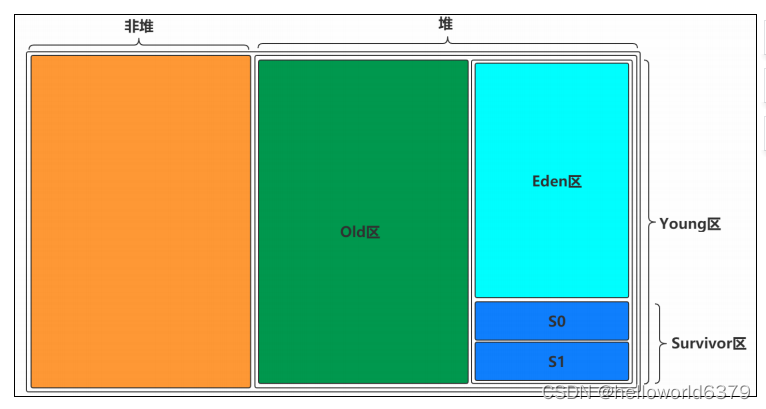
2.4.2 Graphic display
One is the non-heap area and the other is the heap area. The heap
area is divided into two blocks, one is the Old area and the other is the Young area. The Young area is
divided into two blocks, one is the Survivor area (S0+S1), and the other is the Eden area.
S0 and S1 are the same Large, can also be called From and To
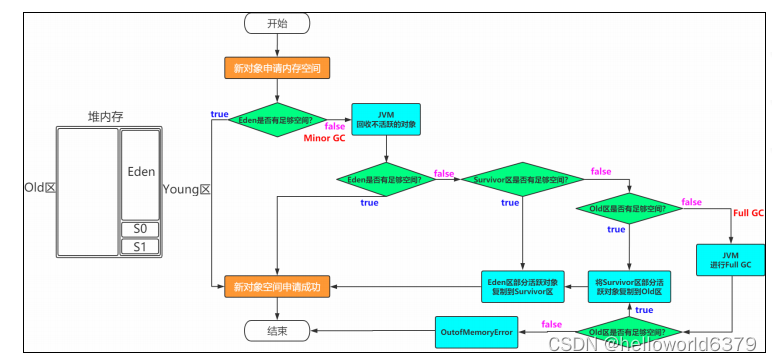
2.4.3 Object creation process
In general, newly created objects will be allocated to the Eden area, and some special large objects will be directly allocated to the Old area.
I am an ordinary Java object, I was born in Eden District, and I also saw my little brother who looks very similar to me in Eden District, and we played in Eden District for quite a long time. One day there were too many people in the Eden area, so I was forced to go to the "From" area of the Survivor area. Since I went to the Survivor area, I started drifting. Sometimes in the "From" area of Survivor, there are At that time, I was in the "To" area of Survivor, living in no fixed place. Until I was 18 years old, my father said that I was an adult and it was time to break into the society. So I went to the old generation. There are many people in the old generation, and they are all quite old.
2.4.4 Frequently asked questions
How to understand Minor/Major/Full GC
Minor GC: new generation
Major GC: old generation
Full GC: new generation + old generation
Why do you need the Survivor area? Isn't it just Eden?
If there is no Survivor, every time a Minor GC is performed in the Eden area, the surviving objects will be sent to the old age.
In this way, the old age is quickly filled and Major GC is triggered (because Major GC is usually accompanied by Minor GC, which can also be regarded as triggering Full GC).
The memory space of the old generation is much larger than that of the new generation, and it takes much longer to perform a Full GC than a Minor GC.
What is the disadvantage of long execution time? Frequent Full GC consumes a long time, which will affect the execution and response speed of large programs.
You might say, then increase or decrease the space in the old generation.
If the old generation space is increased, more surviving objects can fill the old generation. Although the frequency of Full GC is reduced, as the space in the old age increases, once a Full GC occurs, it will take longer to execute.
If the old generation space is reduced, although the time required for Full GC is reduced, the old generation will soon be filled with surviving objects, and the frequency of Full GC will increase.
Therefore, the existence significance of Survivor is to reduce the number of objects sent to the old generation, thereby reducing the occurrence of Full GC. Survivor's pre-screening guarantees that only objects that can survive in the new generation after 16 Minor GCs will be sent to the new generation. old age.
Why do we need two Survivor zones?
最大的好处就是解决了碎片化。也就是说为什么一个Survivor区不行?第一部分中,我们知道了必须设置
Survivor区。假设现在只有一个Survivor区,我们来模拟一下流程:
刚刚新建的对象在Eden中,一旦Eden满了,触发一次Minor GC,Eden中的存活对象就会被移动到Survivor
区。这样继续循环下去,下一次Eden满了的时候,问题来了,此时进行Minor GC,Eden和Survivor各有一些
存活对象,如果此时把Eden区的存活对象硬放到Survivor区,很明显这两部分对象所占有的内存是不连续的,
也就导致了内存碎片化。
永远有一个Survivor space是空的,另一个非空的Survivor space无碎片。
Why is Eden:S1:S2 8:1:1 in the new generation?
Available memory in the new generation: the memory guaranteed by the copy algorithm is 9:1. The
Eden:S1 area in the available memory is 8:1,
that is, Eden:S1:S2 = 8:1:1 in the new generation.
Modern commercial virtual machines are Using this collection algorithm to recycle the new generation, IBM's special research shows that about 98% of the objects in the new generation are
"live and die".
Is the heap memory an area shared by threads?
By default, the JVM opens up a buffer area on Eden for each thread to accelerate the allocation of objects, called TLAB, full name: Thread
Local Allocation Buffer.
Objects are first allocated on TLAB, but the TLAB space is usually relatively small. If the object is relatively large, it is still allocated in the shared area.
2.4.5 Experience and Verification
2.4.5.1 Using visualvm
Visualgc plugin download link: https://visualvm.github.io/pluginscenters.html
Select the corresponding JDK version link—>Tools—>Visual GC
If the above link cannot find a suitable one, you can also download the corresponding version online
2.4.5.2 Heap memory overflow
the code
@RestController
public class HeapController {


	List<Person> list=new ArrayList<Person>();
	@GetMapping("/heap")
	public String heap(){


		while(true){


			list.add(new Person());
		}
	}
}
Remember to set parameters such as -Xmx20M -Xms20M
running results
Visit: http://localhost:8080/heap
Exception in thread “http-nio-8080-exec-2” java.lang.OutOfMemoryError: GC overhead limit exceeded
2.4.5.3 Memory overflow in the method area
For example, add Class information asm dependencies and Class codes to the method area
<dependency>
	<groupId>asm</groupId>
	<artifactId>asm</artifactId>
	<version>3.3.1</version>
</dependency>
public class MyMetaspace extends ClassLoader {


	public static List<Class<?>> createClasses() {


	List<Class<?>> classes = new ArrayList<Class<?>>();
	for (int i = 0; i < 10000000; ++i) {


		ClassWriter cw = new ClassWriter(0);
		cw.visit(Opcodes.V1_1, Opcodes.ACC_PUBLIC, "Class" + i, null,
		"java/lang/Object", null);
		MethodVisitor mw = cw.visitMethod(Opcodes.ACC_PUBLIC, "<init>",
		"()V", null, null);
		mw.visitVarInsn(Opcodes.ALOAD, 0);
		mw.visitMethodInsn(Opcodes.INVOKESPECIAL, "java/lang/Object",
		"<init>", "()V");
		mw.visitInsn(Opcodes.RETURN);
		mw.visitMaxs(1, 1);
		mw.visitEnd();
		Metaspace test = new Metaspace();
		byte[] code = cw.toByteArray();
		Class<?> exampleClass = test.defineClass("Class" + i, code, 0,
		code.length);
		classes.add(exampleClass);
		}
	return classes;
	}
}
the code
@RestController
public class NonHeapController {


	List<Class<?>> list=new ArrayList<Class<?>>();
	@GetMapping("/nonheap")
	public String nonheap(){


		while(true){


			list.addAll(MyMetaspace.createClasses());
		}
	}
}
Set the size of Metaspace, such as -XX:MetaspaceSize=50M -XX:MaxMetaspaceSize=50M
running results
visit ->http://localhost:8080/nonheap
java.lang.OutOfMemoryError: Metaspace at
java.lang.ClassLoader.defineClass1(Native Method) ~[na:1.8.0_191] at
java.lang.ClassLoader.defineClass(ClassLoader.java:763) ~[na:1.8.0_191]
2.4.5.4 Virtual machine stack
Code DemonstrationStackOverFlow
public class StackDemo {


	public static long count=0;
	public static void method(long i){


	System.out.println(count++);
		method(i);
	}
	public static void main(String[] args) {


		method(1);
	}
}
operation result
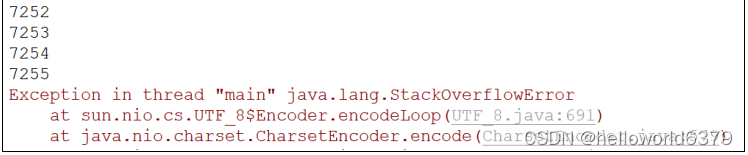
illustrate
Stack Space is used to push into Stack Frame (stack frame) when making recursive calls of methods. So when the recursive call is too deep, it is possible to run out of Stack Space and cause a StackOverflow error.
-Xss128k: Set the stack size for each thread. After JDK 5, the stack size of each thread is 1M, and the stack size of each thread was 256K before.Adjust according to the memory size required by the application's threads. Under the same physical memory, reducing this value can generate more threads. However, the operating system still has a limit on the number of threads in a process, and it cannot be generated infinitely. The experience value is around 3000~5000.
The size of the thread stack is a double-edged sword. If it is set too small, stack overflow may occur, especially when there are recursion and large loops in the thread, the possibility of overflow is greater. If the value is set too large, there will be Affects the number of stacks created. If it is a multi-threaded application, a memory overflow error will occur.
2.5 Garbage Collect (garbage collection)
It was said before that there is garbage collection in the heap memory, such as Minor GC in the Young area, Major GC in the Old area, and Full GC in the Young area and the Old area.
But for an object, how can it be determined that it is garbage? Does it need to be recycled? How to recycle it? We still need to explore these issues in detail.
Because Java automatically performs memory management and garbage collection, if you do not understand all aspects of garbage collection, it will be difficult
for us garbage collection mechanism is to find objects in the Java heap and process them Classify and judge,
find out the objects that are in use and the objects that are no longer used, and then clear those objects that will not be used from the heap.
2.5.1 How to determine if an object is garbage?
To perform garbage collection, you must first know what kind of objects are garbage.
2.5.1.1 Reference Counting
For an object, as long as the application holds a reference to the object, it means that the object is not garbage. If an object does not have any pointer references to it, it is garbage.
Disadvantage : If AB holds references to each other, it will never be recycled.
2.5.1.2 Accessibility analysis
Through the object of GC Root, start looking down to see if an object is reachable
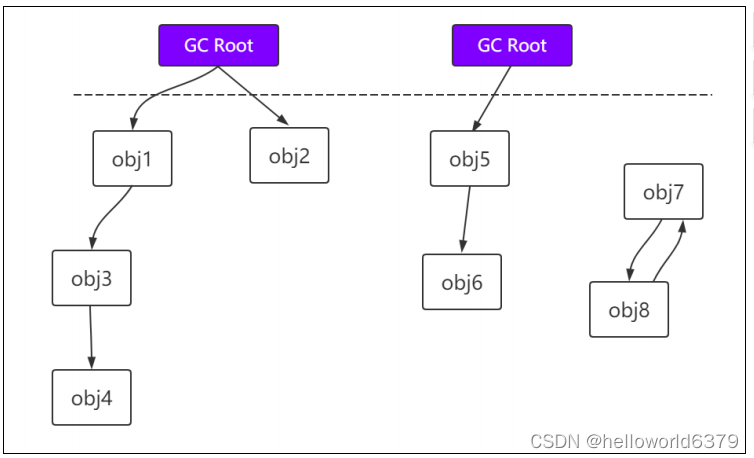
Can be used as GC Root: class loader, Thread, local variable table of virtual machine stack, static members, constant references,
variables of local method stack, etc.
Objects referenced in the virtual machine stack (local variable table in the stack frame).
The object referenced by the class static property in the method area.
The object referenced by the constant in the method area.
The object referenced by JNI (that is, the Native method in general) in the local method stack.
2.5.2 When will garbage collection occur?
GC is automatically completed by the JVM, depending on the JVM system environment, so the timing is uncertain.
Of course, we can manually perform garbage collection, such as calling the System.gc() method to notify the JVM to perform a garbage collection, but we
cannot control when it will run. That is to say, System.gc() is just a notice to recycle, and when to recycle is determined by the JVM
. However, it is not recommended to call this method manually, because the resources consumed by GC are relatively large.
(1) When the Eden area or S area is not enough
(2) The old generation space is not enough
(3) The method area is not enough
(4) System.gc()
2.5.3 Garbage collection algorithm
After being able to determine that an object is garbage, the next thing to consider is recycling. How to recycle? There must be a corresponding algorithm.
The following introduces common garbage collection algorithms.
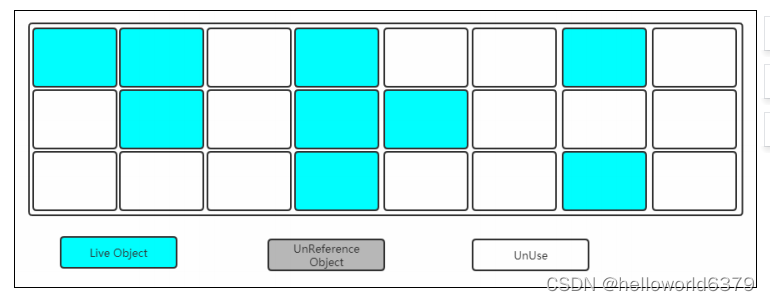
2.5.3.1 Mark-Sweep (Mark-Sweep)
Mark
Find out the objects in the memory that need to be reclaimed and mark them out.
At this time, all objects in the heap will be scanned to determine the objects that need to be reclaimed, which is time-consuming
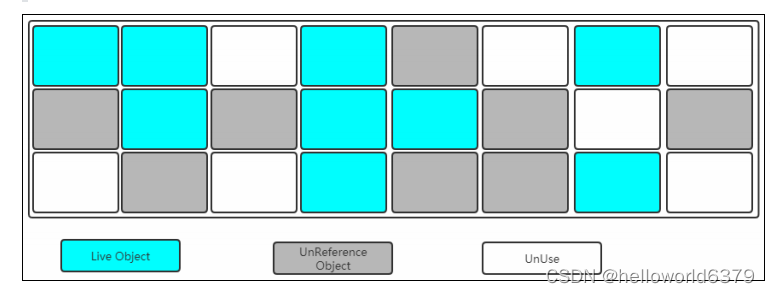
Clear
Clear the objects that are marked to be recycled, and release the corresponding memory space
shortcoming
After the mark is cleared, a large number of discontinuous memory fragments will be generated. Too much space fragmentation may cause that when the program
needs to allocate large objects in the future, it cannot find enough continuous memory and has to trigger another garbage collection action in advance.
(1) The two processes of marking and clearing are time-consuming and inefficient.
(2) A large number of discontinuous memory fragments will be generated. Too much space fragmentation may lead to inability to allocate large objects when the program is running. Find enough contiguous memory and have to trigger another garbage collection action early.
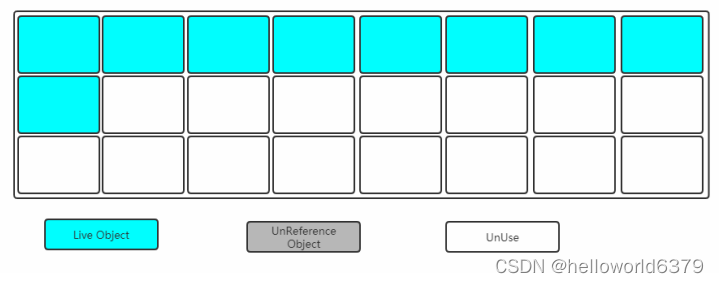
2.5.3.2 Mark-Copying
Divide the memory into two equal areas, and only use one of them at a time, as shown in the following figure:
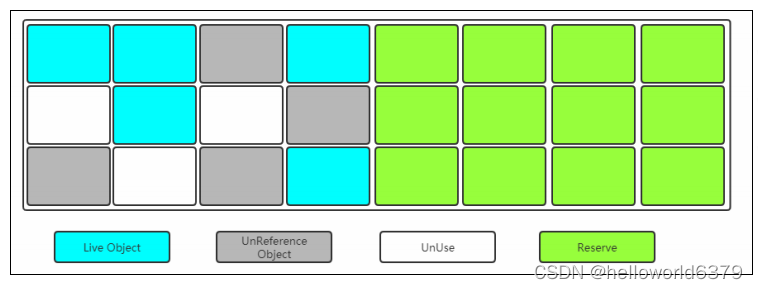
When one piece of memory is used up, copy the surviving object to another piece, and then clear the used memory space at one time.
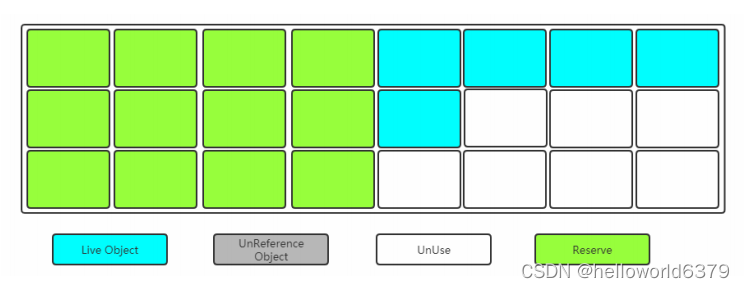
Disadvantages: Reduced space utilization.
2.5.3.3 Mark-Compact
The copy collection algorithm will perform more copy operations when the object survival rate is high, and the efficiency will become lower. More importantly, if you don't
want to waste 50% of the space, you need to have additional space for allocation guarantees to deal with the extreme situation where all objects in the used memory are
100% alive, so the old generation generally cannot directly choose this algorithm.
The marking process is still the same as the "mark-clear" algorithm, but instead of directly cleaning up recyclable objects, the subsequent steps move all surviving objects to one end, and then directly clean up the memory outside the end boundary.
In fact, compared with the "copy algorithm", the above process lacks a "reserved area"

Let all surviving objects move to one end, and clean up the memory beyond the boundary.
2.5.4 Generational Collection Algorithm
Now that the 3 garbage collection algorithms are introduced above, which one should be used in the heap memory?
Young area: copy algorithm (after the object is allocated, the life cycle may be relatively short, and the copying efficiency of the Young area is relatively high)
Old area: mark clearing or mark finishing (the survival time of the object in the Old area is relatively long, it is unnecessary to copy, it is better to Make a mark and clean up)
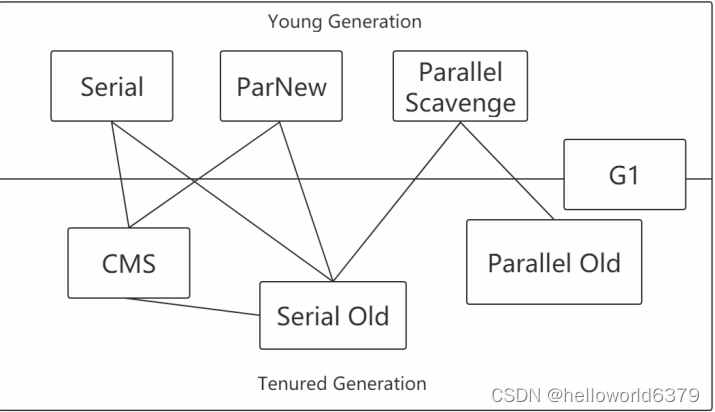
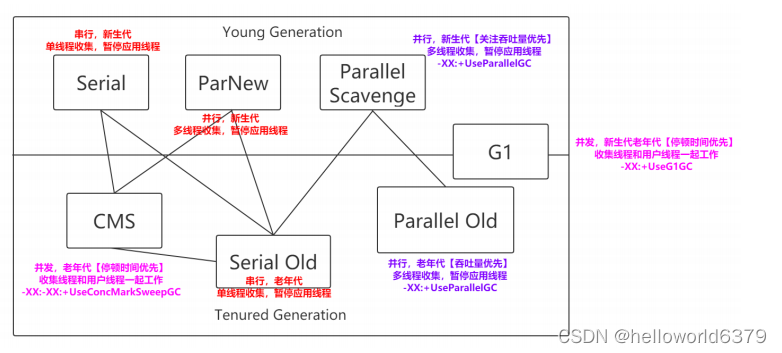
2.5.5 Garbage Collector
If the collection algorithm is the methodology of memory recovery, then the garbage collector is the specific implementation of memory recovery.
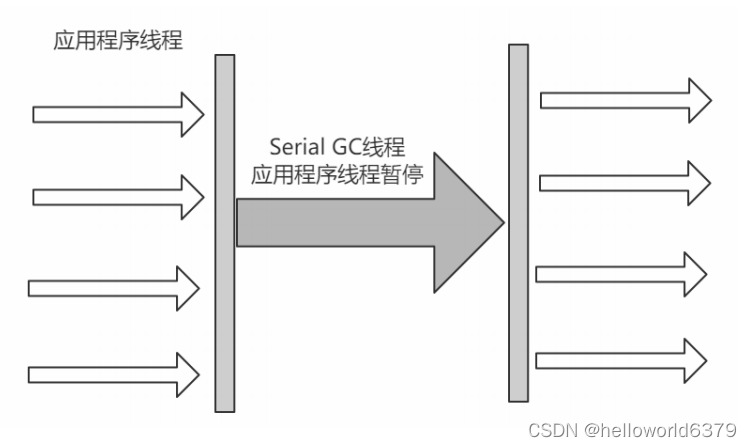
2.5.5.1 Serial
The Serial collector is the most basic collector with the longest development history. It used to be (before JDK1.3.1) the only choice for the new generation of virtual machines to collect.
It is a single-threaded collector, which not only means that it will only use one CPU or one collection thread to complete garbage collection, but more importantly, it needs to suspend other threads during garbage collection.
Advantages: Simple and efficient, with high single-thread collection efficiency
Disadvantages: The collection process needs to suspend all threads
Algorithm: Copy algorithm
Scope of application: New generation
Application: Default new generation collector in Client mode
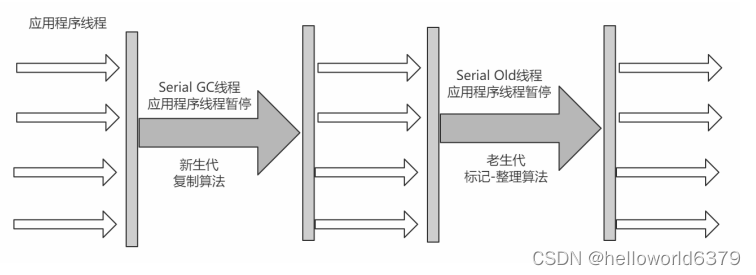
2.5.5.2 Serial Old
The Serial Old collector is an old-age version of the Serial collector, and it is also a single-threaded collector. The difference is that it uses the "mark-sort algorithm
", and the operation process is the same as the Serial collector.
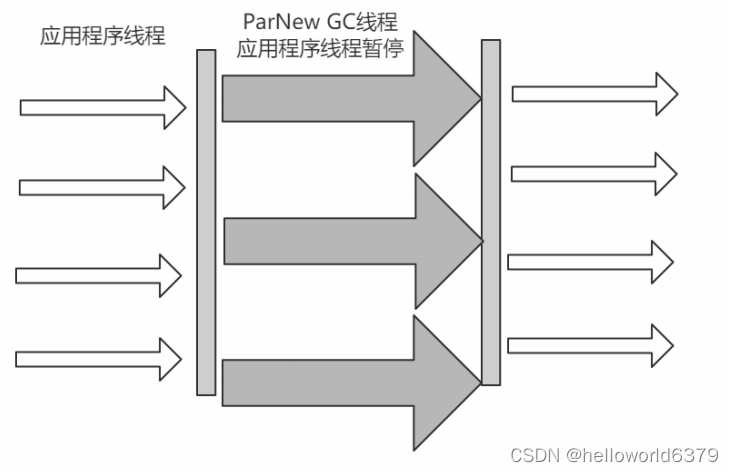
2.5.5.3 ParNew
This collector can be understood as a multi-threaded version of the Serial collector.
Advantages: It is more efficient than Serial when there are multiple CPUs.
Disadvantages: The collection process suspends all application threads, and the efficiency is worse than Serial when a single CPU is used.
Algorithm: Copy algorithm
Scope of application: New generation
Application: The preferred new generation collector in virtual machines running in Server mode
2.5.5.4 Parallel Scavenge
The Parallel Scavenge collector is a new generation collector. It is also a collector using the replication algorithm and a parallel multi-threaded collector. It looks the same as ParNew, but Parallel Scanvenge pays more attention to the throughput of the system.
Throughput = time to run user code/(time to run user code + garbage collection time)
For example, if the virtual machine runs for 100 minutes in total, and the garbage collection time takes 1 minute, throughput=(100-1)/100=99% .
If the throughput is greater, it means that the garbage collection time is shorter, and the user code can make full use of CPU resources to complete the calculation tasks of the program as soon as possible.
-XX:MaxGCPauseMillis控制最大的垃圾收集停顿时间,
-XX:GCRatio直接设置吞吐量的大小。
2.5.5.5 Parallel Old
The Parallel Old collector is an old version of the Parallel Scavenge collector. It uses multi-threading and mark-sort algorithms for garbage collection, and it also pays more attention to the throughput of the system.
2.5.4.6 CMS
Official website: https://docs.oracle.com/javase/8/docs/technotes/guides/vm/gctuning/cms.html#concurrent_mark_sweep_cms_collector
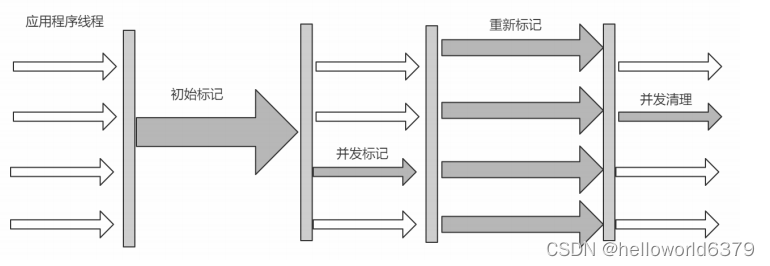
The CMS (Concurrent Mark Sweep) collector is a collector that aims to obtain the shortest recovery pause time.
The "mark-clear algorithm" is used, and the whole process is divided into 4 steps
(1) Initial mark CMS initial mark Mark GC Roots to directly associate objects, without Tracing, the speed is very fast (
2) Concurrent mark CMS concurrent mark for GC Roots Tracing
(3) Re-mark CMS remark Modify the content of concurrent marks due to changes in user programs
( 4) Concurrent clearing of CMS concurrent sweep clears unreachable object recovery space, and new garbage is generated at the same time, which is called floating garbage for next cleaning
Since the collector thread can work with user threads during the entire process of concurrent marking and concurrent clearing, generally speaking, the memory
recovery process of the CMS collector is executed concurrently with user threads.
2.5.5.7 G1(Garbage-First)
Official website: https://docs.oracle.com/javase/8/docs/technotes/guides/vm/gctuning/g1_gc.html#garbage_first_garbage_collection
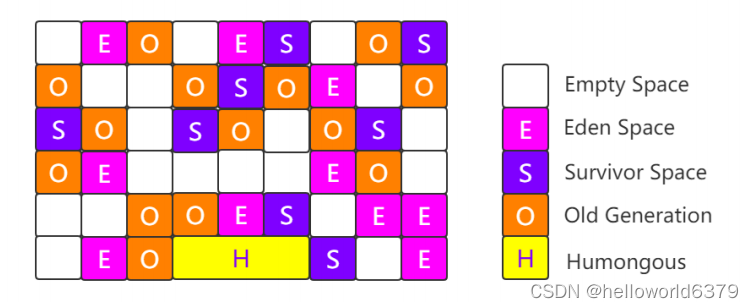
When using the G1 collector, the memory layout of the Java heap is very different from other collectors. It divides the entire Java heap into multiple
independent regions (Regions) of equal size, although there are still new generation and old generation. Concept, but the new generation and the old generation
are no longer physically isolated, they are a collection of a part of the Region (does not need to be continuous).
The size of each Region is the same, which can be a value between 1M and 32M, but it must be guaranteed to be the nth power of 2.
If the object is too large to fit in a Region [more than 50% of the Region size], then it will be directly Put it in H
and set the Region size: -XX:G1HeapRegionSize=M
The so-called Garbage-Frist is actually to give priority to the Region area with the most garbage.
(1) Generational collection (still retains the concept of generation)
(2) Space integration (it belongs to the "mark-sort" algorithm as a whole, and will not cause space fragmentation)
(3) Predictable pause (more advanced than CMS The point is that the user can clearly specify a time segment of M milliseconds in length, and the time spent on garbage collection should not exceed N milliseconds)
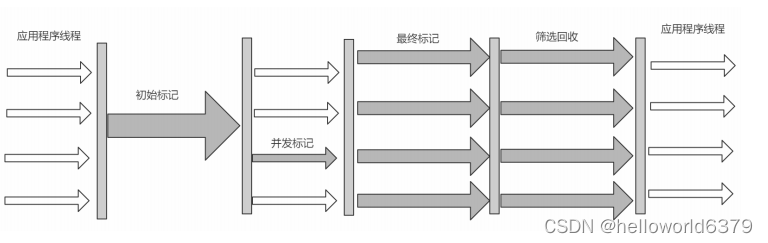
The working process can be divided into the following steps.
Initial marking (Initial Marking) marks the objects that can be associated with the following GC Roots, and to modify the value of TAMS, user threads need to be suspended.
Concurrent Marking (Concurrent Marking) conducts reachability analysis from GC Roots to find out The surviving objects are executed concurrently with the user thread
. Final Marking corrects the changed data due to the concurrent execution of the user program during the concurrent marking phase. The user thread needs to be suspended to screen and
recycle (Live Data Counting and Evacuation) the recovery value of each Region. Sort with cost, and make recovery plan according to user's expected GC pause time
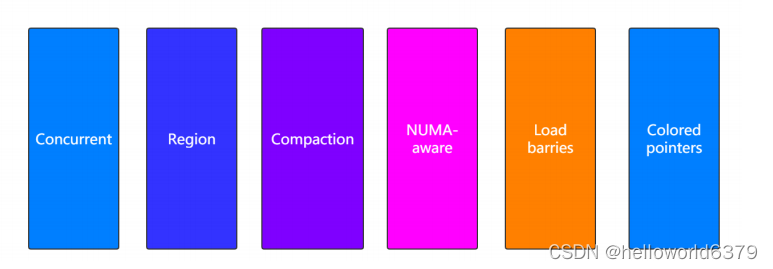
2.5.5.8 ZGC
Official website: https://docs.oracle.com/en/java/javase/11/gctuning/z-garbage-collector1.html#GUID-A5A42691-095E-47BA-B6DC-FB4E5FAA43D0
The new ZGC collector introduced by JDK11, whether it is physically or logically, the concept of new and old ages no longer exists in ZGC. It will be divided into
pages. When GC operations are performed, the pages will be compressed, so there is no fragmentation problem
. It can be used on 64-bit linux, and it is still relatively seldom used at present
(1) Can meet the pause time requirement within 10ms
(2) Support TB-level memory
(3) After the heap memory becomes larger, the pause time is still within 10ms
2.5.5.9 Garbage Collector Classification
Serial Collector -> Serial and Serial Old
can only be executed by one garbage collection thread, and the user thread is suspended.
Suitable for embedded devices with relatively small memory.
Parallel collector [throughput priority] - > Parallel Scanvenge, Parallel Old
Multiple garbage collection threads work in parallel, but the user thread is still in a waiting state at this time.
Initial marking (Initial Marking)
marks the following objects that can be associated with GC Roots, and to modify the value of TAMS, the user thread needs to be suspended
Concurrent Marking
conducts reachability analysis from GC Roots, finds surviving objects, and executes them concurrently with user
threads
Final Marking (Final Marking)
corrects the data that changes due to the concurrent execution of user programs during the concurrent marking phase, and the user thread needs to be suspended
Screening and recovery (Live Data Counting and Evacuation)
sorts the recovery value and cost of each Region, and formulates a recovery plan based on the user's expected GC pause time. It
is suitable for interactive scenarios such as scientific computing and background processing.
Concurrent collector [pause time priority] -> CMS, G1
user thread and garbage collection thread are executed at the same time (but not necessarily in parallel, may be executed alternately), and the garbage collection thread will not pause the user thread during execution run.
Applicable to scenarios that require relative time, such as the Web.
2.5.5.10 Frequently Asked Questions
Throughput and Pause Time
Pause Time -> Garbage Collector Garbage Collection End Application Execution Response Throughput
-> Running User Code Time / (Run User Code Time + Garbage Collection Time)
The shorter the pause time, the more suitable for programs that need to interact with users. Good response speed can improve user experience;
high throughput can efficiently use CPU time and complete the calculation tasks of the program as soon as possible. It is mainly suitable for background calculations without too much Multiple interactive tasks.
Summary : These two indicators are also the criteria for evaluating the benefits of the garbage collector.
How to choose the right garbage collector
https://docs.oracle.com/javase/8/docs/technotes/guides/vm/gctuning/collectors.html#sthref28
Prioritize the size adjustment of the heap and let the server choose by itself.
If the memory is less than 100M, use the serial collector
. If it is a single core and there is no pause time requirement, use serial or JVM
. If the pause time is allowed to exceed 1 second, choose parallel or JVM Choose by yourself
If the response time is the most important and cannot exceed 1 second, use the concurrent collector
For the G1 collection
, JDK 7 started to use, JDK 8 is very mature, and the default garbage collector of JDK 9 is suitable for the new and old generations.
Is the G1 collector used?
(1) More than 50% of the heap is occupied by surviving objects
(2) The speed of object allocation and promotion varies greatly
(3) The garbage collection time is relatively long
The full name of RSet in G1
is Remembered Set, which records and maintains the reference relationship of objects in Region
Just imagine, when the G1 garbage collector performs garbage collection in the new generation, that is, Minor GC, if the object is referenced by the Region in the old generation, the object in the new generation cannot be recycled at this time, how to record it?
How about this, use a structure similar to hash, the key records the address of the region, and the value indicates the collection that refers to the object, so that you can know which objects in the old generation refer to the object, so that it cannot be recycled.
How to enable the required garbage collector
(1) Serial
-XX: +UseSerialGC
-XX: +UseSerialOldGC
(2) Parallel (throughput priority):
-XX: +UseParallelGC
-XX: +UseParallelOldGC
(3) Concurrent collector (response time priority)
-XX: + UseConcMarkSweepGC
-XX:+UseG1GC
3. In-depth
3.1 JVM parameters
3.1.1 Standard parameters
-version
-help
-server
-cp
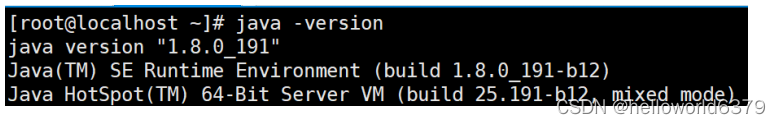
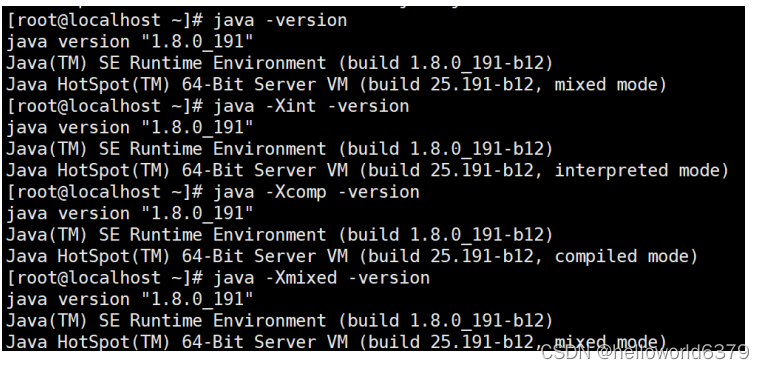
3.1.2 -X parameters
Non-standard parameters, that is, may change in each version of JDK
-Xint Interpretation and execution
-Xcomp compiles to local code when used for the first time
-Xmixed mixed mode, JVM decides by itself
3.1.3 -XX parameters
The most used parameter type
Non-standardized parameters, relatively unstable, mainly used for JVM tuning and Debug
a.Boolean type
format: -XX:[±] + or - means to enable or disable the name attribute
For example: -XX:+UseConcMarkSweepGC means to enable the CMS type garbage collector
-XX:+UseG1GC means to enable the G1 type garbage collector
b. Non-Boolean type format: -XX= indicates that the value of the name attribute is value
For example: -XX:MaxGCPauseMillis=500
-Xms1000M is equivalent to -XX:InitialHeapSize=1000M
-Xmx1000M is equivalent to -XX:MaxHeapSize=1000M
-Xss100, etc. Value at -XX:ThreadStackSize=100
3.1.4 Other parameters
-Xms1000M is equivalent to -XX:InitialHeapSize=1000M
-Xmx1000M is equivalent to -XX:MaxHeapSize=1000M
-Xss100 is equivalent to -XX:ThreadStackSize=100
So this piece is also equivalent to a parameter of type -XX
3.1.5 View parameters
java -XX:+PrintFlagsFinal -version > flags.txt
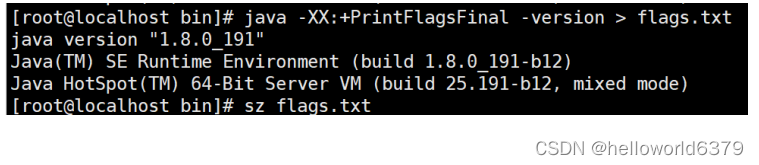
It is worth noting that "=" indicates the default value, and ":=" indicates the value modified by the user or JVM. If you
want to view the value of a specific parameter of a process, you can use jinfo.
Generally, you need to set the parameter. You can check the current parameter first. what, then modify
3.1.6 Common ways to set parameters
Settings in development tools such as IDEA,
when eclipse runs the jar package: java -XX:+UseG1GC xxx.jar
web container such as tomcat, can be set in the script and adjust
the parameters of a java process in real time through jinfo (parameters can only be marked Flags that are manageable can be modified in real time)
3.1.7 Practices and unit conversions
1Byte(byte)=8bit(bit)
1KB=1024Byte(byte)
1MB=1024KB
1GB=1024MB
1TB=1024GB
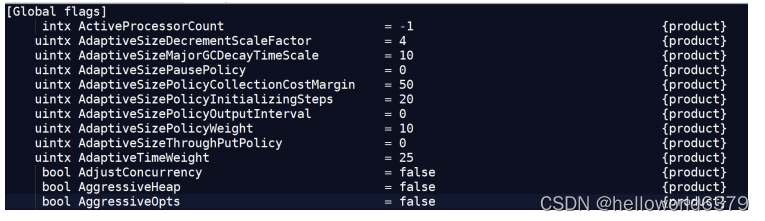
(1) Set the heap memory size and parameter print
-Xmx100M -Xms100M -XX:+PrintFlagsFinal
(2) Query the value of +PrintFlagsFinal
:=true
(3) Query the heap memory size MaxHeapSize
:= 104857600
(4) Convert
104857600(Byte)/ 1024=102400(KB)
102400(KB)/1024=100(MB)
(5) Conclusion
104857600 is a byte unit
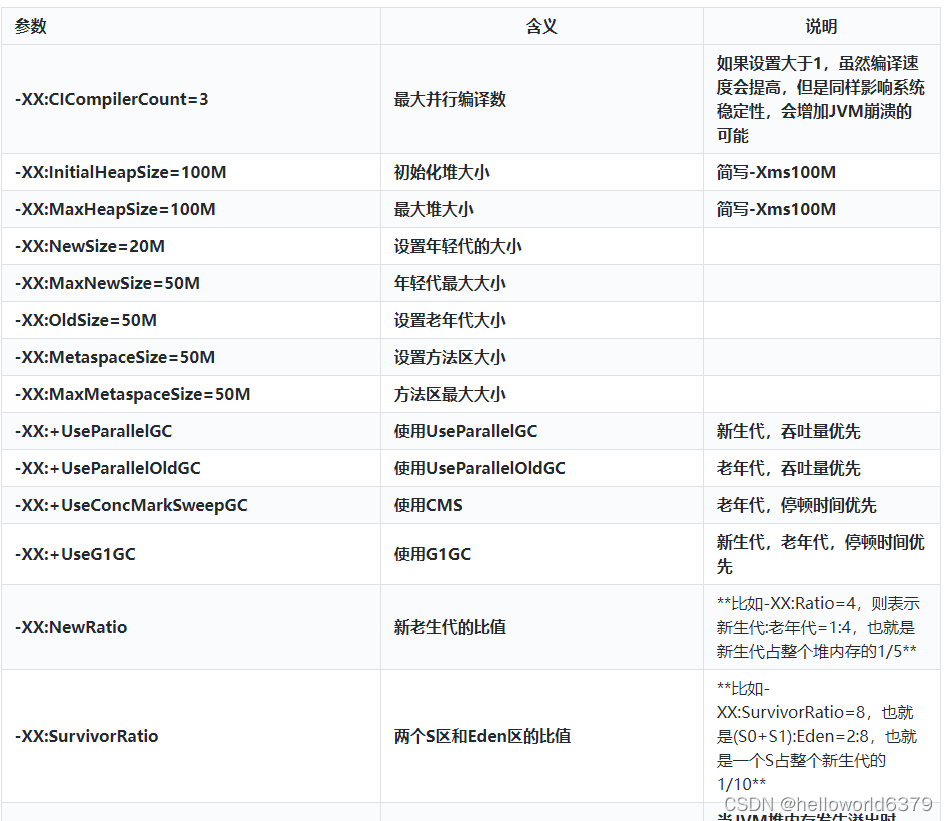
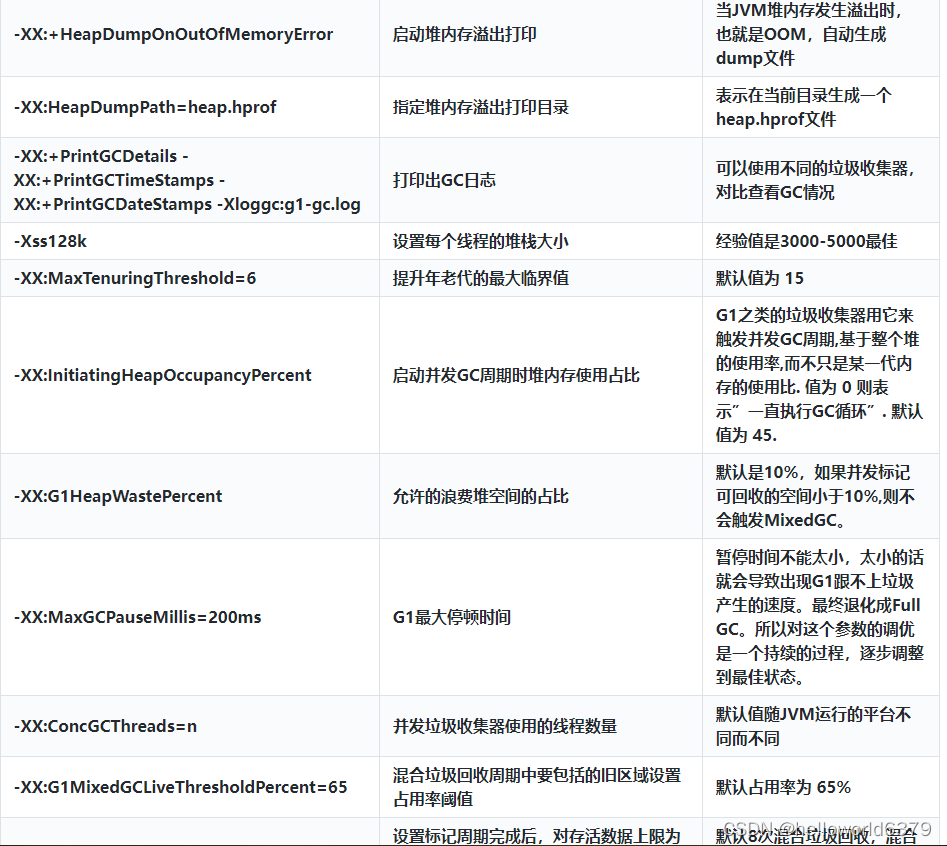
3.1.8 Meanings of Common Parameters
3.2 Common commands
3.2.1 jps
View the java process
The jps command lists the instrumented Java HotSpot VMs on the target system. The command is limited to reporting information on JVMs for which it has the access permissions.
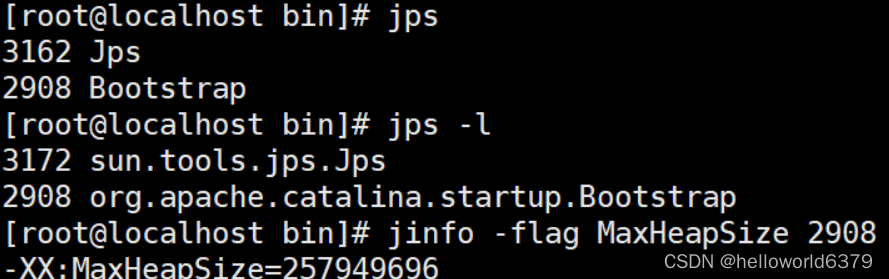
3.2.2 jinfo
(1) View and adjust JVM configuration parameters in real time
The jinfo command prints Java configuration information for a specified Java process or core file or a remote debug server. The configuration information includes Java system properties and Java Virtual Machine (JVM) command-line flags.
(2) View usage
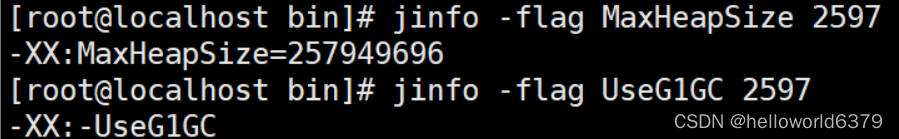
jinfo -flag name PID View the value of the name attribute of a java process
jinfo -flag MaxHeapSize PID
jinfo -flag UseG1GC PID
(3) Modify
parameters Only flags marked as manageable can be modified in real time
jinfo -flag [+|-] PID
jinfo -flag <name>=<value> PID
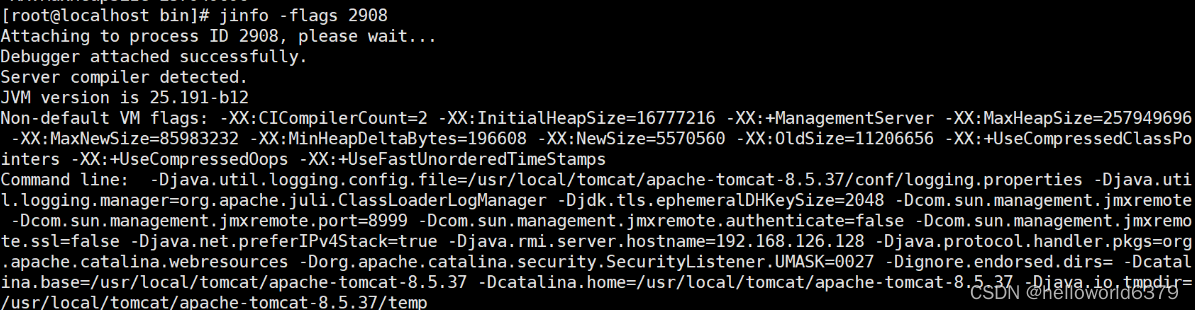
(4) View some parameters that have been assigned values
jinfo -flags PID
3.2.3 stand
(1) View virtual machine performance statistics
The jstat command displays performance statistics for an instrumented Java HotSpot VM. The target JVM is identified by its virtual machine identifier, or vmid option.
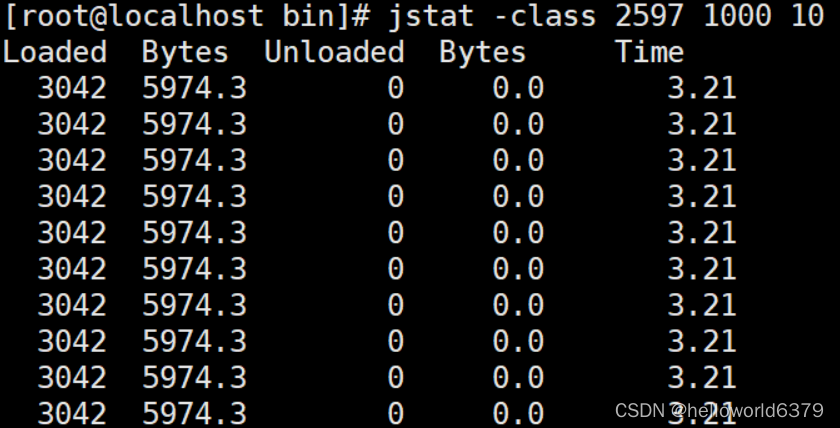
(2) View class loading information
jstat -class PID 1000 10 View the class loading information of a java process, output once every 1000 milliseconds, and output 10 times in total
(3) View garbage collection information
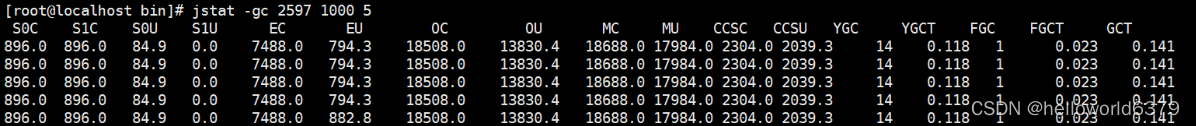
jstat -gc PID 1000 10
3.2.4 jstack
(1) View thread stack information
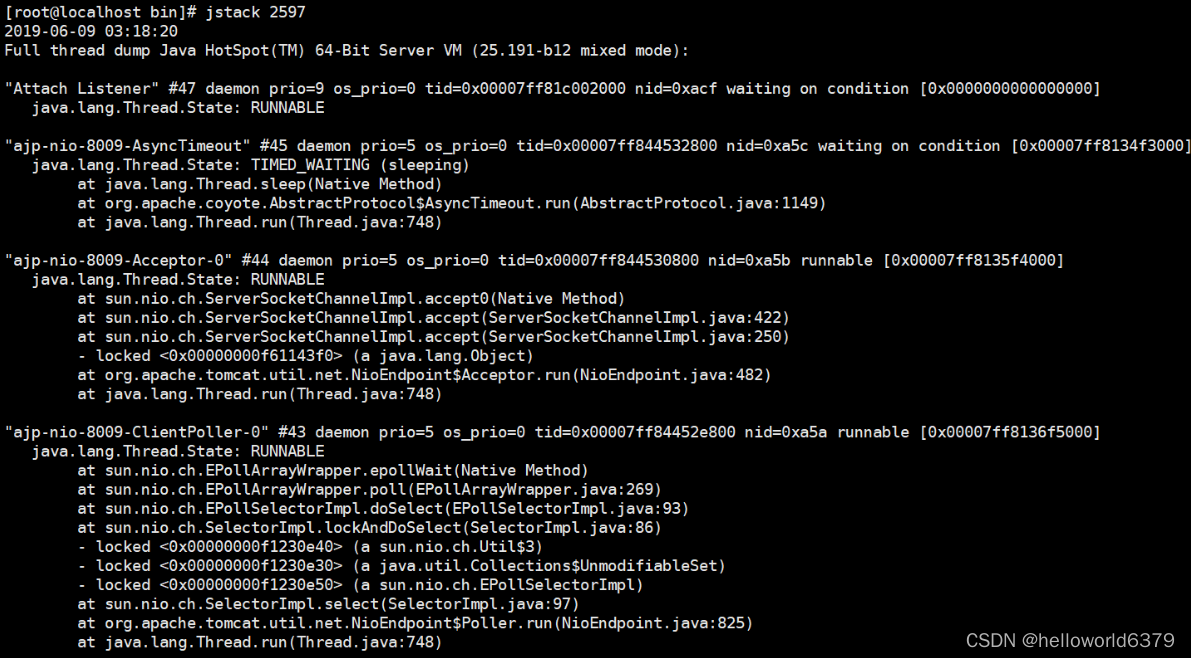
The jstack command prints Java stack traces of Java threads for a specified Java process, core file, or remote debug server.
(2) usage
jstack PID
(3) Troubleshoot deadlock case
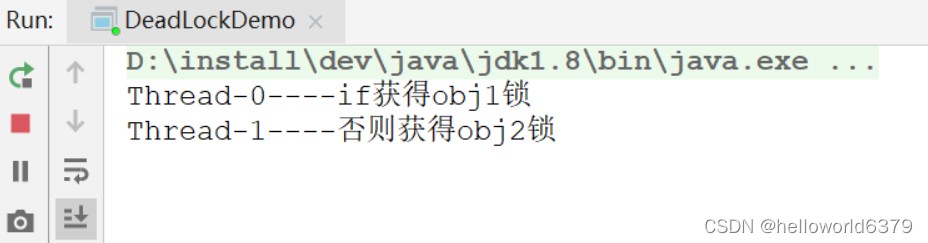
DeadLockDemo
//运行主类
public class DeadLockDemo
{


    public static void main(String[] args)
    {


        DeadLock d1=new DeadLock(true);
        DeadLock d2=new DeadLock(false);
        Thread t1=new Thread(d1);
        Thread t2=new Thread(d2);
        t1.start();
        t2.start();
    }
}
//定义锁对象
class MyLock{


    public static Object obj1=new Object();
    public static Object obj2=new Object();
}
//死锁代码
class DeadLock implements Runnable{


    private boolean flag;
    DeadLock(boolean flag){


        this.flag=flag;
    }
    public void run() {


        if(flag) {


            while(true) {


                synchronized(MyLock.obj1) {


                    System.out.println(Thread.currentThread().getName()+"----if获得obj1锁");
                    synchronized(MyLock.obj2) {


                        System.out.println(Thread.currentThread().getName()+"----if获得obj2锁");
                    }
                }
            }
        }
        else {


            while(true){


                synchronized(MyLock.obj2) {


                    System.out.println(Thread.currentThread().getName()+"----否则获得obj2锁");
                    synchronized(MyLock.obj1) {


                        System.out.println(Thread.currentThread().getName()+"----否则获得obj1锁");

                    }
                }
            }
        }
    }
}
Running result
jstack analysis
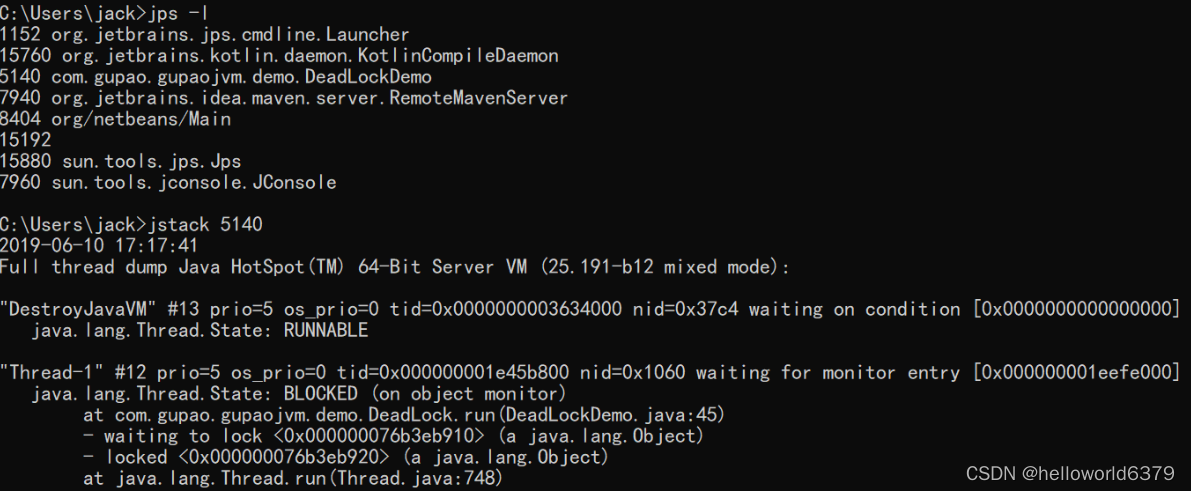
Pull the print information to the end to find
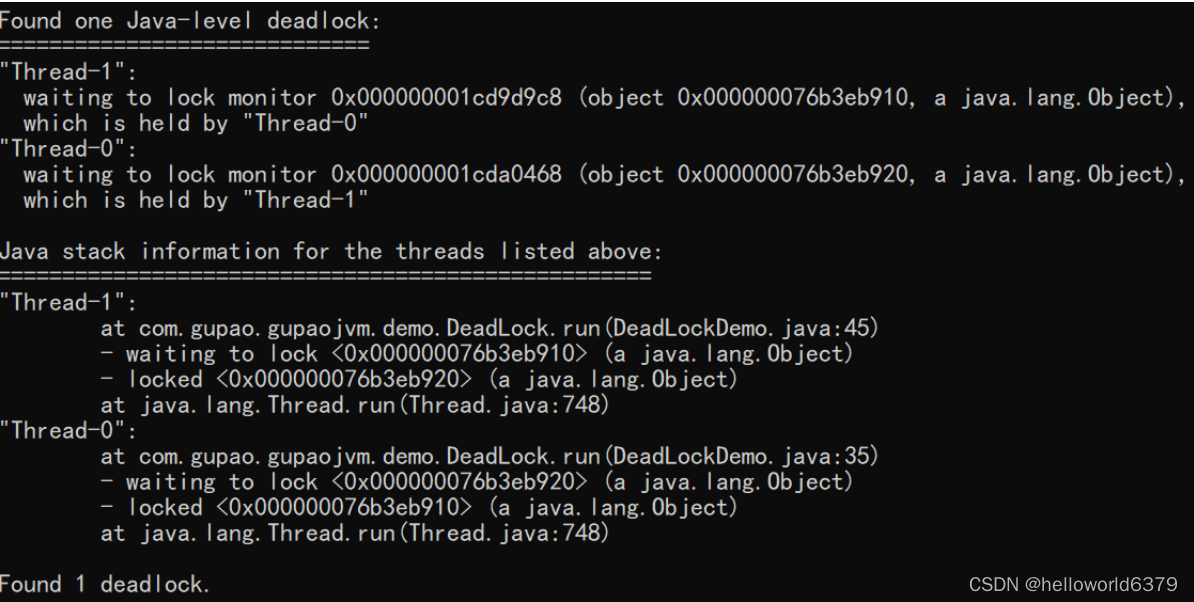
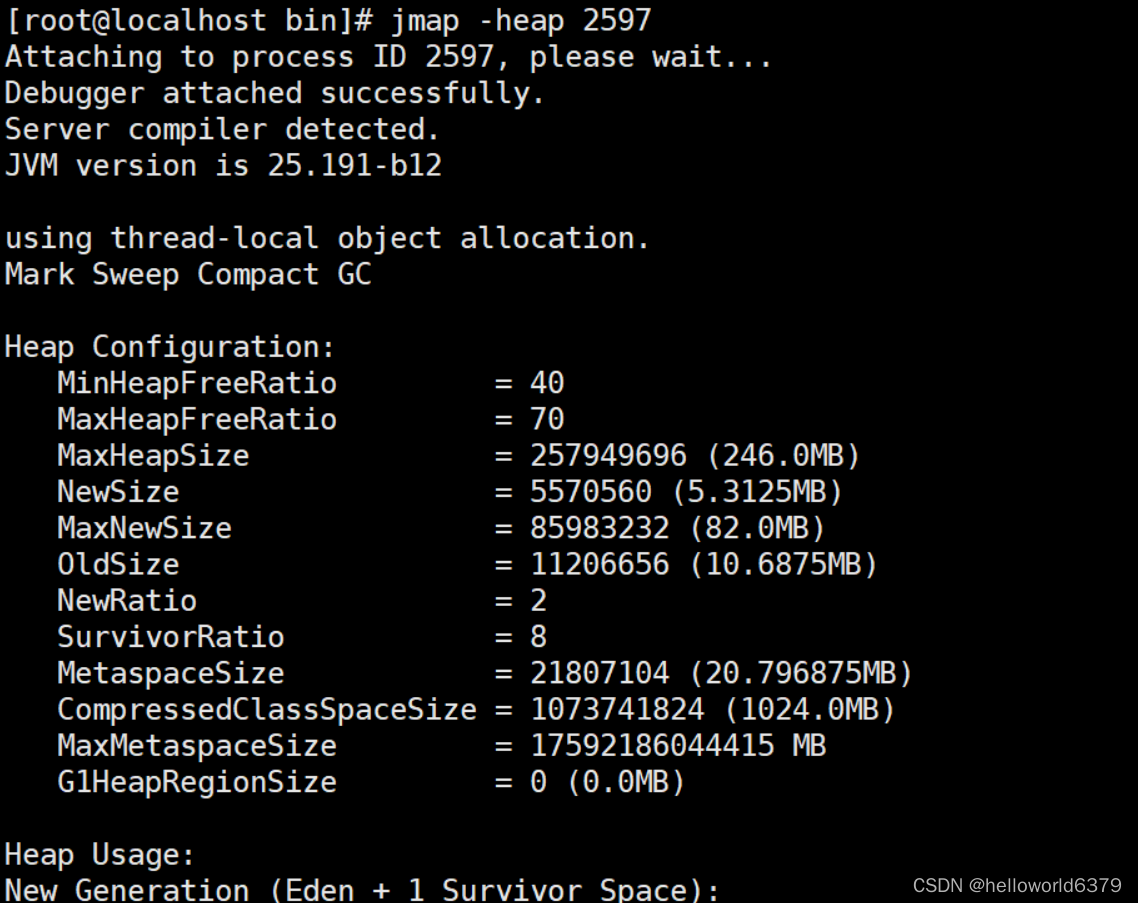
3.2.5 jmap
(1) Generate a heap dump snapshot
The jmap command prints shared object memory maps or heap memory details of a specified process, core file, or remote debug server.
(2) Print out heap memory related information
jmap -heap PID
jinfo -flag UsePSAdaptiveSurvivorSizePolicy 35352
-XX:SurvivorRatio=8
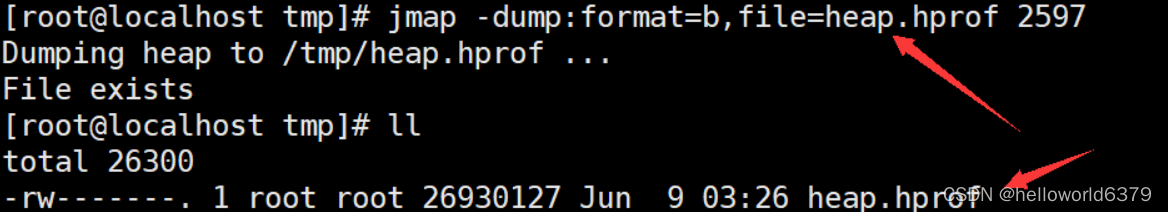
(3) Dump the heap memory related information
jmap -dump:format=b,file=heap.hprof PID
(4) Configure the production dump to output the file.
Generally, during development, the following two sentences can be added to the JVM parameters, so that when the memory overflows, the file will be dumped automatically
-XX:+HeapDumpOnOutOfMemoryError -XX:HeapDumpPath=heap.hprof
Set the heap memory size: -Xms20M -Xmx20M
start, then visit localhost:9090/heap, making the heap memory overflow
Four performance optimization
JVM performance optimization can be divided into code level and non-code level.
At the code level, you can combine bytecode instructions for optimization, such as a loop statement, which can extract loop-unrelated code
out of the loop body, so that these codes do not need to be executed repeatedly at the bytecode level.
At the non-code level, in general, it can be optimized in terms of memory, gc, and cpu usage.
Note that JVM tuning is a long and complicated process, and in many cases, the JVM does not need to be optimized, because the JVM itself has
done a lot of internal optimization operations.
You can discuss the optimization of the JVM from the three aspects of memory, gc and cpu, but everyone should pay attention not to tune and tune
4.1 Memory
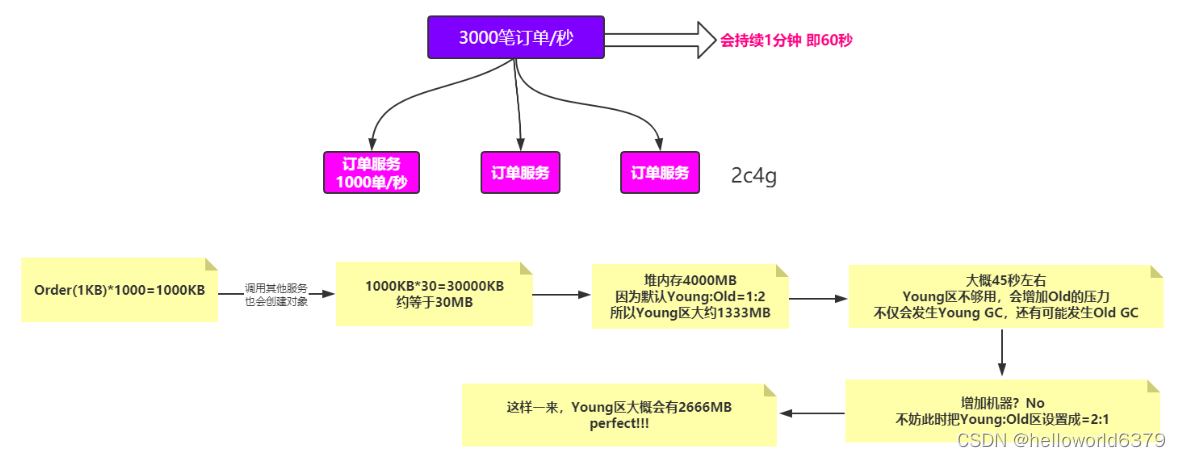
4.1.1 Memory allocation
Under normal circumstances, there is no need to set it, so what if it is a promotion or flash sale scenario?
Each machine is configured with 2c4G, taking 3000 orders per second as an example, the whole process lasts for 60 seconds
4.1.2 Out of Memory (OOM)
Generally, there are two reasons:
(1) In the case of large concurrency
(2) Memory leaks lead to memory overflow
4.1.2.1 Large Concurrency [Seckill]
Browser cache, local cache, verification code
CDN static resource server
cluster + load balancing dynamic and
static resource separation, current limiting [based on token bucket, leaky bucket algorithm]
application-level cache, interface anti-brush current limiting, queue, Tomcat performance optimization
asynchronous Message middleware
Redis hotspot data object cache
Distributed locks, database locks,
no payment within 5 minutes, cancellation of orders, restoration of inventory, etc.
4.1.2.2 Memory leaks lead to memory overflow
The memory leak caused by ThreadLocal eventually leads to memory overflow
public class TLController {


 @RequestMapping(value = "/tl")
 public String tl(HttpServletRequest request) {


     ThreadLocal<Byte[]> tl = new ThreadLocal<Byte[]>();
     // 1MB
     tl.set(new Byte[1024*1024]);
     return "ok";
 }
}
(1) Upload to Alibaba Cloud server
jvm-case-0.0.1-SNAPSHOT.jar
(2) Start
java -jar -Xms1000M -Xmx1000M -XX:+HeapDumpOnOutOfMemoryError -XX:HeapDumpPath=jvm.hprof jvm-case-0.0.1-SNAPSHOT.jar
(3) Use jmeter to simulate 10000 concurrency
39.100.39.63:8080/tl
(4) top command view
top
top -Hp PID
(5) jstack checks the thread situation and finds that there is no deadlock or IO blocking
jstack PID
java -jar arthas.jar   --->   thread
(6) Check the usage of heap memory and find that the usage rate of heap memory has reached 88.95%
jmap -heap PID
java -jar arthas.jar   --->   dashboard
(7) At this time, it can be roughly judged that a memory leak has occurred and the memory overflow has occurred, so how to troubleshoot it?
jmap -histo:live PID | more
获取到jvm.hprof文件,上传到指定的工具分析,比如heaphero.io
4.2 GC
Here we take G1 garbage collector tuning as an example
4.2.1 Whether to choose G1
Official website: https://docs.oracle.com/javase/8/docs/technotes/guides/vm/G1.html#use_cases
(1) More than 50% of the heap is occupied by surviving objects
(2) The speed of object allocation and promotion varies greatly
(3) The garbage collection time is relatively long
4.2.2 G1 Tuning
(1) Use the G1GC garbage collector: -XX:+UseG1GC
to modify configuration parameters, obtain gc logs, and use GCViewer to analyze throughput and response time
Throughput       Min Pause       Max Pause      Avg Pause       GC count
  99.16%         0.00016s         0.0137s        0.00559s          12
(2) Adjust the memory size and then obtain gc log analysis
-XX:MetaspaceSize=100M
-Xms300M
-Xmx300M
For example, set the size of the heap memory, get the gc log, and use GCViewer to analyze the throughput and response time
Throughput       Min Pause       Max Pause      Avg Pause       GC count
  98.89%          0.00021s        0.01531s       0.00538s           12
(3) Adjust the maximum pause time
-XX:MaxGCPauseMillis=200 设置最大GC停顿时间指标
For example, set the maximum pause time, obtain gc logs, and use GCViewer to analyze throughput and response time
Throughput       Min Pause       Max Pause      Avg Pause       GC count
  98.96%          0.00015s        0.01737s       0.00574s          12
(4) Heap memory usage percentage when concurrent GC is started
-XX:InitiatingHeapOccupancyPercent=45
G1用它来触发并发GC周期,基于整个堆的使用率,而不只是某一代内存的使用比例。值为 0 则表示“一直执行GC循环)'. 默认值为 45 (例如, 全部的 45% 或者使用了45%).
For example, set the percentage parameter, get the gc log, and use GCViewer to analyze the throughput and response time
Throughput       Min Pause       Max Pause      Avg Pause       GC count
  98.11%          0.00406s        0.00532s       0.00469s          12
4.2.3 The best practice of G1 tuning
Official website: https://docs.oracle.com/javase/8/docs/technotes/guides/vm/gctuning/g1_gc_tuning.html#r
recommendations
(1) Do not manually set the size of the new generation and the old generation, just set the entire heap The size
why: https://blogs.oracle.com/poonam/increased-heap-usage-with-g1-gc
During the operation of the G1 collector, it will adjust the size of the new generation and the old generation by itself.
In fact, it adjusts the speed and age of object promotion through the size of the adapt generation, so as to achieve the pause time target set for the collector.
If the size is manually set, it will be fine. Means abandoning the automatic tuning of G1
(2) Continuously tune the pause time target
Under normal circumstances, it is possible to set this value to 100ms or 200ms (it will be different in different situations), but it is not reasonable to set it to 50ms. If the pause time is set too short, it will cause G1 to fail to keep up with the speed of garbage generation. Eventually it degenerates into Full GC. Therefore, the tuning of this parameter is a continuous process, gradually adjusting to the best state. Pause time is only a goal and cannot always be met.
(3) Use -XX:ConcGCThreads=n to increase the number of marked threads
If the IHOP threshold is set too high, there may be a risk of transfer failure, such as insufficient space when the object is transferred. If the threshold is set too low, the marking cycle will run too frequently, and there may be no space reclaimed by mixed collections.
If the IHOP value is set reasonably, but when the concurrent cycle time is too long, you can try to increase the number of concurrent threads and increase ConcGCThreads.
(4) MixedGC tuning
-XX:InitiatingHeapOccupancyPercent
-XX:G1MixedGCLiveThresholdPercent
-XX:G1MixedGCCountTarger
-XX:G1OldCSetRegionThresholdPercent
(5) Appropriately increase the heap memory size
(6) Abnormal Full GC
Sometimes it is found that when the system is just started, a Full GC will occur, but the space in the old generation is relatively sufficient, which is usually caused by the Metaspace area. Others can be appropriately increased through MetaspaceSize, such as 256M.
4.3 JVM Performance Optimization Guide

4.4 Pre-tuning for Garbage Collection
1. Whether the memory configuration meets the concurrency requirements before going online, and if it does not meet the requirements, it needs to be adjusted
Calculate from the memory layout of the object, calculate the heap memory size, then calculate the heap memory usage by * concurrency time, and then calculate whether the memory can hold it, considering load balancing and redundancy
2. What is the throughput of the pressure test, generally controlled at more than 95%
In the case of extreme throughput, the deviation does not exceed 1%, adjust the pause time, use GC view or other GC tools to analyze
Throughput       Min Pause       Max Pause      Avg Pause       GC count
  99.16%         0.00016s         0.0137s        0.00559s          12
3. The frequency of Full GC and Young GC, whether it is necessary to replace the GC collector
For example, G1 mentioned earlier
4. Reliability observation: whether there will be a memory leak, this can be observed, according to the change of memory
Two GCs can be performed, and then for the dumped files, analyze the memory movement and recycling of the files
5. Whether the parameters of the garbage collector need to be changed is also determined according to throughput and GC
This is used in conjunction with the second case
6. CPU usage
Analyze deadlocks and memory leaks
Deadlock: jstack
4.5 Frequently Asked Questions
(1) The difference between memory leak and memory overflow
A memory leak means that objects that are no longer used cannot be recycled in a timely manner, and continue to occupy memory space, resulting in a waste of memory space.
Memory leaks can easily lead to memory overflow, but memory overflow is not necessarily caused by memory leaks.
(2) Will young gc have stw?
No matter what GC, stop-the-world will be sent, the difference is the length of time it occurs. And this time has something to do with the garbage collector. Serial, PartNew, and Parallel Scavenge collectors will suspend user threads whether they are serial or parallel, while CMS and
G1 will not suspend user threads when marking concurrently. But at other times, the user thread will be suspended, and the time to stop the world
is relatively much shorter.
(3) The difference between major gc and full gc
Major GC is equivalent to Full GC in many reference materials, and we can also find that there are only Minor GC and Full GC in many performance monitoring tools. Under normal circumstances, a Full GC will perform garbage collection on the young generation, old generation, metaspace, and off-heap memory. There are many reasons to trigger Full GC: when the young generation is promoted to the object size of the old generation and is larger than the remaining space in the old generation, Full GC will be triggered; when the space usage of the old generation exceeds a certain threshold, Full GC will be triggered; when the metaspace is insufficient (JDK1.7 permanent generation is insufficient), Full GC will also be triggered; when System.gc() is called, a Full GC will also be arranged.
(4) What is direct memory
Java's NIO library allows Java programs to use direct memory. Direct memory is the memory space that is directly applied to the system outside the java heap. Usually access to direct memory is faster than the Java heap. Therefore, for performance considerations, direct memory may be considered in occasions with frequent reads and writes. Since the direct memory is outside the java heap, its size will not be directly limited by the maximum heap size specified by Xmx, but the system memory is limited, and the sum of the Java heap and direct memory is still limited by the maximum value that the operating system can provide. Memory.
(5) Ways to judge garbage
Reference counting method : It means that if the object is referenced somewhere, it will be +1, if it is invalid, it will be -1, and it will be recycled when it is 0. However, the JVM
does not this method because it cannot determine mutual circular references (A references B , B refers to the case of A).
Reference chain method : Judging by a GC ROOT object (objects referenced by static variables in the method area, etc. - static variables), if there is
a chain that can reach the GC ROOT, it means that it can be recycled.
(6) Must unreachable objects be recycled?
Even the unreachable objects in the reachability analysis method are not "must die". Objects that are unreachable in property analysis are marked for the first time and screened once, and the screening condition is whether it is necessary to execute the finalize method for this object. When the object does not cover the finalize method, or the finalize method has been called by the virtual machine, the virtual machine regards these two cases as unnecessary to execute.
Objects that are judged to need to be executed will be placed in a queue for a second mark, and unless the object is associated with any object on the reference chain, it will be actually recycled.
(7) Why should we distinguish between the new generation and the old generation?
The current garbage collection of virtual machines adopts the generational collection algorithm. This algorithm has no new ideas, but divides the memory into several blocks according to the different life cycles of objects. Generally, the java heap is divided into the new generation and the old generation, so that we can choose the appropriate garbage collection algorithm according to the characteristics of each age.
For example, in the new generation, a large number of objects will die every time it is collected, so you can choose a copy algorithm, and you only need to pay a small amount of object copy cost to complete each garbage collection. The probability of survival of objects in the old age is relatively high, and there is no additional space to guarantee its allocation, so we must choose the "mark-clear" or "mark-compact" algorithm for garbage collection.
(8) What is the difference between G1 and CMS
CMS mainly focuses on the collection of the old generation, while G1 focuses on the collection of generations, including the Young GC of the young generation and the Mix GC of the old generation;
G1 uses the Region method to divide the heap memory, and implements it based on the mark sorting algorithm, which reduces the generation of garbage fragments as a whole; in the initialization mark phase, the Card Table used to search for reachable objects is implemented in a different way.
(9) Recycling of useless classes in the method area
The method area mainly recycles useless classes, so how to judge whether a class is a useless class?
It is relatively simple to determine whether a constant is an "abandoned constant", but the conditions for determining whether a class is a "useless class" are relatively harsh.
A class needs to meet the following three conditions at the same time to be regarded as a "useless class":
a-All instances of this class have been recycled, that is, there is no instance of this class in the Java heap.
b - The ClassLoader that loaded this class has been recycled.
c- The java.lang.Class object corresponding to this class is not referenced anywhere, and the method of this class cannot be accessed through reflection anywhere.