Commonly used tools and commands
JPS jstat Top jstack jmap mat 工具
top -Hp pid can view a process thread information
-H displays thread information, -p pid specified
jps: virtual machines can list running processes and displays the virtual machine executes the main class name and the process pid such as: jps -l pid
Jstack command
jstack is java virtual machine comes with a stack trace tool. Used to generate the java virtual machine snapshot of the current moment thread. A snapshot is a method in the current thread java virtual machine each executing thread stack collection, the main purpose of generating a snapshot of the thread is to locate the thread appears long pause, such as inter-thread deadlocks, infinite loop, long requested external resources caused by time to wait so on.
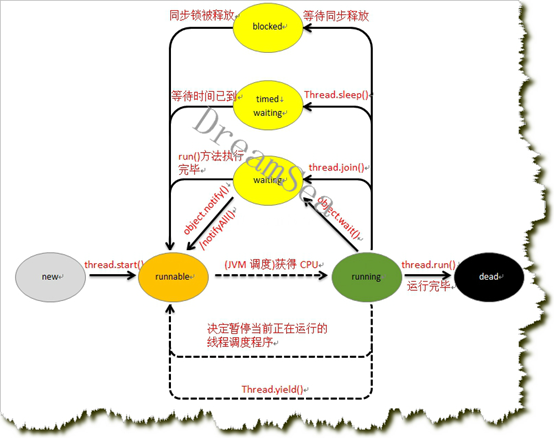
Thread states:
NEW: do not start. It does not appear in the Dump.
RUNNABLE: executing within the virtual machine. Running state, it may be locked inside you can still see the words, that it acquired a lock.
BLOCKED: by block and wait for the monitor lock. Is a lock (synchronizers) to block live.
WATING: wait indefinitely for another thread to perform certain actions. Waiting for a condition or monitor occurs, usually stay in the park (), wait (), sleep (), join (), etc. in the statement.
TIMED_WATING: waiting for a specific operation of another thread time-bound. And WAITING difference is wait () and other statement with a time limit wait (timeout).
TERMINATED: it has quit.
Example one:
public class MyThread implements Runnable{
public void run() {
synchronized(this) {
for (int i = 0; i < 1; i--) {
System.out.println(Thread.currentThread().getName() +Thread.currentThread().getId()+ " do loop " + i);
}
}
}
public static void main(String[] args) {
MyThread t1 = new MyThread();
Thread ta = new Thread(t1, "A");
Thread tb = new Thread(t1, "B");
ta.start();
tb.start();
}
}
jstack -l 6212 > d:\11.jstack.txt
2019-06-25 23:00:05
Full thread dump Java HotSpot(TM) 64-Bit Server VM (25.201-b09 mixed mode):
"DestroyJavaVM" #13 prio=5 os_prio=0 tid=0x0000000002b7e800 nid=0xb80 waiting on condition [0x0000000000000000]
java.lang.Thread.State: RUNNABLE
"B" #12 prio=5 os_prio=0 tid=0x000000001b4b1800 nid=0x1d0 waiting for monitor entry [0x000000001c12f000]
java.lang.Thread.State: BLOCKED (on object monitor)
at MyThread.run(MyThread.java:12)
- waiting to lock <0x0000000702c02720> (a MyThread)
at java.lang.Thread.run(Thread.java:748)
"A" #11 prio=5 os_prio=0 tid=0x000000001b4b1000 nid=0x1cec runnable [0x000000001c02f000]
java.lang.Thread.State: RUNNABLE
at java.io.FileOutputStream.writeBytes(Native Method)
at java.io.FileOutputStream.write(FileOutputStream.java:326)
at java.io.BufferedOutputStream.flushBuffer(BufferedOutputStream.java:82)
at java.io.BufferedOutputStream.flush(BufferedOutputStream.java:140)
- locked <0x0000000702c407f8> (a java.io.BufferedOutputStream)
at java.io.PrintStream.write(PrintStream.java:482)
- locked <0x0000000702c04820> (a java.io.PrintStream)
...
at MyThread.run(MyThread.java:13)
- locked <0x0000000702c02720> (a MyThread)
at java.lang.Thread.run(Thread.java:748)
dump time, virtual machines are in top command has been acquired to occupy high cpu resources thread pid, the pid turn into a hexadecimal value in the thread dump for each thread has a nid, find the corresponding nid can;
Here is where we are most concerned about, but also through local stack trace to find the problem, the specific meaning of each item is
-Thread name: "A"
- thread priority: prio = 10
-java thread identifier: tid = 0x09b7b400
-native thread identifier: nid = 0x12f2
- state of the thread: in Object.wait () java.lang.Thread.State: TIMED_WAITING (on object monitor)
- thread stack start address: [0xb30f9000]
Example two:
public void run() {
synchronized(this) {
for (int i = 0; i < 1; i--) {
//System.out.println(Thread.currentThread().getName() +Thread.currentThread().getId()+ " do loop " + i);
try {
this.wait();
} catch (InterruptedException e) {
e.printStackTrace ();
}
}
}
}
2019-06-25 22:52:25
Full thread dump Java HotSpot(TM) 64-Bit Server VM (25.201-b09 mixed mode):
"DestroyJavaVM" #13 prio=5 os_prio=0 tid=0x000000000252e800 nid=0x3e5c waiting on condition [0x0000000000000000]
java.lang.Thread.State: RUNNABLE
"B" #12 prio=5 os_prio=0 tid=0x000000001b19b000 nid=0x4d38 in Object.wait() [0x000000001bdee000]
java.lang.Thread.State: WAITING (on object monitor)
at java.lang.Object.wait(Native Method)
- waiting on <0x000000078105ba78> (a MyThread)
at java.lang.Object.wait(Object.java:502)
at MyThread.run(MyThread.java:15)
- locked <0x000000078105ba78> (a MyThread)
at java.lang.Thread.run(Thread.java:748)
"A" #11 prio=5 os_prio=0 tid=0x000000001b198000 nid=0x2b18 in Object.wait() [0x000000001bcef000]
java.lang.Thread.State: WAITING (on object monitor)
at java.lang.Object.wait(Native Method)
- waiting on <0x000000078105ba78> (a MyThread)
at java.lang.Object.wait(Object.java:502)
at MyThread.run(MyThread.java:15)
- locked <0x000000078105ba78> (a MyThread)
at java.lang.Thread.run(Thread.java:748)
Use MAT memory leak analysis tools
jmap command
As to analyze memory, you first need to obtain raw memory for analysis of documents, which need to use jmap command. JDK is jmap own tools for generating a memory image file, through the tool, developers dump file can be quickly generated. Developers can use the command "jmap -help" to see jmap commonly used commands
There are two ways to obtain the dump file:
First, by the above described jmap tool generation, you can generate any of the java process dump file;
Second, the JVM parameters generated by the configuration option "-XX: + HeapDumpOnOutOfMemoryError" and -: the meaning of "XX HeapDumpPath" is represented when the program appears OutofMemory, will generate a dump file in the appropriate directory, and if do not specify the option "XX: HeapDumpPath" is generated dump file in the current directory.
Although there are two ways to obtain the dump file, but taking into account the production environment is almost impossible to analyze them online, mostly off-line analysis, the use of jmap + MAT tool is the most common combination.
Heap overflows simulation scenarios: The Set: -Xms10m -Xmx10m -XX: + HeapDumpOnOutOfMemoryError -XX: HeapDumpPath = E: \ dump
@Test
public void testOOM() {
List<Person> users = new ArrayList<Person>();
while (true) {
users.add(new Person("", 1));
}
}
Overview options:
After the successful launch of MAT, through the menu option "File-> Open heap dump ..." Open the specified dump file will be generated Overview option, as follows:
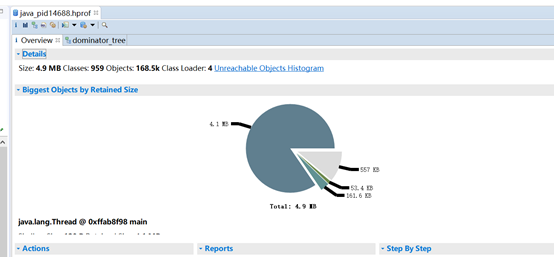
Overview options in the form of a pie chart include some basic information of the program memory consumption, wherein each of the different color of the cake represents a different percentage of memory consumption.
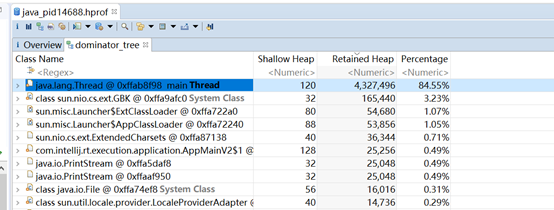
Dominator Tree option:
If the code needs to locate memory leaks point, we can troubleshoot by Dominator Tree menu option. Dominator Tree provides a list. Dominator Tree: dominator tree relationship between objects. If you reach all the path Y from GC Root undergo X, then we say X dominates Y, or X is the Dominator Y's. Dominator Tree calculated by the system from the complex object in FIG. From the dominator tree MAT can be seen in the largest object occupies memory and dominator of each object, as follows:
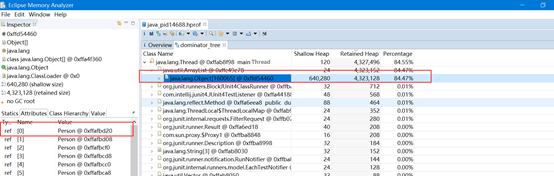
See inner layer may further applications, see also attribute value corresponding to the class object, as follows:
Histogram options:
Histogram analysis can, Histogram lists examples of each class number, click Histogram under the Action, following results were obtained:
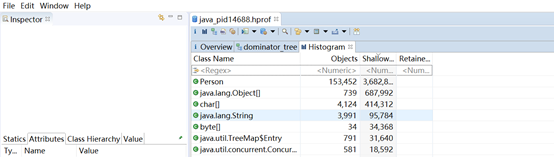
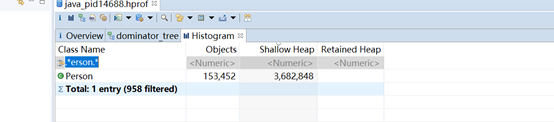
If you need to query a class characteristics, we can enter the first line of the class name or key words to find in a regular match, such as finding "erson":
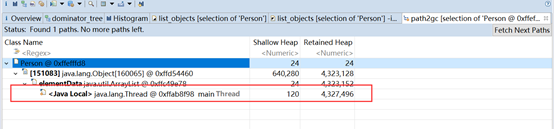
Path to GC Root:
View an object reference to RC Roots chain
Usually when troubleshooting memory leaks, we will choose to exclude all phantom / weak / soft etc.references, meaning viewing exclude false references / weak references / soft references and other references chain, because the phantom reference / weak references / soft references objects can be directly recycled to the GC, we want to see is whether there is an object Strong chain of references (to manually before exporting HeapDump departure GC guaranteed), if there is, then there is a memory leak, and then go to troubleshoot specific reference
总结:遇到线上问题,首先确认排查问题的思路:
查看日志
查看CPU情况 top
查看TCP情况 netstat
查看java线程,jstack
查看java堆,jmap
通过MAT分析堆文件,寻找无法被回收的对象
问题排查
1.检查对数据库查询中,是否有一次获得全部数据的查询。一般来说,如果一次取比较多条记录到内存,就可能引起内存溢出。这个问题比较隐蔽,在上线前,数据库中数据较少,不容易出问题,上线后,数据库中数据多了,一次查询就有可能引起内存溢出。因此对于数据库查询尽量采用分页的方式查询。
2.检查代码中是否有死循环或递归调用。
3.检查是否有大循环重复产生新对象实体。
4.检查List、MAP等集合对象是否有使用完后,未清除的问题。List、MAP等集合对象会始终存有对对象的引用,使得这些对象不能被GC回收。
5.结合内存查看工具动态查看内存使用情况
问题解决
1.检查错误日志,查看“OutOfMemory”错误前是否有其它异常或错误。对代码进行走查和分析,找出可能发生内存溢出的位置。修正。
2.修改JVM启动参数,直接增加内存。
第一个异常:设置堆的方法是通过-Xms(堆的最小值),-Xmx(堆的最大值)
第一个异常:设置栈大小的方法是设置-Xss参数-Xss100k
第三个异常:设置元空间-XX:PermSize和-XX:MaxPermSize参数(java8中去掉了PermGen(1.8前称永久代,主要用来 存放Class的静态信息,Main方法信息,常量信息,静态方法和变量信息,共享变量等信息 参数设置示例: -XX:PermSize=5M -XX:MaxPermSize=7M) 改为 Metaspace 默认情况下,类元数据只受可用的本地内存限制(容量取决于是32位或是64位操作系统的可用虚拟内存大小) 新参数(MaxMetaspaceSize)用于限制本地内存分配给类元数据的大小。如果没有指定这个参数,元空间会在运行时根据需要动态调整)
总结
内存查看工具有许多,比较有名的有:mt、Optimizeit Profiler、JProbe Profiler、JinSight和Java1.5的Jconsole、visualVM(BTrace动态日志,不用修改服务可以加日志)等。它们的基本工作原理大同小异,都是监测Java程序运行时所有对象的申请、释放等动作,将内存管理的所有信息进行统计、分析、可视化。开发人员可以根据这些信息判断程序是否有内存泄漏问题。一般来说,一个正常的系统在其启动完成后其内存的占用量是基本稳定的,而不应该是无限制的增长的。持续地观察系统运行时使用的内存的大小,可以看到在内存使用监控窗口中是基本规则的锯齿形的图线,如果内存的大小持续地增长,则说明系统存在内存泄漏问题。通过间隔一段时间取一次内存快照,然后对内存快照中对象的使用与引用等信息进行比对与分析,可以找出是哪个类的对象在泄漏。