Ultra-detailed testing process and analysis - none
Introduction to App Stability Testing
App performance tests mainly include response, memory, cpu, FPS, GPU over-rendering, power consumption, and current consumption. In addition to these performance tests, the app also includes: mobile phone version number compatibility, screen resolution compatibility, and stability Testing, security testing, etc., are not explained here.
Introduction to monkey testing
The Monkey tool is a kind of Android automated testing tool, which mainly performs stress testing on Android and APP.
Monkey is a command-line tool in Android that can run in an emulator or on an actual device. It sends pseudo-random user event streams (such as key input, touch screen input, gesture input, etc.) to the system to implement stress testing of the application being developed. Monkey testing is a fast and effective method to test the stability and robustness of software.
monkey features
The object of the test is only the application package, which has certain limitations
The event stream data stream used by the Monkey test is random and cannot be customized
You can set the MonkeyTest object, event quantity, type, frequency, etc.
APP performance testing tool introduction
SoloPi and GT: It is a wireless, non-intrusive Android automation tool with functions such as recording playback and performance testing.
The effect is as follows:
Basic performance test: It can record various indicators of the application to be tested, observe the real-time updated data in the floating window, and record the performance data, and view the chart after the recording; at the same time, it also supports performance pressure, which can The CPU, memory and network environment are restricted to reproduce the performance of the application in poor performance and poor network environment.
Recording and playback: Executing the use case steps through SoloPi can record the user's operations and support playback on various devices, all of which can be done independently on the mobile phone.
One device with multiple controls: It supports controlling multiple slave devices by operating one master device, without repeating complicated compatibility tests on each device, which can greatly improve the efficiency of compatibility tests.
SoloPi and GT installation:
Link: https://pan.baidu.com/s/1i0fKgEfa5soiuhWOzC-zlQ
Extraction code: 1111
response test
The response time and speed of the software directly affect the user experience. If a software cannot be loaded for a long time, it will directly affect the daily activity and retention of the software. Therefore, for a software, it is essential to test the response speed.
Main test points:
Cold Start: The time interval between app launches for the first time (just startup time, excluding page loads)
Hot start: the time interval for not launching the app for the first time (just the startup time, excluding page loading)
Test Methods:
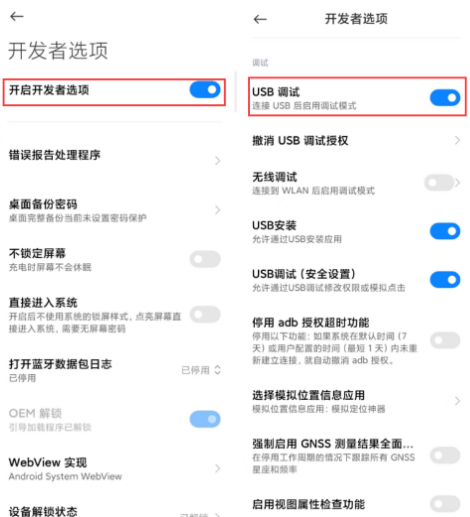
After making sure the phone is connected to the computer with a data cable, we need to turn on the developer mode
Then open the phone to test the app, use the adb command on the computer to check the package name
命令:adb shell dumpsys window | findstr mCurrentFocus

The blue position is the package name of the app opened by the current mobile phone , and the green part is the appActivity name of the app
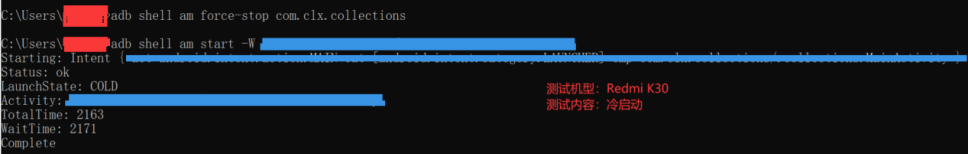
Cold start:
First close the app command: adb shell am force-stop package name
Then execute the start app command: adb shell am start -W appActivity name
Hot start :
The phone returns to the desktop without exiting the app
Execute the command to start the app: adb shell am start -W appActivity name

meaning:
ThisTime: the startup time of the app;
TotalTime: the start-up time of the app, ThisTime+ resource start-up time such as application;
WaitTime: the time it takes for the system to start the app, TotalTime+ system resource startup time (mainly see this unit as milliseconds)
测试标准:冷启动时间不超过1.5s, 热启动不超过1s.
当测试数据超出标准值时,优化建议:
UI布局:应⽤⼀般都有闪屏页,优化闪屏页的UI布局,可以通过Profile GPU Rendering检测丢帧情况。
启动加载逻辑优化:可以采⽤分布加载、异步加载、延期加载策略来提⾼应⽤启动速度。
数据准备:数据初始化分析,加载数据可以考虑⽤线程初始化等策略。
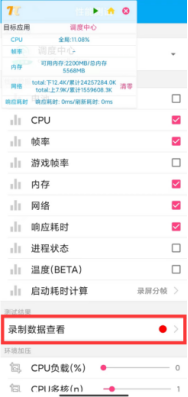
APP性能测试工具 —— SoloPi使用
打开SoloPi——选择性能测试——同意授权——选择要测试的app——选择要监控的数据——勾选后悬浮窗会出现在手机屏幕上

全屏设置:
设置全屏:adb shell settings put global policy_control immersive.full=*
取消全屏:adb shell settings put global policy_control null
准备好后开始录制(上图第三步)并且在电脑上执行monkey命令:
常规monkey命令:
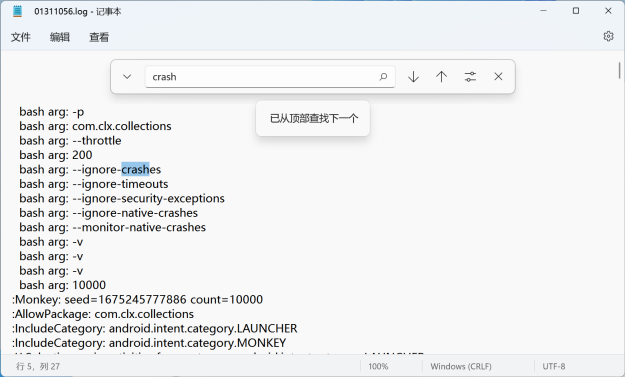
adb shell monkey -p com.clx.collections --throttle 100 --ignore-crashes --ignore-timeouts --ignore-security-exceptions --ignore-native-crashes --monitor-native-crashes -v -v -v 1000000>D:\Log\01291048.log
命令解析:指定一个应用,延时时间为200毫秒,忽略程序崩溃,忽略ANR错误,忽略许可错误,监视并报告应用程序发生崩溃的本地代码,日志级别Level2,随机种子数10000。
大家可以自行根据情况去写命令执行,也可以百度查找其他命令。命令执行完成后停止录制,会自动进行保存,点击查看。
数据分析
CPU:
介绍:
CPU测试,主要关注的是cpu的占用率。很多时候,我们玩手机时,会出现发热发烫,那是因为CPU使用率过高,CPU过于繁忙,会使整个手机无法响应用户,整体性能降低,用户体验就会很差,也容易引起ANR(application not responding, 主线程(UI线程)如果在规定时内没有处理完相应工作,就会出现ANR)等等一系列问题。
测试点:
在空闲时间(切换至后台)的消耗,基本没大应用使用cpu
在运行一些应用的情况下,cpu已占50%的情况下,观察应用程序占用cpu的情况
在高负荷的情况下看CPU的表现(cpu占用应是在80%以上)
具体场景:
应用空闲状态运行监测CPU占用率
空闲状态:应用按Home键退到后台,不再占用系统的状态(通常是灭屏半分钟后)
CPU占用率=0%
应用中等规格运行监测CPU占用率
中等规格:模拟用户最常见的使用场景
CPU占用率≤30%
应用满规格长时间正常运行监测CPU占用率
Monkey测试
CPU占用率≤30%
应用正常运行期间监测CPU占用率峰值
应用正常运行:打开应用进行基本操作
CPU占用率≤50%
方法一:
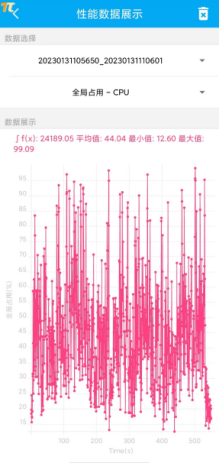
基线:如果有基线要求,CPU曲线图是否存在长期超过基线的现象(min),如果没有基线,行业默认80%。
CPU占用过高时可能出现的问题:
手机发烫
页面卡顿
电量消耗严重
快速恢复:清空后台运行的进程
测试数据结果分析:本次测试结果显示CPU占用率平均值为44.04%,未超过行业标准值80%,测试通过。
方法二:
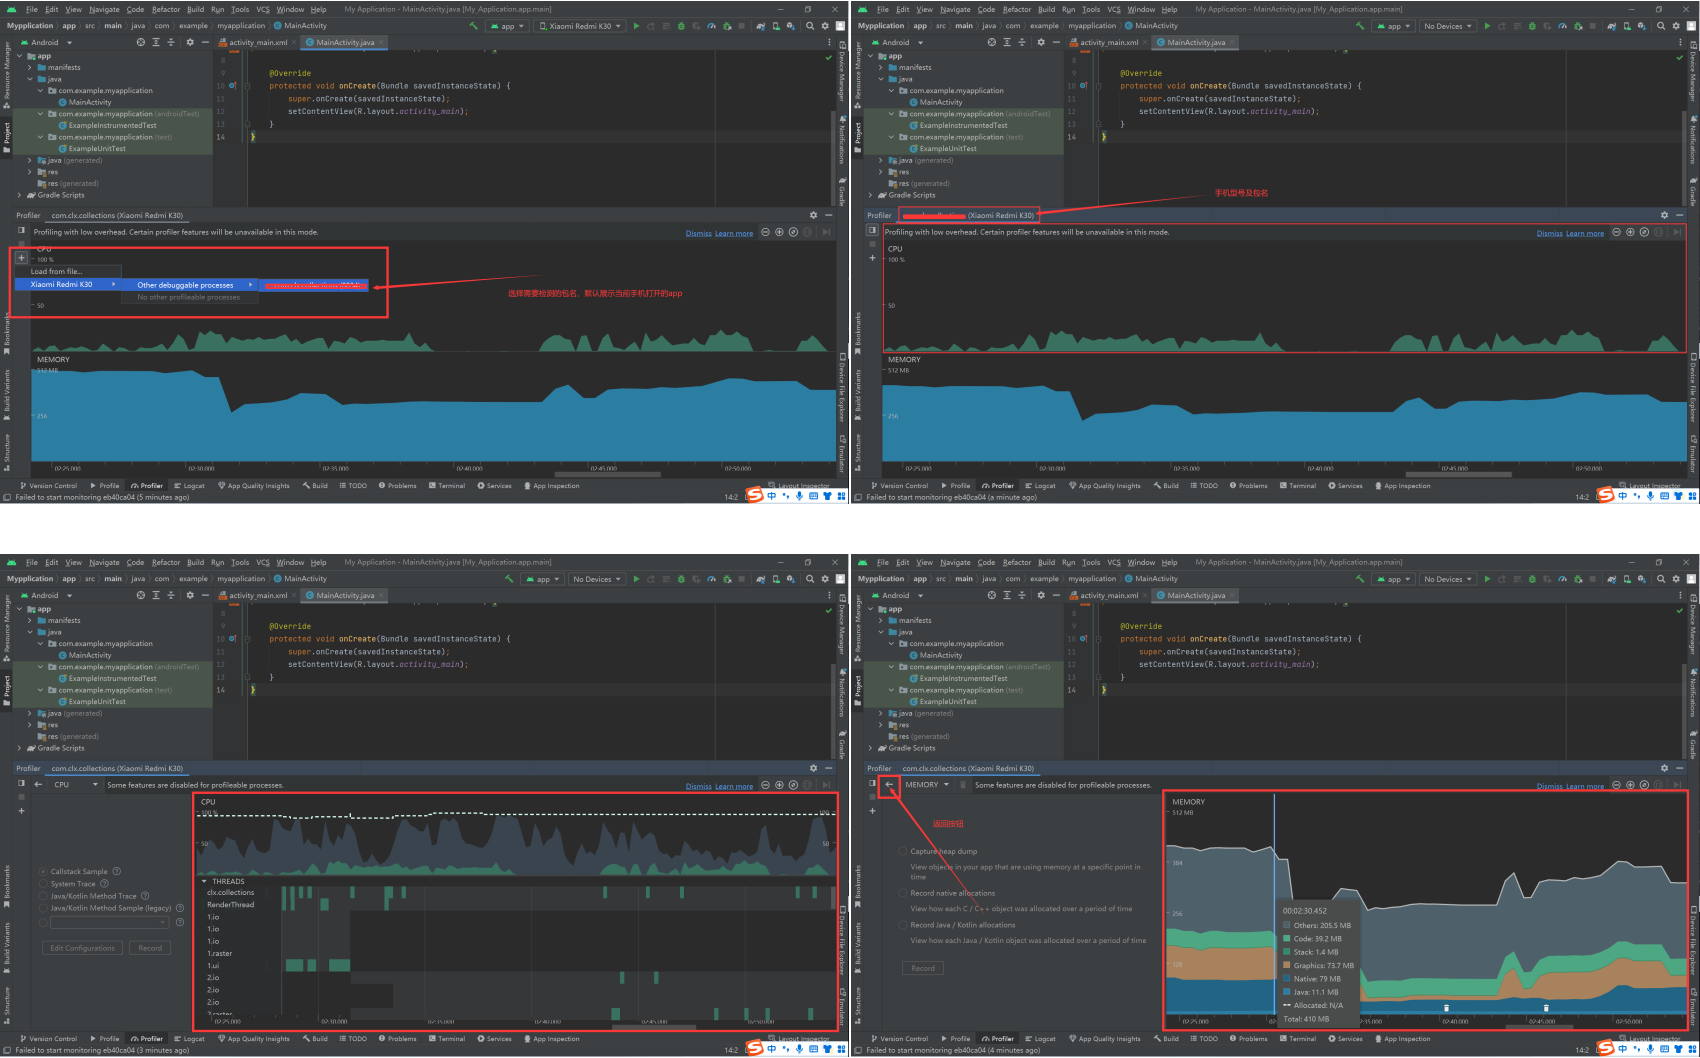
使用AndroidStudio 自带 CPU 和内存检测功能
首先要下载并安装好Android Studio——使用数据线连接电脑,打开要检测的app——在Android Studio确认app——配合monkey命令
Android Monitor 可以检测CPU 和内存,能够绘制出变化图,可以直观明了的看出内存和cpu的变化曲线。
内存
介绍:
在Android系统中,每个APP进程除了同其他进程共享内存(shared dirty)外,还独用私有内存(private dirty),通常我们使用PSS(私有内存+比例分配共享内存)来衡量一个APP的内存开销。由于一个移动设备的内存是固定的,如果内存消耗过大就会造成应用卡顿或者闪退,需要对内存进行测试。正常情况下,应用不应占用过多的内存资源,且能够及时释放内存,保证整个应用内的稳定性和流畅性。
测试点:
空闲状态:切换至后台或者启动后不做任何操作,消耗内存最少。
中强度状态:时间偏长的操作应用。
高强度状态:高强度使用应用,可以跑monkey来测试(通常用来测试内存泄漏)。
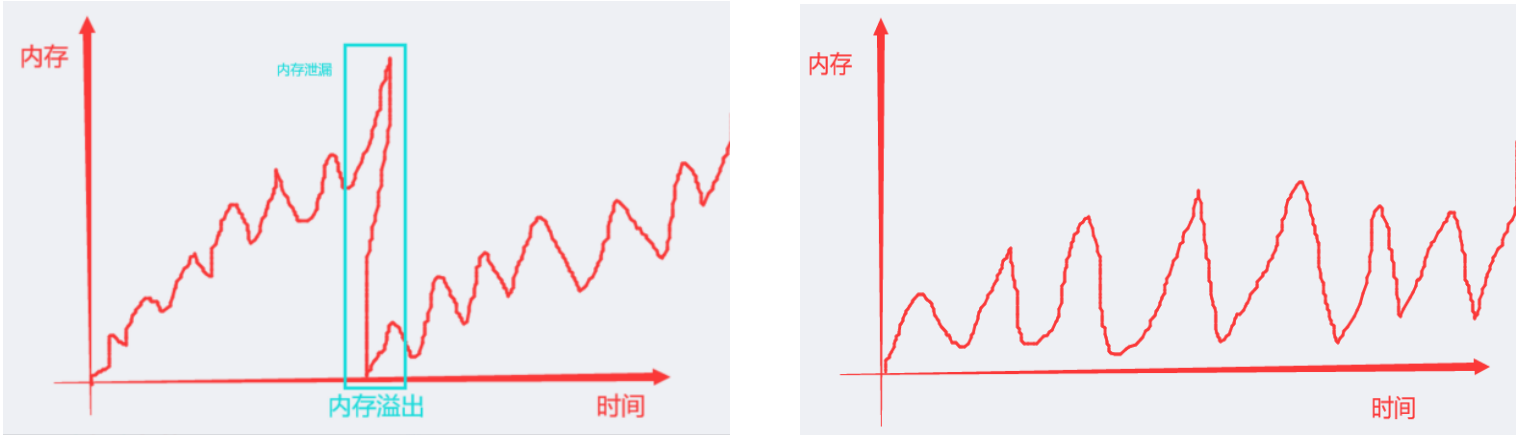
内存泄漏:指应用里的内存一直没有释放,内存一直增加,系统内存一直减少
方法一:
异常曲线图: 正常曲线图:

分析:
测试数据结果分析:本次测试结果显示内存占用率平均值为55.35%,未超过行业标准值80%。通过对数据图分析,存在内存泄漏及内存溢出的问题,建议优化。
优化建议:
尽量少使用枚举
尽量使用静态内部类而不是内部类
尽量使用轻量级的数据结构
谨慎使用static关键字
谨慎使用单例模式
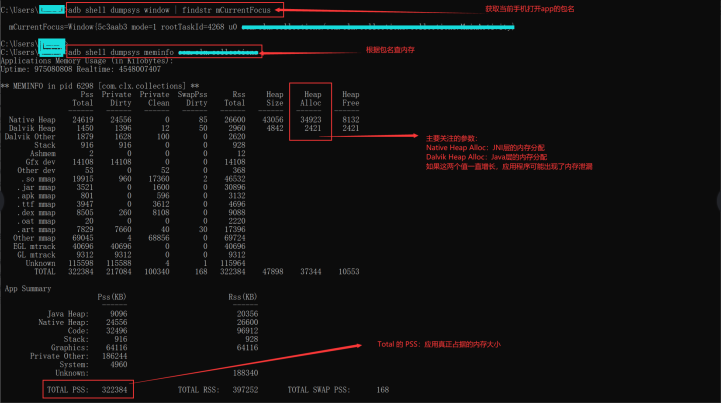
方法二:
测试关注点:
Native heap alloc
Dalvik heap alloc
PSS
流量

上行的均值加下行的均值得kb值:((上行+下行)/1000) /(网络带宽(1000Mb)/8) = 网络带宽的利用率(百分比)
阈值:70%,大于是潜在的瓶颈小于就没有
测试怎么测: 例如: 1小时持续刷新,查看流量消耗,使用了多长时间,消耗了多少流量。
流量优化方法:
数据的压缩
不同数据格式的采用
控制访问的频次
只获取必要的数据
缓存机制
针对不同的网络类型设置不同的访问策略
{[(8854.40+13965.92)/1000]/(1000/8)}*100%=18.25%
测试数据结果分析:本次测试结果显示调度中心上报端app网络宽带的利用率为18.25%,未超过阈值70%,测试通过。
FPS
FPS是图像领域中的定义,是指画面每秒传输帧数,通俗来讲就是指动画或视频的画面数。FPS是测量用于保存、显示动态视频的信息数量。每秒钟帧数愈多,所显示的动作就会愈流畅。
一般来说,Android设备的屏幕刷新率为60帧/s,要保持画面流畅不卡顿,要求每一帧的时间不超过1000/60=16.6ms,这就是16ms的黄金准则,如果中间的某些帧的渲染时间超过16ms,就会导致这段时间的画面发生了跳帧,因此原本流畅的画面变发生了卡顿。
帧率(FPS): 每秒切换多少帧,60fps为最佳
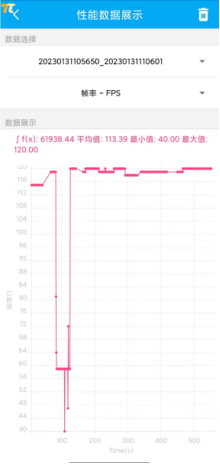
测试数据结果分析:本次测试结果显示FPS平均值为113.39帧/s,超过行业标准值最佳60帧/s。测试不通过,建议优化。
FPS优化建议:
减少页面层级,防止过度绘制
优化组件延迟加载
资源预加载,减小资源尺寸
电量
测试应用对电量的消耗前需要对手机本身的电量消耗有个大概了解,测试前先看规定时间内手机正常待机下(重启后待机)电量消耗为多少。然后再启动待测试APP看看消耗的电量增加了多少取差值。
测试点:
测试手机安装目标APK前后待机功耗无明显差异;
常见使用场景中能够正常进入待机,待机电流在正常范围内;
长时间连续使用应用无异常耗电现象。
使用了多长时间,消耗了多少电量
测试怎么测: 例如: 1小时持续刷新,查看电量消耗
常见的电量消耗较大的场景:
定位,尤其是调用GPS 定位。
网络传输,尤其是非Wi-Fi 环境。
屏幕亮度
CPU 运算:复杂的运算逻辑、死循环等会直接导致CPU负载过高,会导致耗电;
wake_locker(锁屏-解锁)时间和次数
注意: 公司是否有基线要求,如果有要求,那么我们需要去检验产品是否达标;如果没有基线,可以和竞品对比测试。
测试方法:
重启adb
adb kill-server
adb start-server
adb devices
重置电池数据
adb shell dumpsys batterystats --enable full-wake-history
adb shell dumpsys batterystats --reset
拔掉数据线,测试完成后使用数据线连接电脑,收集电量数据
adb shell dumpsys batterystats > D:/batterinfo.txt
根据包名找到对应的UID
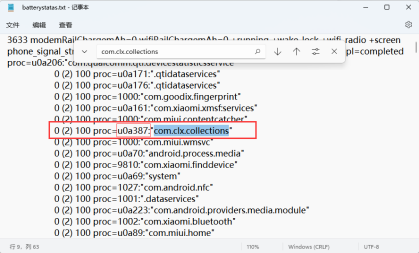
根据UID查询电量消耗
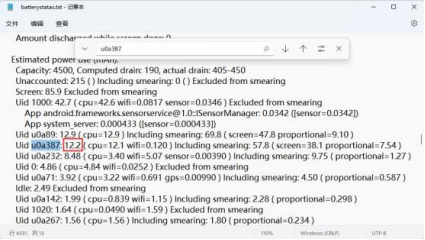
用这个数值乘以电池用容量然后再除以使用时间就等于每分钟耗电量
测试数据结果分析:本次测试结果显示调度中心上报端每分钟耗电量=4500*12.2%/26=21.12mAh,正常操作手机每分钟的耗电量=4500*12%/26=20.76mAh。经过数据对比,长时间连续使用无异常耗电现象,测试通过。
GPU
GPU渲染是指在一个像素点上绘制多次(超过一次):显示一个什么都没有做的activity界面算作画了1层,给activity加一个背景是第2层,在上面放了一个Text View(有背景的Text View)是第3层,Text View显示文本就是第4层仅仅只是为了显示一个文本,却在同一个像素点绘制了四次,这是一定要优化的。过度绘制对动画性能的影响是极其严重的,如果你想要流畅的动画效果,那么一定不能忽视过度绘制。
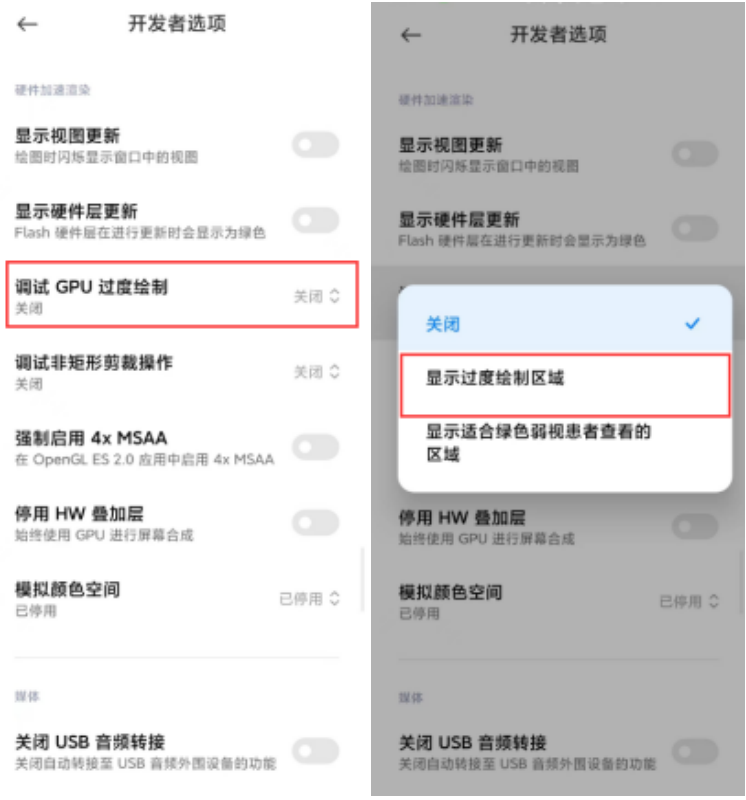
测试方法:手机自动的Debug GPU overdraw
测试步骤:
打开手机—>设置—>开发者选项—>Debug GPU overdraw—>show overdraw areas
打开被测的应用
GPU过渡渲染不同的颜色代表不同的绘制程度
原色:无过渡绘制
蓝色:绘制一次(理想状态)
绿色:绘制二次
浅红:绘制三次(可以优化)
深红:绘制四次(必须优化)
测试指标:
控制过渡绘制为2x
不允许存在4x过渡绘制
不允许存在面积超过屏幕1/4的3x过渡绘制
查询无响应

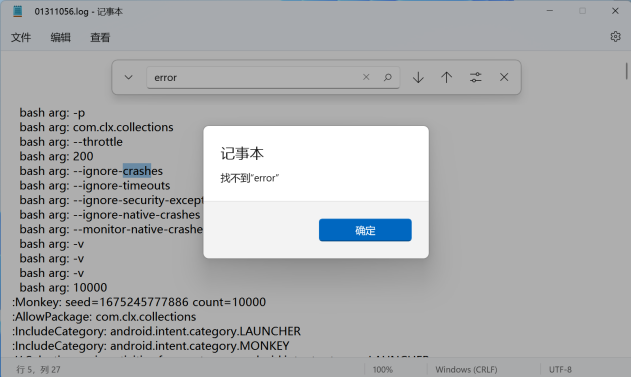
查询闪退崩溃
查询错误
查询异常
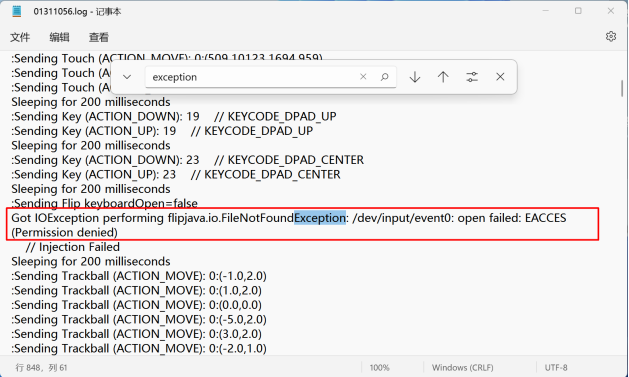
Got IOException performing flipjava.io.FileNotFoundException: /dev/input/event0: open failed: EACCES (Permission denied)
测试数据结果分析:本次稳定性测试查询出现异常。
结语:
编写不易,大家多多支持。
最后祝大家在计算机道路上一路长虹!!!
最后祝大家在计算机道路上一路长虹!!!
最后祝大家在计算机道路上一路长虹!!!