Use association rules to analyze stock data--data from tushare big data community
Since Tushare has been in operation for more than three years, the data has been improved in breadth and depth, and the Pro version has made greater improvements on this basis.
The data content will be expanded to include stocks, funds, futures, bonds, foreign exchange, industry big data, and a financial big data platform of all data categories including blockchain data such as digital currency market, providing various financial investment and researchers with Applicable data and tools.

1. Development environment
1. Programming: python3.7+jupyter
2. Algorithm: apriori algorithm that comes with python
2. Data source: tushare big data community
2. Goals
Use association rules to analyze which stocks have risen and I have risen over a period of time (association).
3. Association rules (you have learned before and skip to the fourth step)
1. Definition of association rules
Association rule mining allows us to discover the relationship between items (item and item) from the data set. It has many application scenarios in our lives, and "beer diapers" is a common scenario.
Concepts that need to be understood: support, confidence, and promotion;
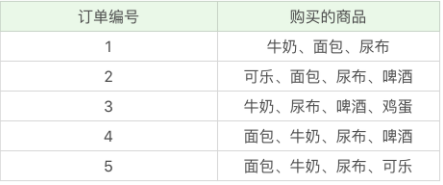
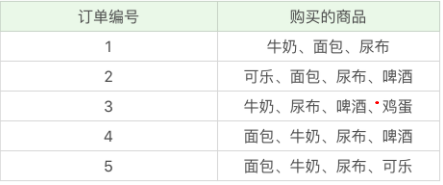
2. Example of beer diapers

2.1 Support
Support is a percentage, which refers to the ratio between the number of occurrences of a product combination and the total number of times. The higher the support, the greater the frequency of occurrence of this combination.
suopport(X)=The number of times all items in the collection X appear in a record at the same time/the number of data records
For example:
support ({beer})
= the number of times beer appears/total number of records
=3/5=60%
In this example, we can see that "beer" appears 3 times, then the support of "milk" in these 5 orders is 3/5=0.6.
Similarly, "milk+bread" appears 3 times, then the support degree of "milk+bread" in these 5 orders is 3/5=0.6.
2.2 Confidence
Confidence can be seen as a conditional probability, that is, when you buy product A, how likely is it to buy product B. The higher the confidence level, the more likely it is that Y will appear if the condition X is true.
Confidence (X->Y) = the number of times the items in the collection X and the collection Y appear in a record/the number of occurrences of the collection X.

In the example above:
Confidence (milk → beer) = the number of times milk and beer appear at the same time/the number of times milk appears = 2/4=0.5, which means that if you buy milk, there is a probability of 0.5 that you will buy beer.
Confidence (beer → milk) = 2/3 = 0.67, which means that if you buy beer, there is a 0.67 probability that you will buy milk.
2.3 Lift
When we make product recommendations, we focus on the degree of promotion, because the degree of promotion represents the degree of "the appearance of product A increases the probability of product B's appearance". Lift is an indicator to measure whether a rule is available, and it describes how much the use of the rule can improve compared to not using the rule.
There are three possibilities for lift:
(1) The lift degree is greater than 1, which means there is a lift, and the rule is valid;
(2) The lift degree is equal to 1, which means there is no lift and no decline;
(3) The lift degree is less than 1, which means there is a decline.
Calculation formula lift (X->Y)=confidence(X->Y)/supper(Y)
For example: lift({milk}->{beer}) =confidence({milk}->{beer})/support(beer) =0.5/0.6=0.83
2.4 Association Rules
Collaborative Filtering (CF for short) is used to mine valuable data items from a large amount of data.
Two disjoint non-empty sets X, Y, if there is X->Y, it is said that X->Y is an association rule.
Strength: support, confidence.
Validity: Lift (Lift).
2.5 Beer and diapers
from efficient_apriori import apriori

data = [['牛奶','面包','尿布'],
           ['可乐','面包', '尿布', '啤酒'],
           ['牛奶','尿布', '啤酒', '鸡蛋'],
           ['面包', '牛奶', '尿布', '啤酒'],
           ['面包', '牛奶', '尿布', '可乐']]
import pandas as pd
pd.DataFrame()
itemsets, rules = apriori(data, min_support=0.5, min_confidence=1)
print(itemsets)
print(rules)
Itemsets counts how many times each element appears, and only a part of it is shown here.

After setting the support to 0.5 and the confidence to 1, the following elements are related under certain parameters.

4. Analysis of stock association rules
1. Libraries used
Just export the stock data into a csv file, without using the database, friends who use the database add the database by themselves (I am too lazy to add it, after all, this is an assignment I did a long time ago).
Mainly pandas, tushare and efficient_apriori library
import pandas as pd
import tushare as ts
from efficient_apriori import apriori
2. Get data
pro=ts.pro_api('e89ff146498d80dfcdc326dacbe6c397363b4a37cebadff0c81e8d23')
The pro above is an interface token that comes with tushare. After accessing it, you can get massive stock data.
The following is to get the data. Here we use the daily market, select the stock code, and indicate the start date and end date.
#获取数据
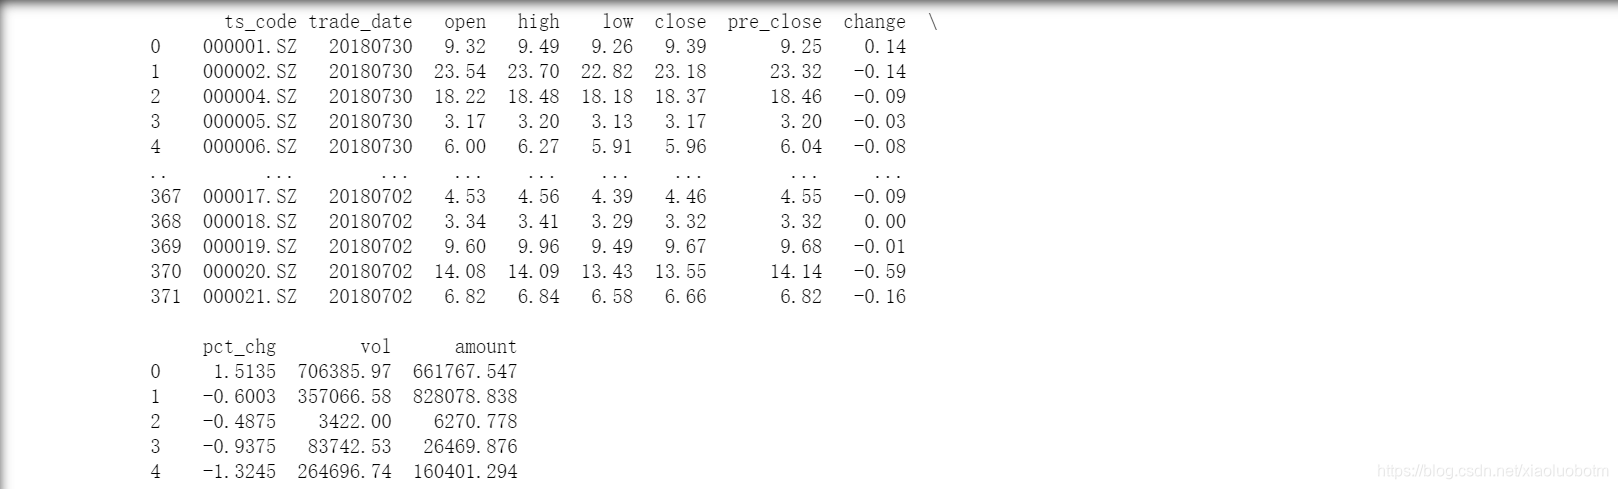
df = pro.daily(ts_code='000001.SZ,000002.SZ,000004.SZ,000005.SZ,000006.SZ,000007.SZ,000008.SZ,000009.SZ,000010.SZ,000011.SZ,000012.SZ,000014.SZ,000016.SZ,000017.SZ,000018.SZ,000019.SZ,000020.SZ,000021.SZ,000022.SZ',start_date='20180701',end_date='20180730')
df.to_csv("股票数据.csv")
print(df)
In fact, it can be used without converting it into a csv file. The main reason is that the data may be used in the future. As shown in the figure, there are parameters such as the opening price, the highest price, the lowest price, and the increase and decrease.
3. Data classification
Python's library is very powerful, and it is relatively simple to write programs.
I have data just now, but this is the data of each stock at different times. If you want to do association rule analysis, you must put the data of the same day together, just like the beer diapers sold every day above.
Here I use a stupid method. First, I filter the data with a rise and fall >= 3%, and then compare the date and put together the stock data with a rise and fall of >= 3% on the same day. If you have a good idea, please comment District exchange.
#数据整理
df=df[df['pct_chg']>=3]
print(df)
a1=list(df[df['trade_date']=='20180703']['ts_code'])
a2=list(df[df['trade_date']=='20180704']['ts_code'])
a3=list(df[df['trade_date']=='20180706']['ts_code'])
a4=list(df[df['trade_date']=='20180709']['ts_code'])
a5=list(df[df['trade_date']=='20180710']['ts_code'])
a6=list(df[df['trade_date']=='20180712']['ts_code'])
a7=list(df[df['trade_date']=='20180713']['ts_code'])
a8=list(df[df['trade_date']=='20180717']['ts_code'])
a9=list(df[df['trade_date']=='20180718']['ts_code'])
a10=list(df[df['trade_date']=='20180720']['ts_code'])
a11=list(df[df['trade_date']=='20180723']['ts_code'])
a12=list(df[df['trade_date']=='20180724']['ts_code'])
a13=list(df[df['trade_date']=='20180725']['ts_code'])
a14=list(df[df['trade_date']=='20180726']['ts_code'])
a15=list(df[df['trade_date']=='20180727']['ts_code'])
a16=list(df[df['trade_date']=='20180730']['ts_code'])
data=[a1,a2,a3,a4,a5,a6,a7,a7,a8,a9,a10,a11,a12,a13,a14,a15,a16]
print(data)
The result is like this.

It can be seen that although we have selected many stocks before, in fact, few stocks have risen. This is not very beneficial for data analysis. If you are interested, you can choose more.
4. Association rules (super simple)
Python has a lot of libraries, and you don't need to edit many things yourself, it has them all.
#关联规则
results = list(apriori(data, min_support=0.1,min_confidence=1))
print(results)
It can be seen that the support of my choice is extremely low, because there are really too few stocks that have been rising or rising most of the time (it may also be that the stock sample is too small or the sample is not well selected).
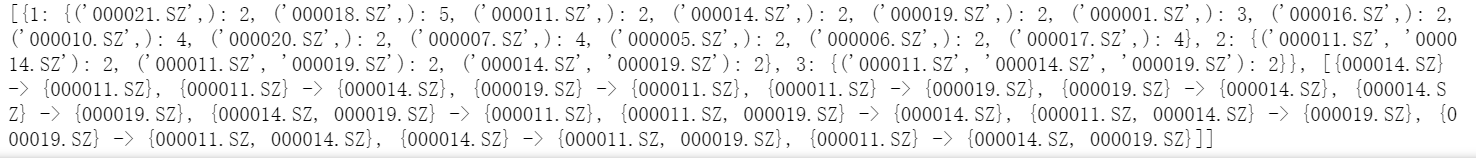
The number of times is counted in the front, and the analysis results of association rules are in the back. The result is not very good, here is just to provide you with an idea.
V. Summary
This time, the use of association rules to analyze stock data provides a reference for stock selection, and the idea of programming is probably like this.
According to the results, it can be used as a reference for stock selection, such as who and who always go up together. We can draw conclusions through association rule analysis.
Of course, the choice of stock sample selection, support, and confidence is slowly adjusted according to your own needs.