Python tushare stock big data analysis and report generation
Foreword :
After getting the data from tushare (introduced in my blog post), the next step is to analyze the data. After the analysis, you can also generate docx analysis reports in batches. In the early stage, I must install the docx library. For specific libraries to be installed, please install according to which libraries you lack. If you don't understand, please contact Du Niang. Hahaha, I have a lot of nonsense, the following enter the topic and post the code:
import pandas as pd
import tushare as ts
import docx
import os
import time
import warnings
from docx.shared import Cm, Inches
from docx.enum.text import WD_ALIGN_PARAGRAPH
warnings.filterwarnings('ignore')
pd.set_option('expand_frame_repr', False)
os.chdir('D:/all_trading_data')
#此路径必须改为放数据的路径且中间的不能缺失任何一天数据,例如get_analysis_stockdata('20200101', '20200106'),
#那么你放数据文件夹内不能缺少任何一个这段时期内的交易数据文件,否则报错
pro = ts.pro_api('要到tushare官网注册个账户然后将token复制到这里,可以的话请帮个忙用文章末我分享的链接注册,谢谢')
def get_analysis_stockdata(st_date, ed_date):
#获取st_date,ed_date时间段内的交易日期
trade_d = pro.trade_cal(exchange='SSE', is_open='1',start_date=st_date,end_date=ed_date,fields='cal_date')
for date_now in trade_d['cal_date'].values: #将以上获取时间段的交易日期赋值给date_now
# 读取时间段内每日的股票数据
df = pd.read_csv('{}_ts.csv'.format(str(date_now)), encoding='gbk')
#fillna填充缺失数据,传入inplace=True直接修改原对象
df.fillna(0, inplace=True)
df.replace('nan ', 0, inplace=True)
#astype强制将涨幅,PE,总市值,流通市值转换成float格式,ts_code转化成str后,NAN也变成nan str格式
df[['change', 'pe', 'total_mv', 'circ_mv']] = df[['change', 'pe', 'total_mv', 'circ_mv']].astype(float)
df['list_date'] = pd.to_datetime(df['list_date'])
df['ts_code'] = df['ts_code'].astype(str)
# 添加交易所列
df.loc[df['ts_code'].str.startswith('3'), 'exchange'] = 'CY'
df.loc[df['ts_code'].str.startswith('6'), 'exchange'] = 'SH'
df.loc[df['ts_code'].str.startswith('0'), 'exchange'] = 'SZ'
# 找出上涨的股票
df_up = df[df['change'] > 0.00]
# 走平股数
df_even = df[df['change'] == 0.00]
# 找出下跌的股票
df_down = df[df['change'] < 0.00]
# 找出涨停的股票
limit_up = df[df['change'] >= 9.70]
limit_down = df[df['change'] <= -9.70]
# 涨停股数中的未封板股,上市日期小于15天
limit_up_new = limit_up[pd.to_datetime(date_now) - limit_up['list_date'] <= pd.Timedelta(15)]
# 涨停股数中次新股,上市日期小于1年
limit_up_fresh = limit_up[pd.to_datetime(date_now) - limit_up['list_date'] <= pd.Timedelta(365)]
# 涨停股数中的未封板股,上市日期小于15天
limit_down_new = limit_down[pd.to_datetime(date_now) - limit_down['list_date'] <= pd.Timedelta(15)]
# 涨停股数中次新股,上市日期小于1年
limit_down_fresh = limit_down[pd.to_datetime(date_now) - limit_down['list_date'] <= pd.Timedelta(365)]
#df_up.shape[0]获取上涨的行数
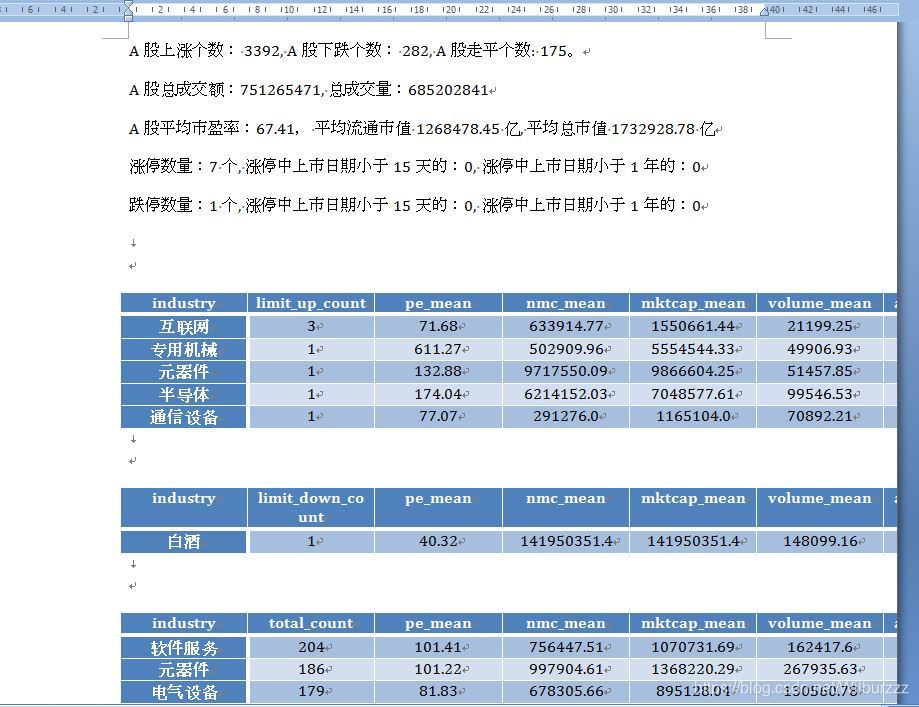
print('A股上涨个数: %d, A股下跌个数: %d, A股走平个数: %d。' % (df_up.shape[0], df_down.shape[0], df_even.shape[0]))
print('A股总成交额:%d, 总成交量:%d' % (df['amount'].sum(), df['vol'].sum()))
print('A股平均市盈率:%.2f, 平均流通市值 %.2f 亿, 平均总市值 %.2f 亿' % (df['pe'].mean(), df['circ_mv'].mean(), df['total_mv'].mean()))
print('涨停数量:%d 个, 涨停中上市日期小于15天的:%d, 涨停中上市日期小于1年的:%d' % (limit_up.shape[0], limit_up_new.shape[0], limit_up_fresh.shape[0]))
print('跌停数量:%d 个, 涨停中上市日期小于15天的:%d, 涨停中上市日期小于1年的:%d' % (limit_down.shape[0], limit_down_new.shape[0], limit_down_fresh.shape[0]))
def get_output(df, columns='_industry', name='_limit_up'):
# df.copy(deep= False)和df.copy()都是浅拷贝,是复制了旧对象的内容,然后重新生成一个新对象,改变旧对象不会影响新对象。
df = df.copy()
output = pd.DataFrame()
#df.groupby(columns)根据列值分组数据,并根据股票代码统计数据
output = pd.DataFrame(df.groupby(columns)['ts_code'].count())
output['pe_mean'] = round(df.groupby(columns)['pe'].mean(),2)
output['nmc_mean'] = round(df.groupby(columns)['circ_mv'].mean(),2)
output['mktcap_mean'] = round(df.groupby(columns)['total_mv'].mean(),2)
output['volume_mean'] = round(df.groupby(columns)['vol'].mean(),2)
output['amount_mean'] = round(df.groupby(columns)['amount'].mean(),2)
#依据ts_code进行降序,排序后的数据集替换原来的数据
output.sort_values('ts_code', ascending=False, inplace=True)
#改列值名字,将ts_code改成name+‘_count’的形式
output.rename(columns={
'ts_code': name + '_count'}, inplace=True)
return output
file = docx.Document()
file.add_paragraph('A股上涨个数: %d, A股下跌个数: %d, A股走平个数: %d。' % (df_up.shape[0], df_down.shape[0], df_even.shape[0]))
file.add_paragraph('A股总成交额:%d, 总成交量:%d' % (df['amount'].sum(), df['vol'].sum()))
file.add_paragraph('A股平均市盈率:%.2f, 平均流通市值 %.2f 亿, 平均总市值 %.2f 亿' % (df['pe'].mean(), df['circ_mv'].mean(), df['total_mv'].mean()))
file.add_paragraph('涨停数量:%d 个, 涨停中上市日期小于15天的:%d, 涨停中上市日期小于1年的:%d' % (limit_up.shape[0], limit_up_new.shape[0], limit_up_fresh.shape[0]))
file.add_paragraph('跌停数量:%d 个, 涨停中上市日期小于15天的:%d, 涨停中上市日期小于1年的:%d' % (limit_down.shape[0], limit_down_new.shape[0], limit_down_fresh.shape[0]))
file.add_paragraph('\n')
for i in ['industry', 'exchange', 'area']:
# 对涨停的股票分析
output_limit_up = get_output(limit_up, columns=i, name='limit_up').reset_index()
# 对跌停的股票分析
output_limit_down = get_output(limit_down, columns=i, name='limit_down').reset_index()
# 对全量的股票分析
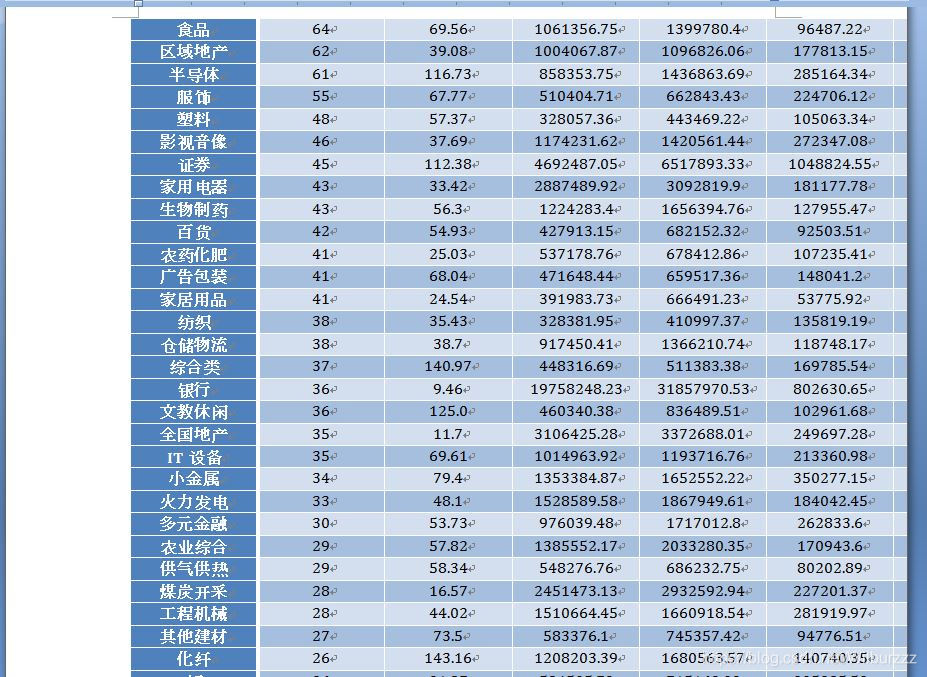
output_total = get_output(df, columns=i, name='total').reset_index()
print(output_limit_up)
print(output_limit_down)
print(output_total)
for j in [output_limit_up, output_limit_down, output_total]:
tb = file.add_table(rows=len(j.index)+1, cols=len(j.columns),style='Medium Grid 3 Accent 1')
tb.autofit = False #关闭表格行宽自适应
for x in range(len(j.columns)):
tb.cell(0, x).text = j.columns[x] #添加表列头
tb.cell(0, x).width = Inches(1.2) #设置行宽
tb.cell(0, x).paragraphs[0].alignment = WD_ALIGN_PARAGRAPH.CENTER #文字居中
for row in range(len(j.index)):
for col in range(len(j.columns)):
tb.cell(row+1, col).text = str(j.iloc[row, col]) #设置行宽
tb.cell(row+1, col).paragraphs[0].alignment = WD_ALIGN_PARAGRAPH.CENTER #文字居中
file.add_paragraph('\n') #表格换行
#之所以生成文件慢是因为output_total这个统计需要长时间写入docx,如果需要速度快你可以试着把output_total去掉
#生成一个docx文件我的电脑需要3到4分钟左右
file.save('D:\\all_data_word\\{}_分析报告.docx'.format(str(date_now)))
print('{}_分析报告分析完成'.format(str(date_now)))
if __name__=="__main__":
get_analysis_stockdata('20200101', '20200106')
Effect picture:
PS: The successful operation of this code is related to the two articles I posted earlier. If possible, please check the articles in my blog first.
Tushare registration link: link