Requirements: When there is a lot of data on the echarts chart, if you want to view the data status of some areas, you can zoom in on the data area and get the starting point of the current x-axis after zooming
marquee zoom
var mCharts = echarts.init(document.querySelector('div'))
var xDataArr1 = ['1月', '2月', '3月', '4月', '5月', '6月', '7月', '8月', '9月', '10月', '11月', '12月','1月', '2月', '3月', '4月', '5月', '6月', '7月', '8月', '9月', '10月', '11月', '12月']
var xDataArr = ['1月', '2月', '3月', '4月', '5月', '6月', '7月', '8月', '9月', '10月', '11月', '12月']
var yDataArr1 = [9000, 8800,7900, 6000, 6800, 9700, 11400, 11300, 6900, 10000, 9800, 7600]
var yDataArr2 = [300, 280, 1900, 1200, 600, 900, 1800, 2000, 2900, 500, 700, 900,300, 280, 1900, 1200, 600, 900, 1800, 2000, 2900, 500, 700, 900]
var option = {
title: {
text: '选框缩放'
},
xAxis: [{
type: 'category',
data: xDataArr
},{
triggerEvent: true,
type: 'category',
data: xDataArr1
}],
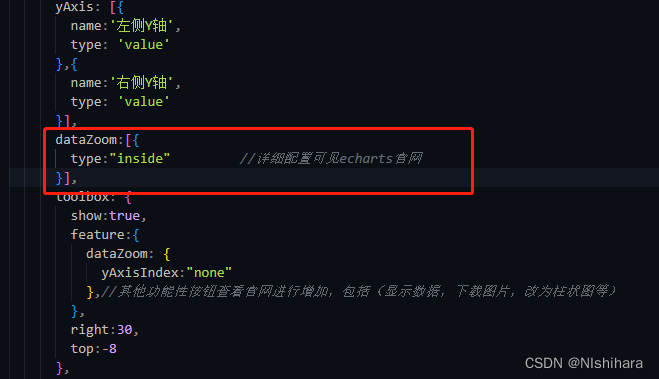
yAxis: [{
name:'左侧Y轴',
type: 'value'
},{
name:'右侧Y轴',
type: 'value'
}],
toolbox: {
show:true,
feature:{
dataZoom: {
yAxisIndex:"none"
},//其他功能性按钮查看官网进行增加,包括(显示数据,下载图片,改为柱状图等)
},
right:30,
top:-8
},
series: [
{
xAxisIndex:0,
yAxisIndex: 0,//使用哪条y轴
data: yDataArr1,
type: 'line', // 设置图表类型为 折线图
},
{
xAxisIndex:1,
yAxisIndex: 1,
data: yDataArr2,
type: 'line', // 设置图表类型为 折线图
smooth:true, // 设置图表平滑
}
]
}
mCharts.setOption(option)
// 缩放后的起始点数据
mCharts.on('datazoom', (params) =>{
console.log( mCharts.getModel().option);
let dataZoomStartIndex1 = mCharts.getModel().option.dataZoom[0].startValue;
let dataZoomEndIndex1 = mCharts.getModel().option.dataZoom[0].endValue;
let dataZoomStartIndex2 = mCharts.getModel().option.dataZoom[1].startValue;
let dataZoomEndIndex2 = mCharts.getModel().option.dataZoom[1].endValue;
//缩放后,两条x轴的起始点
console.log(xDataArr[dataZoomStartIndex1]);
console.log(xDataArr[dataZoomEndIndex1]);
console.log(xDataArr1[dataZoomStartIndex2]);
console.log(xDataArr1[dataZoomEndIndex2]);
});
Renderings:
mouse wheel zoom
- Just add to the code above
-
dataZoom:[{ type:"inside" //详细配置可见echarts官网 }],
Renderings:

scroll bar zoom
- Just add to the code above
 dataZoom:[{


        type: 'slider',//图表下方的伸缩条
     show : true, //是否显示
     realtime : true, //拖动时,是否实时更新系列的视图
     start : 0, //伸缩条开始位置(1-100),可以随时更改
     end : 100, //伸缩条结束位置(1-100),可以随时更改
      }],
Renderings: