Table of contents
1. Tab cannot be displayed after splitting
1. Introduction to the environment
2. Original report function description
3. Problems encountered in tab segmentation
2. Problem analysis and solution
3. Chart rendering during initialization
4. Re-render when tab is switched
background
Recently, I encountered a problem when using the single version of ruoyi to display Echarts multi-charts. The default Demo provided by the single version of ruoyi is that all charts are displayed on one page. If you only need to deal with this requirement in an actual project, there will be no problem. However, our proprietor has displayed 30 overall reports, and placing them on one page for centralized display will obviously clutter the interface. Therefore, in order to distinguish reports of different themes, tabs are used for page display. Then after the page design and layout, it was found that after using the tab, the chart of echarts could not be displayed normally when switching.
This article focuses on the problem that in Ruoyi's single version, after placing the echarts chart in the tab, the chart cannot be displayed normally when the interface is switched between tabs, and how to solve these problems. I hope this article can help friends who are also using the Ruoyi monolithic architecture to develop Echarts applications to avoid these problems and provide a solution. If you have a better solution, please leave a message in the comment area, thank you very much.
1. Tab cannot be displayed after splitting
1. Introduction to the environment
Here is a brief introduction to Ruoyi's single framework. Interested friends can download it from Ruoyi's official website, and clone the code locally for debugging. The front-end and back-end centralized development mode adopted by Ruoyi's monolithic architecture does not adopt the front-end and back-end separation mode. Although this mode does not separate the front-end and back-end, it is a very difficult situation in the absence of general background management applications and developers. Good development framework. An architecture suitable for enterprise development is a good architecture, and there is no more description about the architecture here.
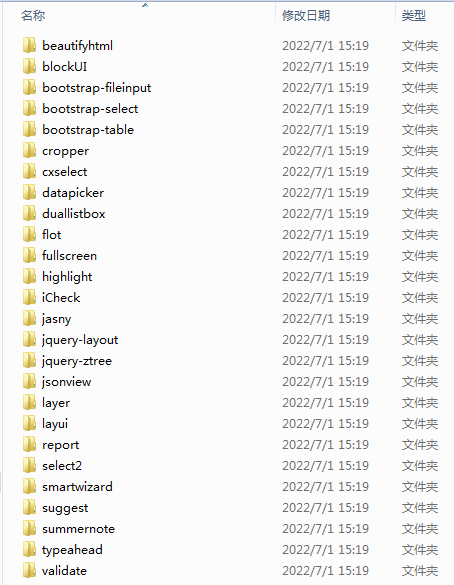
Ruoyi's front-end (let's call it the front-end when it comes to interface display), the main technologies used are: Thymeleaf, Jquery, Bootstrap, Ztree, Layui, JsonView, etc. In the chart display, the Echarts used, the specific version is 4.2. The main front-end components used are as follows:
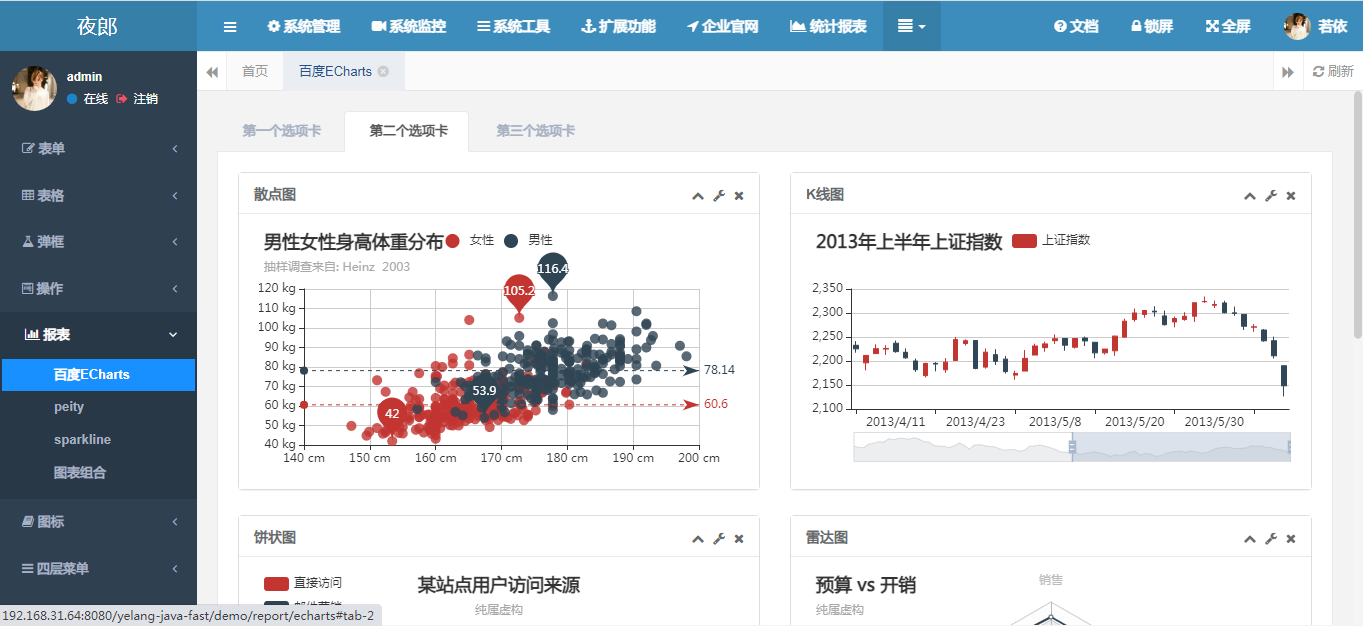
2. Original report function description
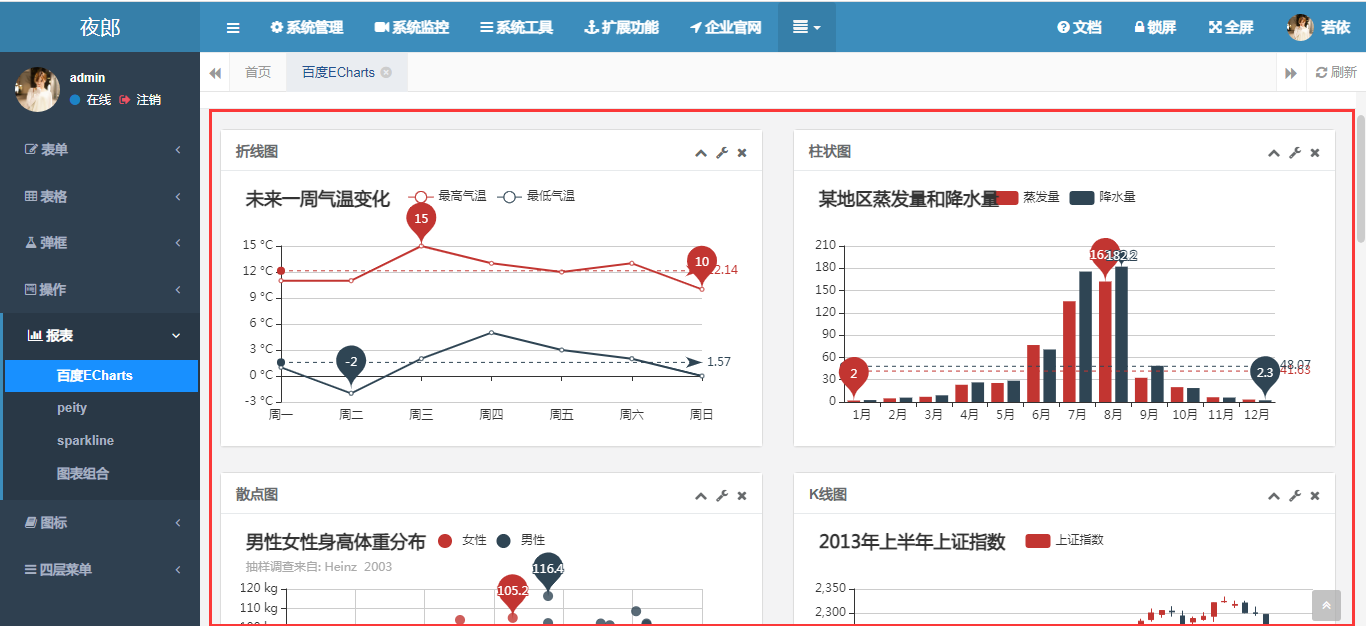
From the above interface, we can see that all the charts in the interface are displayed in one interface. In order to meet the tab display situation mentioned in the background, we expect to change to the following interface, and split the functions by theme through the tab page.
3. Problems encountered in tab segmentation
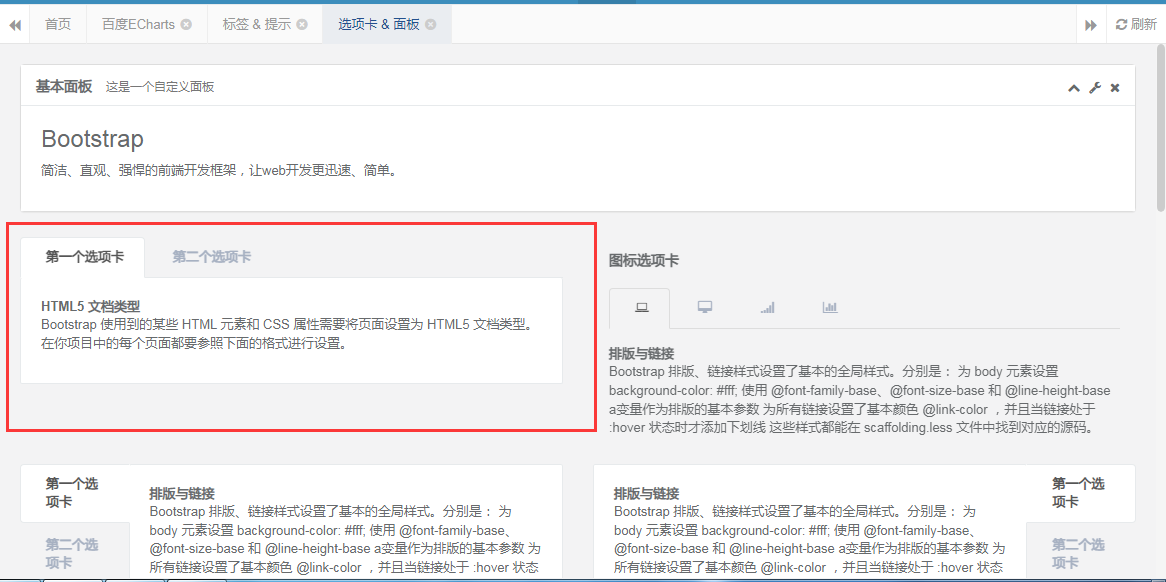
First, we introduce the tab component into the original echarts.html page to transform and expand the tab page. The key code is as follows:
<ul class="nav nav-tabs">
<li class="active"><a data-toggle="tab" href="#tab-1" aria-expanded="true"> 第一个选项卡</a>
</li>
<li class=""><a data-toggle="tab" href="#tab-2" aria-expanded="false">第二个选项卡</a>
</li>
<li class=""><a data-toggle="tab" href="#tab-3" aria-expanded="false">第三个选项卡</a>
</li>
</ul>
<div class="tab-content">
<div id="tab-1" class="tab-pane active">
</div>
<div id="tab-2" class="tab-pane">
</div>
<div id="tab-3" class="tab-pane">
</div>
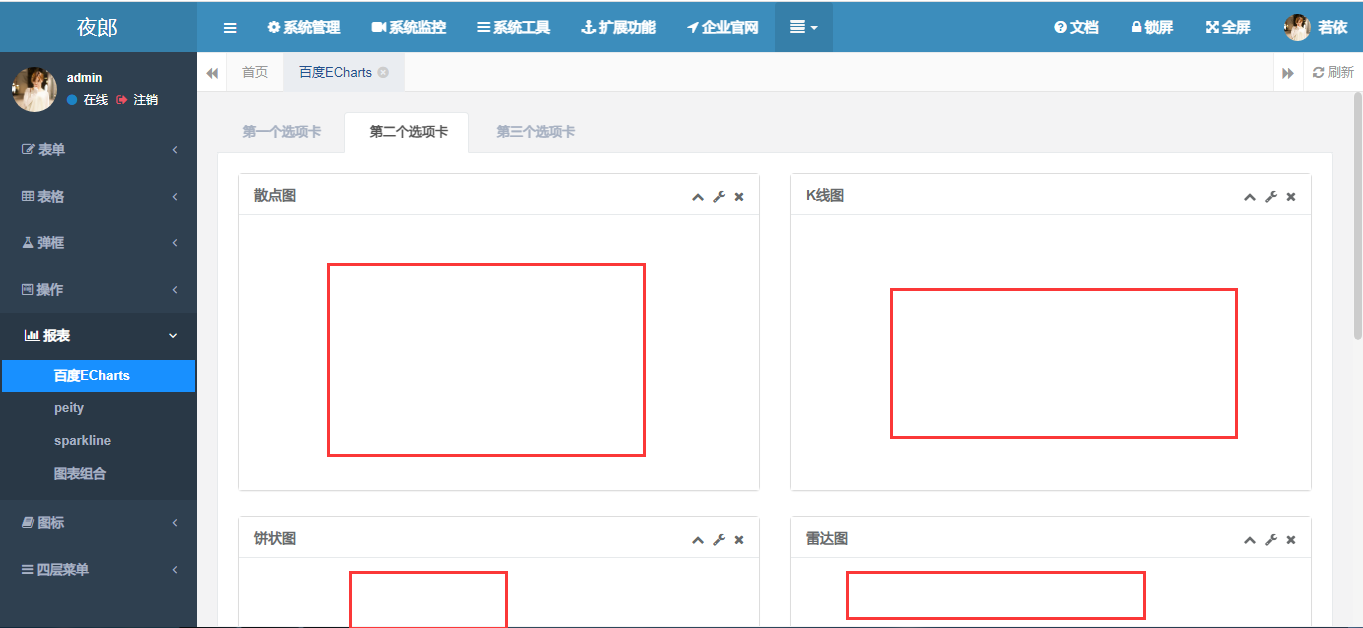
</div>On this basis, the corresponding reports of Echarts are reasonably split, and it seems that everything is further developing towards the beauty of it. But reality can be unexpected. Let's take a look at the first Tab effect:
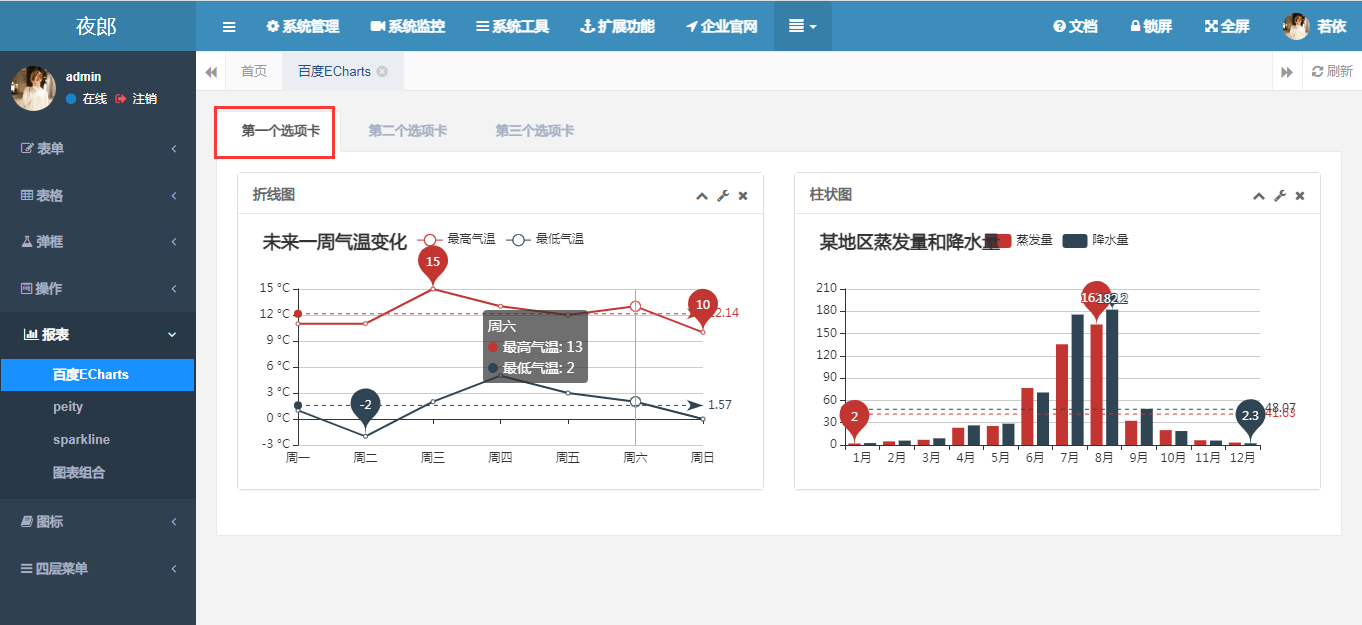
This effect looks pretty good too, don’t worry, when you click on the second tab page, you will be surprised to find that the chart has disappeared, isn’t it very strange, the same problem also exists when you click on the third tab.
2. Problem analysis and solution
1. Problem analysis
Usually if the page is blank, our first reaction is to open the developer mode and see if there is an error message on the interface. According to the error message, we can find out the clues. Here we still use this model. Turn on the debug mode of the Chrome browser and observe the console.
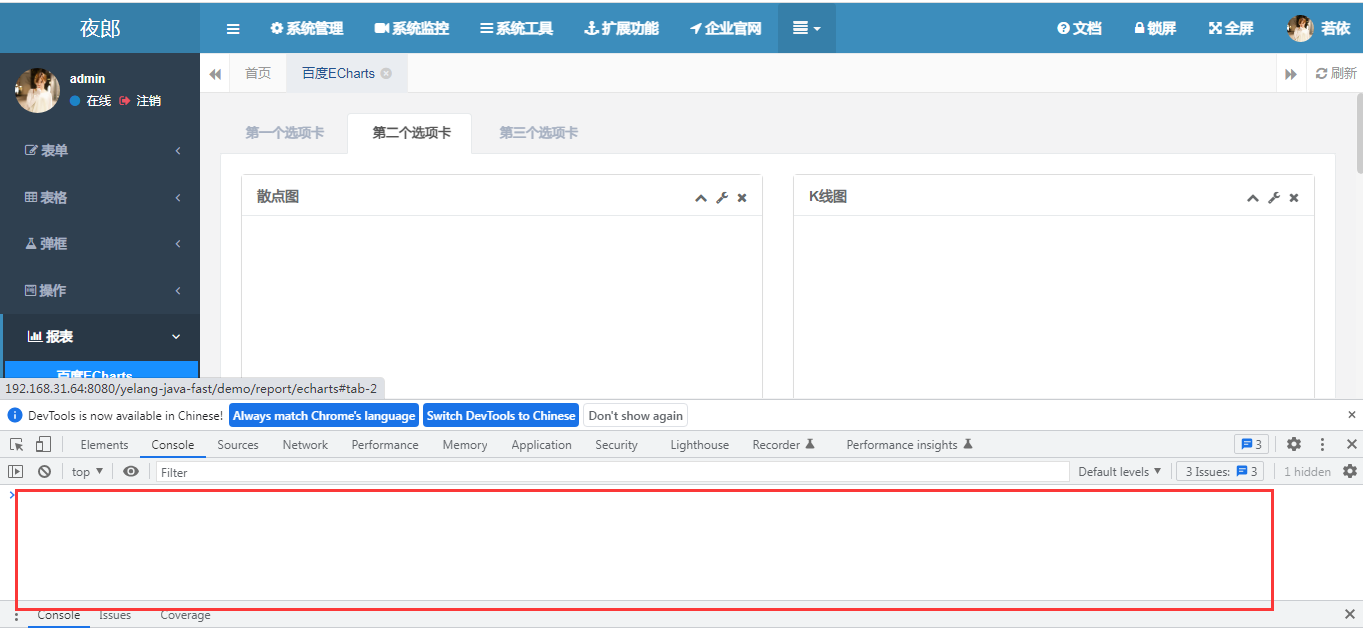
You'll find that the console really doesn't have any errors, not even warnings. Is this about to crash, where exactly did the chart go.
At this time, if you friends zoom in or out the browser window, or increase the height of the console window, you will find that the chart actually comes out. Careful friends must have discovered something. After the window size changes, the chart comes out .

When we know that the chart can be re-rendered when the page changes, we can roughly understand the problem, the rendering problem of the chart. Due to the responsive design of bootstrap, when the tab page is switched, the height of the div where the chart is located is not directly set. The height is set after the tab is switched, but the chart has no height and cannot be displayed normally.
2. Problem solving
Once you know the root of the problem, you can fix it. It only needs to be modified in two places, resize and redraw all the charts when the page is loaded, and resize the charts when the tab page is switched. In order to achieve chart redrawing, all chart instances need to be registered in the array, and the redrawing can be realized through array loop traversal. In terms of performance, you don’t need to traverse all of them, just redraw the chart of the corresponding Tab page (this article will not talk about this mode for the time being, and interested friends can expand it independently). To achieve traversing all, you must first define a collection for saving chart objects.
var charts = new Array();After initializing the chart, add the specific chart object to the array,
lineChart.setOption(lineoption);
$(window).resize(lineChart.resize);
charts.push(lineChart);
3. Chart rendering during initialization
$(window).resize(function() {
	for(var i = 0; i < charts.length; i++) {
	    charts[i].resize();
	 }
});
4. Re-render when tab is switched
In the above example, it is defined that the chart is rendered when the page is loaded, and it still needs to be re-rendered when the tab is switched, so it is also necessary to define the switch as an event.
//解决tab切换不显示问题 在加载窗口后重新渲染。
$('a[data-toggle="tab"]').on('shown.bs.tab', function(e) {
	for(var i = 0; i < charts.length; i++) {
	    charts[i].resize();
    }
});
The Javascript code for reference is as follows:
<script type="text/javascript">

    	var charts = new Array();

	    $(function () {
	        var lineChart = echarts.init(document.getElementById("echarts-line-chart"));
	        var lineoption = {
	            title : {
	                text: '未来一周气温变化'
	            },
	            tooltip : {
	                trigger: 'axis'
	            },
	            legend: {
	                data:['最高气温','最低气温']
	            },
	            grid:{
	                x:40,
	                x2:40,
	                y2:24
	            },
	            calculable : true,
	            xAxis : [
	                {
	                    type : 'category',
	                    boundaryGap : false,
	                    data : ['周一','周二','周三','周四','周五','周六','周日']
	                }
	            ],
	            yAxis : [
	                {
	                    type : 'value',
	                    axisLabel : {
	                        formatter: '{value} °C'
	                    }
	                }
	            ],
	            series : [
	                {
	                    name:'最高气温',
	                    type:'line',
	                    data:[11, 11, 15, 13, 12, 13, 10],
	                    markPoint : {
	                        data : [
	                            {type : 'max', name: '最大值'},
	                            {type : 'min', name: '最小值'}
	                        ]
	                    },
	                    markLine : {
	                        data : [
	                            {type : 'average', name: '平均值'}
	                        ]
	                    }
	                },
	                {
	                    name:'最低气温',
	                    type:'line',
	                    data:[1, -2, 2, 5, 3, 2, 0],
	                    markPoint : {
	                        data : [
	                            {name : '周最低', value : -2, xAxis: 1, yAxis: -1.5}
	                        ]
	                    },
	                    markLine : {
	                        data : [
	                            {type : 'average', name : '平均值'}
	                        ]
	                    }
	                }
	            ]
	        };
	        lineChart.setOption(lineoption);
	        $(window).resize(lineChart.resize);
	        charts.push(lineChart);

	      //console.log(charts);//打印显示是否添加进去
	        $(window).resize(function() {
	            for(var i = 0; i < charts.length; i++) {
	                charts[i].resize();
	            }
	        });

	        //data-toggle="pill还是data-toggle="tab" 根据前面所用标签页的不同来选择。我使用的是data-toggle="tab"。
	        //解决tab切换不显示问题 在加载窗口后重新渲染。
	        $('a[data-toggle="tab"]').on('shown.bs.tab', function(e) {
	            for(var i = 0; i < charts.length; i++) {
	                charts[i].resize();
	            }
	        });

	    });
    </script>
After the above code modification, it can be found that using tab switching in the interface has become very smooth, there is no chart information that cannot be displayed, and all functions are normal.
Summarize
So far, the problem of this article has been solved. This article focuses on the problem that in Ruoyi's single version, after placing the echarts chart in the tab, the chart cannot be displayed normally when the interface is switched between tabs, and how to solve these problems. I hope this article can help friends who are also using the Ruoyi monolithic architecture to develop Echarts applications to avoid these problems and provide a solution.
Reference link: Bootstrap tab page (Tab) plug-in switching echarts does not display the solution to the problem