01 OCR principle analysis
The vehicle license plate recognition part used in this paper is composed of CNN+LSTM+CTC. The whole network part can be divided into three parts. First, the backbone network CNN is used to extract the characteristic information of characters, and secondly, a deep two-way LSTM network is used. On the basis of convolutional features, the sequence features of text or characters are extracted, and finally the CTC structure is introduced to solve the problem that characters cannot be aligned during training. The detailed combination structure is shown in Figure 1.
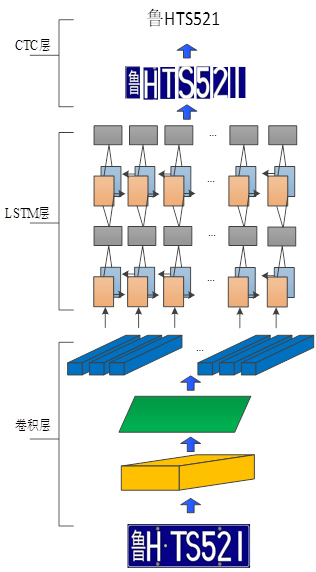
Figure 1 OCR algorithm structure diagram
(1) The backbone network CNN extracts features. Since the network only extracts the entire feature information of the number plate in the form of convolution to recognize the characters on the number plate, the input of the algorithm is the entire number plate image.
(2) LSTM extracts sequence information. LSTM as a long-short-term memory network is a special RNN structure, which can avoid the problem of long-term dependence. Different from the cyclic convolutional neural network (RNN), the RNN can save the state at different times, and the unique network structure of the LSTM can save the characteristics of four different states. The LSTM network structure unit is mainly composed of three types: the forget gate, the input gate and the output gate. Combined, the unit structure diagram is shown in Figure 2 below.

Figure 2 LSTM network unit
The forget gate mainly decides to discard and retain some of the features from the network. The implementation process is to read the network input parameter Xt and the output state ht-1 of the previous layer, and normalize it to 0-1 through the Sigmoid function In the range interval, 0 means discarded features, and 1 means features that need to be kept. The implementation formula of the forget gate is shown in formula 1:
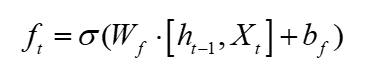
The structure of the input gate is different from that of the forget gate. This part is divided into two parts, one part is similar to the forget gate, and the other part is based on the forget gate. The feature is mapped to between -1 and 1 through the tanh function, where -1 Represents different updated parts, 1 represents the feature part that needs to be updated, as shown in formulas 2 and 3:
The sigmoid function in the output gate determines which part of the function needs to be output. The characteristics of the output part pass the tanh function and multiply it with the output of the sigmoid function to finally determine the characteristics of the output part. The realization part of the formula is shown in formulas 4 and 5:
(3) CTC structure. The CTC structure is a solution to automatic alignment in speech recognition. The application of the CTC network structure to character recognition solves the problem of artificially cutting characters, thereby improving the accuracy of the entire algorithm.
02 Production of license plate number data set
The data set used in this part of this chapter is obtained by intercepting the license plate in the picture on the basis of the first part of the data set. Write a Python script on a machine equipped with a Python environment to read the data set and parse it from the marked xml file. The position of the picture where the number plate is located. In order to ensure the integrity of the cut picture, the method of enlarging the pixel value is also adopted. For the number plate position saved in the xml file, the coordinate points of the upper left corner are respectively reduced by 5 pixels, and the coordinate points of the lower right corner are increased by 5 pixels respectively. Different from target detection, in addition to the data picture, the text on the number plate needs to be modified according to the text on the number plate. Figure 3 shows the processed trainable number plate data set.
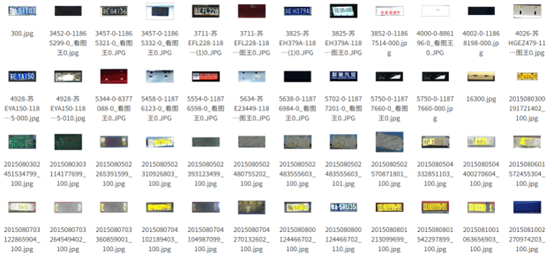
Figure 3 Number plate data set
The data after the preliminary processing is only the picture of the specific number plate, and the picture has not been marked yet, so it cannot be directly used as a data set to train the OCR algorithm. This part mainly realizes the recognition of the text on the number plate. YOLOv3 has been passed in section 3.2 of this chapter. The algorithm realizes the positioning and classification of all blocked number plates, unhanging number plates and other types of number plates. On the basis of the target detection algorithm, other types of pictures in the recognition results are selected for further processing. In addition to the quality of the picture annotation, the picture The number of also directly affects whether the final model has a better generalization ability. In addition to the normal number plate, the vehicle number plate pictures in the data set also have half-occluded number plates. Before the training, the pictures need to be processed, and the implementation process is shown in Figure 4.
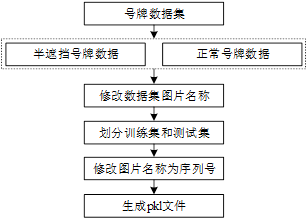
Figure 4 Flow chart of training set data processing
(1) Modify the picture name as the text of the number plate. Different from the tagging method of target detection, the tagging of the license plate should be changed to the name of the image according to the text in the actual image, and the suffix of the image remains unchanged. After the tagging of the data set is completed, the data set should be modified according to the format required by the actual project , according to the use of Python script program to divide the picture into training set and test set according to the ratio of 6:1, create a new data directory in the project, and create two paths of train/text and test/text respectively in the data folder, where train /text is used to store the processed training set images, the processed train.pkl binary file is stored in train, the test set image is stored in test/text, and the test.pkl binary file of the test set is stored in test.
(2) Generate a pkl file. The pkl file is a file format for storing binary content. During the training process, the network reads text information and corresponding pictures from the pkl file for training. Store the names of the pictures in the training set and the verification set in sequence into the newly created pkl file, named train.pkl and test.pkl, and store the corresponding picture names as serial numbers.
03 Modify the pre-weight file
In this chapter, training is performed on the basis of pre-trained weights. The advantage of using pre-trained weights is that it can not only ensure fast convergence of the model, reduce the time for training the model, but also avoid gradient explosion and gradients during the training process caused by training from scratch. Disappearance occurs. The pre-training weights store data through the subclass OrderedDict module in Python's third-party module Collections. OrderedDict is an ordered dictionary that can store elements in the order of input and ensure that the order does not change. Therefore, OrderedDict Use can guarantee that the parameters in the weight file are stored according to the level and order of the training network structure. In addition to ensuring the format order of data storage in the weight file, the storage of the weight file is also related to the equipment, storage method and network structure during the training process. related, so using pretrained weights requires an understanding of the structure of pretrained weights and how they store training. The modification of the pre-training weight in this chapter includes analyzing the weight file and modifying the dimensions of the weight file to achieve the purpose of modifying the pre-training weight file together. A specific implementation manner is shown in FIG. 5 .
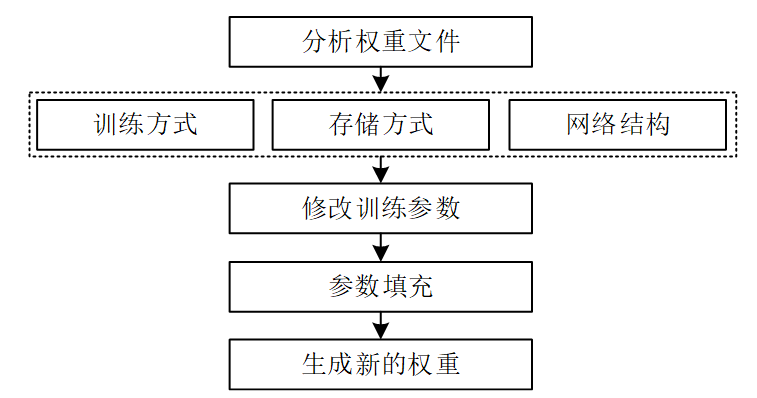
Figure 5 Modifying the implementation of the weight file
(1) Analyze the weight structure. The storage method of pre-training weights can be divided into CPU training, single GPU training and multi-GPU training according to its training method. The model structure saved in the case of CPU and single GPU is the same; according to the storage method, it can be divided into network structure of saving model and training parameters to the weight file, and only save the training parameters to the weight file; according to the storage method, it can be divided into saving the training batches in the training process, training parameters, weight files of the intermediate structure of the network structure and only saving the final training parameters There are two methods for the weight file; according to the network structure, the network structure of the weight file can be printed out through a Python script, and the network parameters that need to be modified in the weight can be modified according to requirements.
(2) Modify the dimensions of the pre-trained weights. Modifying the parameters in the network will cause the network to change. Therefore, to modify the pre-training weight file to adapt to the current network, there are two solutions: remove the node training parameters of the inappropriate network; modify the network nodes that are not suitable for training , fill its nodes. This chapter uses the second method to match the network, using Python to read the node name and dimension information in the weight, modify the parameter dimension of the first layer in the weight file and the network node parameter corresponding to the number of types at the end to the modified number of types. Save the modified weights file as a new weights file.
04 Model parameter setting and training process
Before the training process of OCR recognition, specific parameters should be set according to the training data set and hardware configuration. The specific parameter configuration is as follows.
(1) The location of the loaded data set is under the project directory cnn+lstm, open the trian_crnn.py file, modify the relative path of the picture and the pkl file in the initialization loading function in the class OCRIter, and the path of the training set picture is ./data/train/text , the training set label pkl file ./data/train, the test set image path ./data/test/text, the test set label pkl file ./data/test, and set the parameter train_flag to True, and modify the read in the engineering code pkl file name. The code for the dataset is as follows:
if train_flag:self.data_path = os.path.join(os.getcwd(), "data", "train", "text")self.label_path = os.path.join(os.getcwd(), "data", "train")else:self.data_path = os.path.join(os.getcwd(), "data", "test", "text")self.label_path = os.path.join(os.getcwd(), "data", "test")
The code to generate the pkl file is as follows:
def _label_path_from_index(self):label_file = os.path.join(self.label_path, "train_pkl")assert os.path.exists(label_file, "path dose not exits:{}".format(label_file))gt_file = open(label_file, "rb")label_file = cPickle.load(gt_file)gt_file.close()return label_file
Note: Python functions starting with an underscore in Python code represent private functions, where methods or variables starting with a single leading underscore _ are only allowed to be accessed within the class and subclasses, and instances of the class cannot access this attribute and method . Similar to the single leading underscore is the double leading underscore __, variables and methods starting with this are only allowed to be accessed within the class, and neither class instances nor derived classes can access this attribute and method.
(1) Modify the number of recognized tags. The recognized characters include numbers, letters and Chinese characters. The OCR recognition principle is equivalent to a multi-classification algorithm. Therefore, the category settings include numbers 0-1, including Chinese characters A-Hai and regional abbreviations Beijing, Tianjin, Shanxi, Hebei, Mongolia, Liao, Ji, Hei, Shanghai, Jiangsu, Zhejiang, Anhui, Fujian, Shandong, Henan, Hubei, Hunan, Guangdong, Guangxi, Qiong, Sichuan, Gui, Yun, Tibet, Shaanxi, Gansu, Qing, Ning, Yu, Jiangxi, Singapore, Taiwan, Hong Kong and Macao. The specific modification parameters are shown in Figure 6.
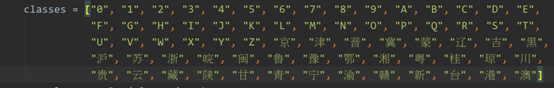
Figure 6 Dataset code configuration
(2) Modify num_epoch=6000, BATCH_SIZE=64, configure to use GPU-0 training, contexts = [mx.context.gpu(0)], the default path to generate and save weights is the model folder in the project.
05 Threshold analysis
In practical applications, the recognition of defaced and occluded license plates is not only related to the recognition rate of the algorithm, but also closely related to the quality of the collected vehicle images and the quality of the actual license plate. The quality of the license plate directly affects the final recognition performance. For example, the license plate will be subject to subjective Factors such as vehicle decking, license plate blocking, multiple license plates, etc., will also be affected by objective factors such as rust, font peeling off paint, license plate tilting, etc. In addition, it will also be affected by various factors such as weather during the shooting process, and the difference in these factors will also affect the final recognition effect to varying degrees.
The OCR recognition algorithm realizes the classification of normal number plates and semi-occluded number plates by recognizing the text on the number plate. Therefore, the OCR algorithm will generate a confidence level for each recognized character, and each character is independent of each other. It can describe the confidence degree of the entire identification number plate, and the confidence degree of the number plate is obtained by multiplying the confidence degree of each character recognized. confi represents the confidence degree of the i-th character, and conf represents the overall confidence degree of the number plate. The formula is shown in Equation 6:
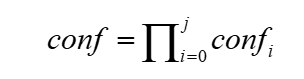
It can be seen from the formula that any character with a low confidence level among the recognized characters will directly reduce the confidence level of the entire number plate. Therefore, you can choose to filter directly according to the confidence level of the entire number plate. In this way, the purpose of distinguishing between normal number plates and semi-occluded number plates can be achieved. The detailed implementation process is shown in FIG. 7 .
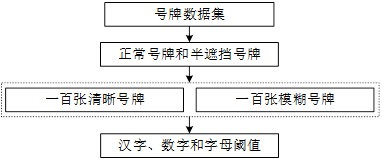
Figure 7 Threshold Analysis Flowchart
(1) Prepare data. Prepare one hundred clear number plates and blurred or semi-occluded number plates. The types of number plates should also include number plate data of various colors and types. Among them, the normal number plate is named as the normal number plate + serial number, the serial number is from 1-100, the semi-occluded number plate is named as the semi-occluded number plate + serial number, and the serial number is also 1-100, and the processed data is placed in the folder dataset .
(2) Write code. The processed data calculates the accuracy rate under different thresholds through the program, and saves the calculated accuracy rate after each modification of the threshold value, and finally generates a line chart. In the implementation process, it is judged whether the confidence of the number plate is greater than the set threshold value. If the number plate is higher than the threshold and is judged to be named as a normal number plate, it is regarded as a normal number plate. If it is lower than the threshold and is judged to contain a semi-occluded number plate The same as the correct recognition, calculate the accuracy rate of the number plate under these two conditions.
(3) Select the threshold. The confidence of the entire number plate can be obtained through formula 3-6, so using the confidence of the number plate to increase the filtering threshold can achieve the effect of classification. Write a script to count the accuracy of the verification data set under different thresholds. The number plate below the set threshold is regarded as a semi-occluded number plate, otherwise it is a normal number plate. Set the initial value to 0.5 and increase it at a speed of 0.02, so as to test The most suitable threshold value is found in the case of the highest accuracy rate. It can be seen from the figure that the threshold value is roughly proportional to the accuracy rate. When the threshold value is around 0.95, it tends to be stable, reaching an accuracy rate of 96%. Therefore, the appropriate threshold value is selected to be 0.95 , the increase graph of the experimental part is shown in Figure 8.
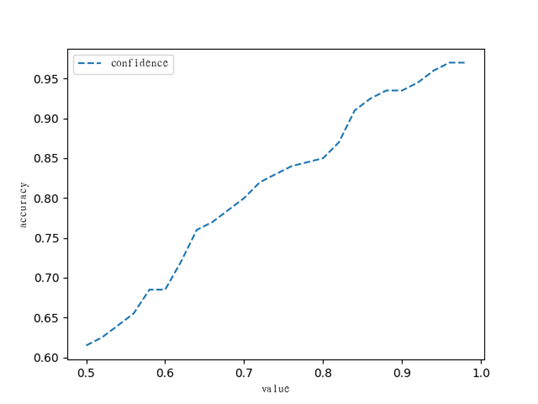
Figure 8 Threshold map
06 Experimental results
After configuring the model parameters, start the model to start training. Training the OCR model is mainly divided into two parts: generating the intermediate weight file and verifying the experimental results. The detailed process is as follows.
(1) Generate a weight file. In this chapter, it is set to generate a weight file every epoch, and the weight file is saved to the model path of the project. The name of the weight file contains the epoch value, which is used to record the number of iterations. In the case of no gradient explosion, with continuous In training, the loss value is continuously reduced, and the learning effect is better. Due to the large amount of data and the slow convergence speed, it can be set to a larger value when setting the saving interval. The interval set in this article is 1000 iterations. Save the weight file once.
(2) Select the model. The lower the loss value during the training process, the better the fitting effect on the training set, but it does not mean that the effect on the verification set is also good. Therefore, in addition to requiring the loss value to decrease continuously during the training process, it is also required to save the weight generated in the middle file, to ensure that the model in the validation set test can learn enough features and maintain better generalization ability. It has been verified that when the epoch is 4500, the accuracy rate is higher and the loss is lower. The output results of some test pictures are shown in Figure 9.
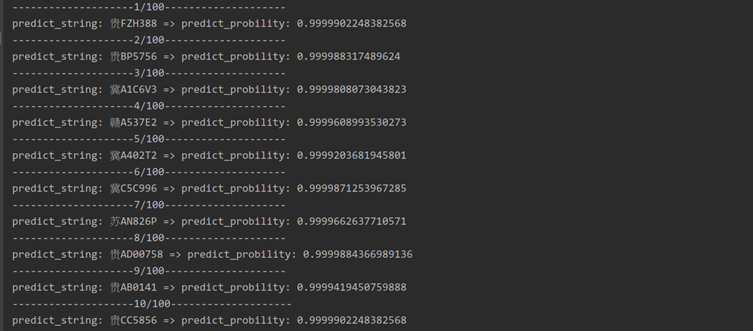
Figure 9 OCR output result
Select 200 verification sets from the data to calculate the accuracy rate, including 100 normal number plates and 100 half-occluded number plates, including number plates in various situations, such as blue cards, yellow cards, new energy, etc. wait. The metrics for verifying the OCR algorithm are the same as those for object detection.
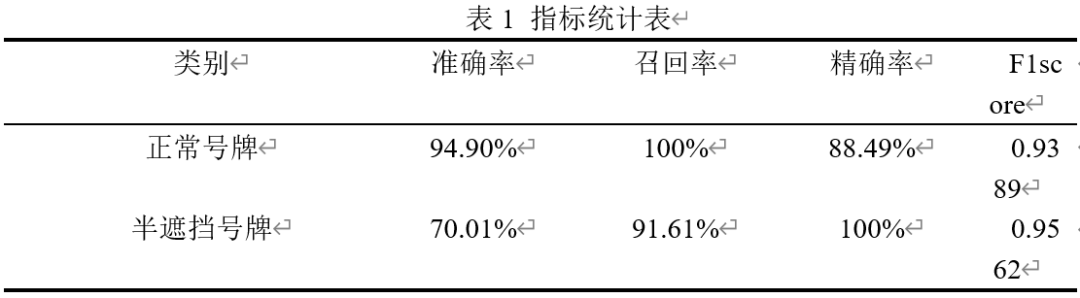
The threshold used in this experiment is 0.95 to calculate the accuracy rate, recall rate and other indicators in the verification set. The data for calculating indicators is divided into two parts, one part uses normal number plates, and the other part is semi-occluded number plates, and the other parts are calculated separately. Accuracy (accuracy), recall (recall), precision (precision) and F1score are three parts. From the table below, it can be concluded that the accuracy of identifying normal license plates in terms of accuracy is as high as 94.90%, which is much higher than half-occlusion The accuracy rate of the number plate, but the precision rate of the half-occlusion number plate can reach 100% recognition based on the recall rate of 91.61%. From the final calculation of F1score, the recognition effect of the half-occlusion number plate is better than that of the normal number plate . The calculated results are shown in Table 1.
Different test platforms will also affect its operating efficiency. In order to reduce the impact of other factors and make the comparison effect more credible, the operating system used this time is Ubuntu 16.04. The GPU test platform is NVIDIA GeForce GTX 1080 Ti graphics card, the Cuda version used is 10.0, and the Cudnn acceleration library is installed on the tested GPU platform, and the CPU platform is AMD 3550H processor. In order to realize the speed test on different platforms, the environments are set up on different platforms, and the test of running the code needs to recompile the code in addition to installing the environment according to the needs of the hardware facilities. The running speed after the test is shown in Table 2.
