If there are errors in the code, terminology, etc. in the text, please correct me
Article Directory
055 Introduction to Profiling
foreword
- of this program
- In order to know the time-consuming situation of specific code segments in your own program
- How to know very early that this code should be optimized
- So you need to manually create a simple monitoring program
the code
-
train of thought
A Timer class, Timer t in the program segment; the declaration represents construction, and the destructor is called at the end of the program segment, so as to know the time spent on the destruction and construction.
#include "Sandbox2D.h"
#include "imgui/imgui.h"

#include <glm/gtc/matrix_transform.hpp>
#include <glm/gtc/type_ptr.hpp>

#include <Hazel/Renderer/Renderer2D.h>

#include <chrono>
#include <string>
template<typename Fn>
class Timer {


public:
	Timer(const char* name, Fn&& func)
		:m_Name(name), m_Func(func), m_Stopped(false)
	{


		m_StartTimepoint = std::chrono::high_resolution_clock::now();
	}
	~Timer() {


		if (!m_Stopped) {


			Stop();
		}
	}
	void Stop() {


		auto endTimepoint = std::chrono::high_resolution_clock::now();
		// microseconds 是微秒
		long long start = std::chrono::time_point_cast<std::chrono::microseconds>(m_StartTimepoint).time_since_epoch().count();
		long long end = std::chrono::time_point_cast<std::chrono::microseconds>(endTimepoint).time_since_epoch().count();

		m_Stopped = true;

		float duration = (end - start) * 0.001f;
		// 执行函数
		m_Func({

       m_Name, duration });
	}
private:
	const char* m_Name;
	Fn m_Func;
	std::chrono::time_point<std::chrono::steady_clock> m_StartTimepoint;
	bool m_Stopped;
};
#define PROFILE_SCOPE(name) Timer timer##__LINE__(name, [&](ProfileResult profileResult){

         m_ProfileResults.push_back(profileResult);})

Sandbox2D::Sandbox2D() : Layer("Sandbox2D"), m_CameraController(1280.0f / 720.0f, true){

      }
void Sandbox2D::OnAttach(){


	//Hazel::Renderer2D::Init();
	m_SquareTexture = Hazel::Texture2D::Create("assets/textures/Checkerboard.png");
}
void Sandbox2D::OnDetach(){

      }
Sandbox2D::~Sandbox2D(){

      }
// 捕捉函数段所耗时
void Sandbox2D::OnUpdate(Hazel::Timestep ts){


	PROFILE_SCOPE("Sandbox2D::OnUpdate");
	{


		PROFILE_SCOPE("Sandbox2D::OnUpdate");
		m_CameraController.OnUpdate(ts);
	}

	{


		PROFILE_SCOPE("Renderer::Prep");
		Hazel::RenderCommand::SetClearColor({

       0.1f, 0.1f, 0.1f, 1 });
		Hazel::RenderCommand::Clear();
	}
	{


		PROFILE_SCOPE("Renderer::Draw");
		Hazel::Renderer2D::BeginScene(m_CameraController.GetCamera());
		Hazel::Renderer2D::DrawQuad({

      -1.0f, 0.0f}, {

      0.8f,0.8f}, m_FlatColor);
		Hazel::Renderer2D::DrawQuad({

       0.5f, -0.5f }, {

       0.5f, 0.8f }, {

      0.2f, 0.8f, 0.9f, 1.0f});
		Hazel::Renderer2D::DrawQuad({

       0.0f, 0.0f, -0.1f }, {

       10.0f, 10.0f }, m_SquareTexture);
		Hazel::Renderer2D::EndScene();
	}
}
void Sandbox2D::OnImgGuiRender(){


	ImGui::Begin("Settings");
	ImGui::ColorEdit4("Square Color", glm::value_ptr(m_FlatColor));
	// 在Imgui窗口上显示耗时
	for (auto& result : m_ProfileResults) {


		char label[50];
		strcpy(label, "%.3fms ");
		strcat(label, result.Name);
		ImGui::Text(label, result.Time);
	}
	m_ProfileResults.clear();

	ImGui::End();
}
void Sandbox2D::OnEvent(Hazel::Event& event){


	// 事件
	m_CameraController.OnEvent(event);
}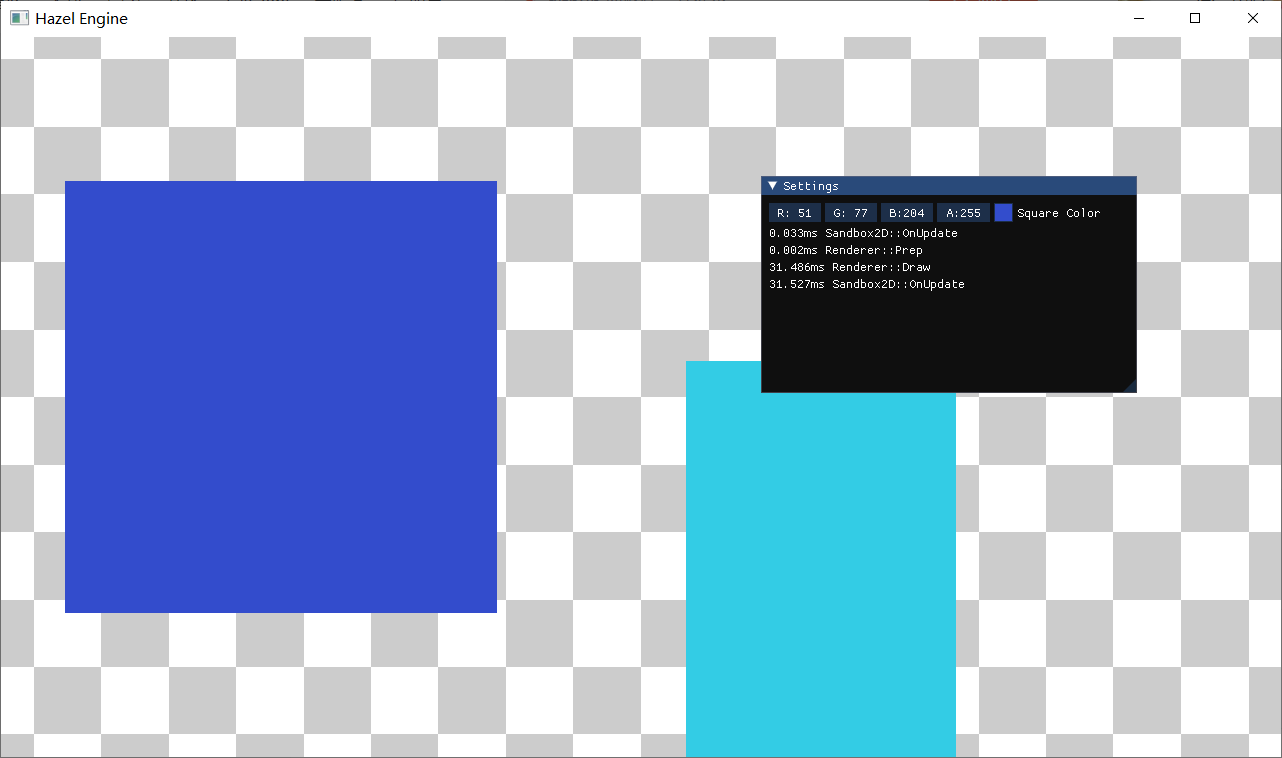
Display the time-consuming of the corresponding function on the Imgui window
056 Visual Profiling
foreword
-
Realization of 055
-
055 Real-time consumption can be seen in the program
-
But not the graphical visualization kind
-
So further encapsulation is required, and use Google's built-in widget to display real-time consumption
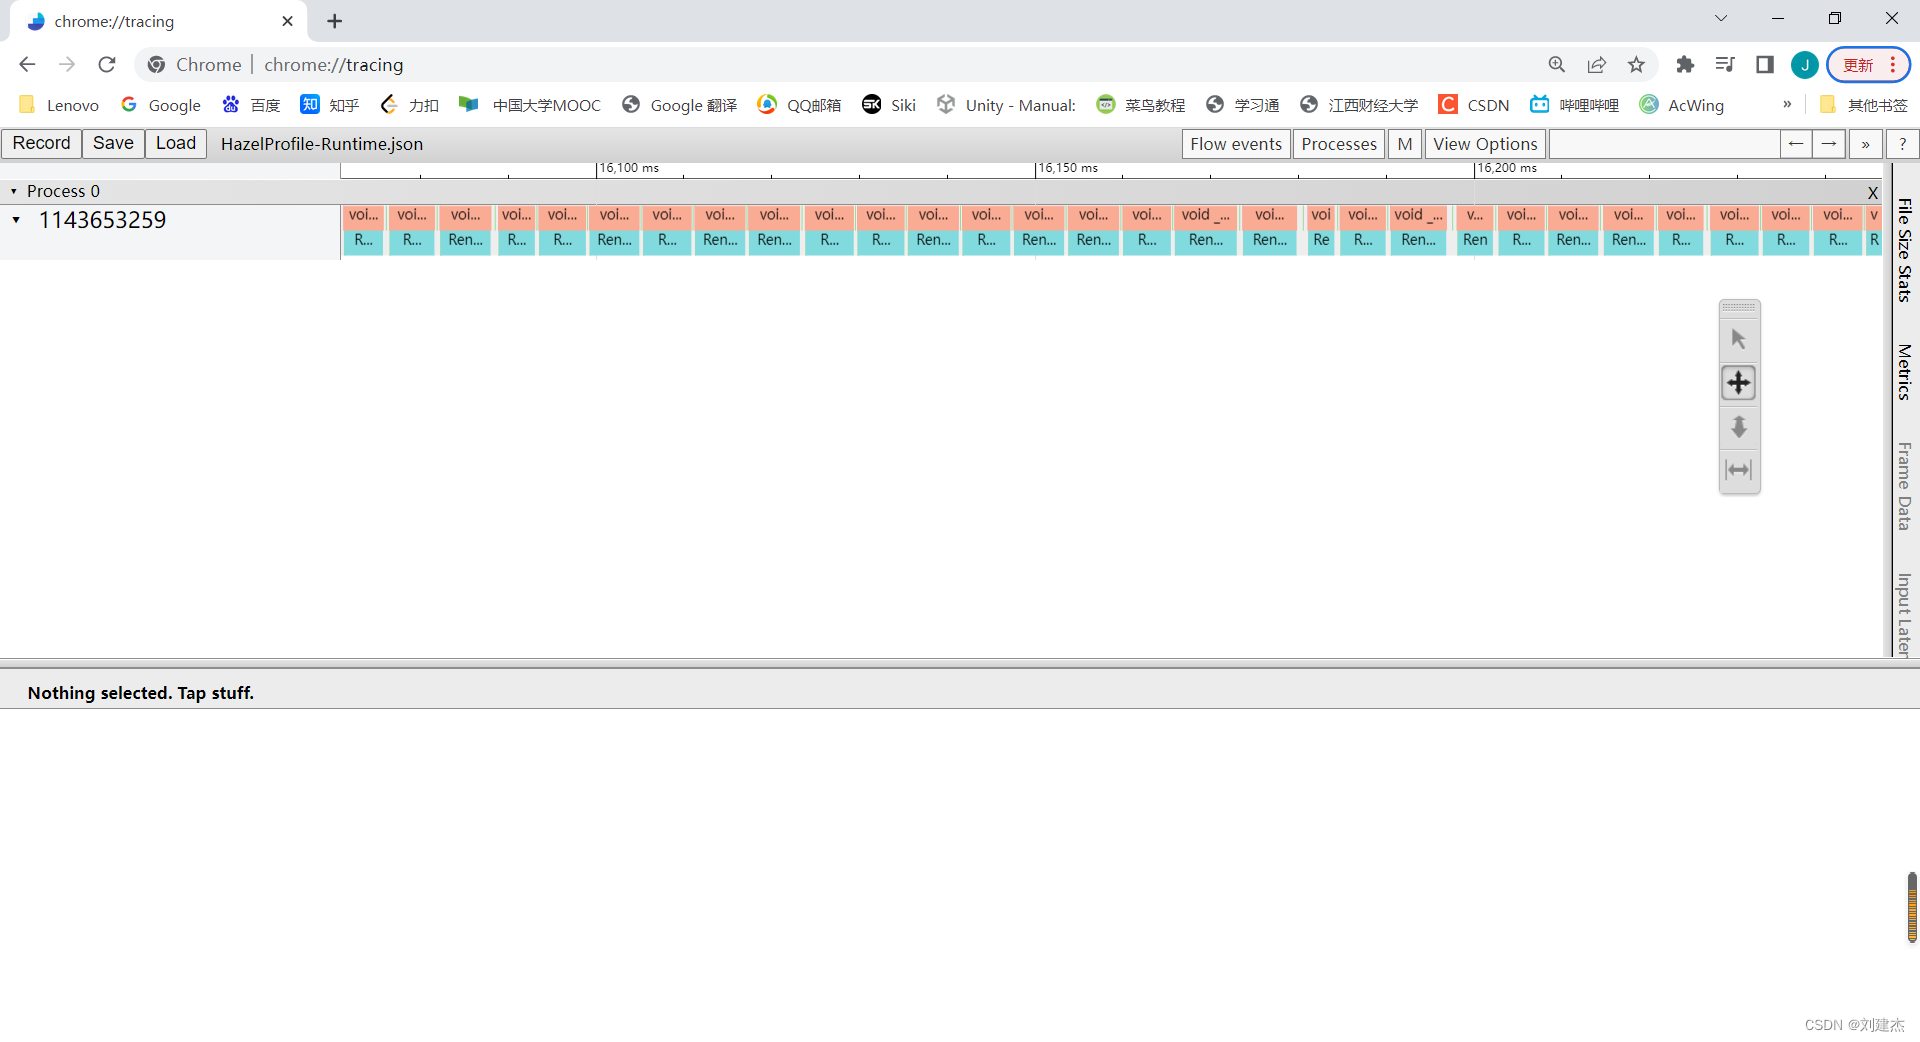
chrome://tracing/ Type this in your browser
-
-
Implementation ideas
Same as 055: Use scope, constructor to start timing, and destructor to end timing, but the output is a json file that can be parsed by the chrome browser .
Notice
-
When the program is closed, it cannot be stopped with a red square

-
Otherwise, there is a problem with the output json, and the function wirtefloot will be called less
-
Because this function is not a normal stack cleanup, the parsing fails
-
Need to click the upper right corner × of the running window normally.
the code
#pragma once

#include <string>
#include <chrono>
#include <algorithm>
#include <fstream>

#include <thread>

namespace Hazel {


	struct ProfileResult
	{


		std::string Name;
		long long Start, End;
		uint32_t ThreadID;
	};

	struct InstrumentationSession
	{


		std::string Name;
	};

	class Instrumentor
	{


	private:
		InstrumentationSession* m_CurrentSession;
		std::ofstream m_OutputStream;
		int m_ProfileCount;
	public:
		Instrumentor()
			: m_CurrentSession(nullptr), m_ProfileCount(0)
		{


		}

		void BeginSession(const std::string& name, const std::string& filepath = "results.json")
		{


			m_OutputStream.open(filepath);
			WriteHeader();
			m_CurrentSession = new InstrumentationSession{

     name };
		}

		void EndSession()
		{


			WriteFooter();
			m_OutputStream.close();
			delete m_CurrentSession;
			m_CurrentSession = nullptr;
			m_ProfileCount = 0;
		}

		void WriteProfile(const ProfileResult& result)
		{


			if (m_ProfileCount++ > 0)
				m_OutputStream << ",";

			std::string name = result.Name;
			std::replace(name.begin(), name.end(), '"', '\'');

			m_OutputStream << "{";
			m_OutputStream << "\"cat\":\"function\",";
			m_OutputStream << "\"dur\":" << (result.End - result.Start) << ',';
			m_OutputStream << "\"name\":\"" << name << "\",";
			m_OutputStream << "\"ph\":\"X\",";
			m_OutputStream << "\"pid\":0,";
			m_OutputStream << "\"tid\":" << result.ThreadID << ",";
			m_OutputStream << "\"ts\":" << result.Start;
			m_OutputStream << "}";

			m_OutputStream.flush();
		}

		void WriteHeader()
		{


			m_OutputStream << "{\"otherData\": {},\"traceEvents\":[";
			m_OutputStream.flush();
		}

		void WriteFooter()
		{


			m_OutputStream << "]}";
			m_OutputStream.flush();
		}

		static Instrumentor& Get()
		{


			static Instrumentor instance;
			return instance;
		}
	};

	class InstrumentationTimer
	{


	public:
		InstrumentationTimer(const char* name)
			: m_Name(name), m_Stopped(false)
		{


			m_StartTimepoint = std::chrono::high_resolution_clock::now();
		}

		~InstrumentationTimer()
		{


			if (!m_Stopped)
				Stop();
		}

		void Stop()
		{


			auto endTimepoint = std::chrono::high_resolution_clock::now();

			long long start = std::chrono::time_point_cast<std::chrono::microseconds>(m_StartTimepoint).time_since_epoch().count();
			long long end = std::chrono::time_point_cast<std::chrono::microseconds>(endTimepoint).time_since_epoch().count();

			uint32_t threadID = std::hash<std::thread::id>{

    }(std::this_thread::get_id());
			Instrumentor::Get().WriteProfile({

     m_Name, start, end, threadID });

			m_Stopped = true;
		}
	private:
		const char* m_Name;
		std::chrono::time_point<std::chrono::high_resolution_clock> m_StartTimepoint;
		bool m_Stopped;
	};
}

#define HZ_PROFILE 1
#if HZ_PROFILE
#define HZ_PROFILE_BEGIN_SESSION(name, filepath) ::Hazel::Instrumentor::Get().BeginSession(name, filepath)
#define HZ_PROFILE_END_SESSION() ::Hazel::Instrumentor::Get().EndSession()
#define HZ_PROFILE_SCOPE(name) ::Hazel::InstrumentationTimer timer##__LINE__(name); // LINE是为了防止重定义变量名
#define HZ_PROFILE_FUNCTION() HZ_PROFILE_SCOPE(__FUNCSIG__)// 函数作用域本身就是scope,只不过是要获取函数名称
#else
#define HZ_PROFILE_BEGIN_SESSION(name, filepath)
#define HZ_PROFILE_END_SESSION()
#define HZ_PROFILE_SCOPE(name)
#define HZ_PROFILE_FUNCTION()
#endif
EntryPoint.h
int main(int argc, char** argv) {


	Hazel::Log::Init();

	HZ_PROFILE_BEGIN_SESSION("Startup", "HazelProfile-Startup.json");
	auto app = Hazel::CreateApplication();
	HZ_PROFILE_END_SESSION();

	HZ_PROFILE_BEGIN_SESSION("Runtime", "HazelProfile-Runtime.json");
	app->Run();
	HZ_PROFILE_END_SESSION();

	HZ_PROFILE_BEGIN_SESSION("Startup", "HazelProfile-Shutdown.json");
	delete app;
	HZ_PROFILE_END_SESSION();
}

Sandbox2D.cpp
void Sandbox2D::OnUpdate(Hazel::Timestep ts)
{


	HZ_PROFILE_FUNCTION();
	{


		HZ_PROFILE_SCOPE("m_CameraController OnUpdate");
		m_CameraController.OnUpdate(ts);
	}

	{


		HZ_PROFILE_SCOPE("Renderer Prep");
		Hazel::RenderCommand::SetClearColor({

     0.1f, 0.1f, 0.1f, 1 });
		Hazel::RenderCommand::Clear();
	}
	{


		HZ_PROFILE_SCOPE("Renderer Draw");
		Hazel::Renderer2D::BeginScene(m_CameraController.GetCamera());
		Hazel::Renderer2D::DrawQuad({

    -1.0f, 0.0f}, {

    0.8f,0.8f}, m_FlatColor);
		Hazel::Renderer2D::DrawQuad({

     0.5f, -0.5f }, {

     0.5f, 0.8f }, {

    0.2f, 0.8f, 0.9f, 1.0f});
		Hazel::Renderer2D::DrawQuad({

     0.0f, 0.0f, -0.1f }, {

     10.0f, 10.0f }, m_SquareTexture);
		Hazel::Renderer2D::EndScene();
	}
}
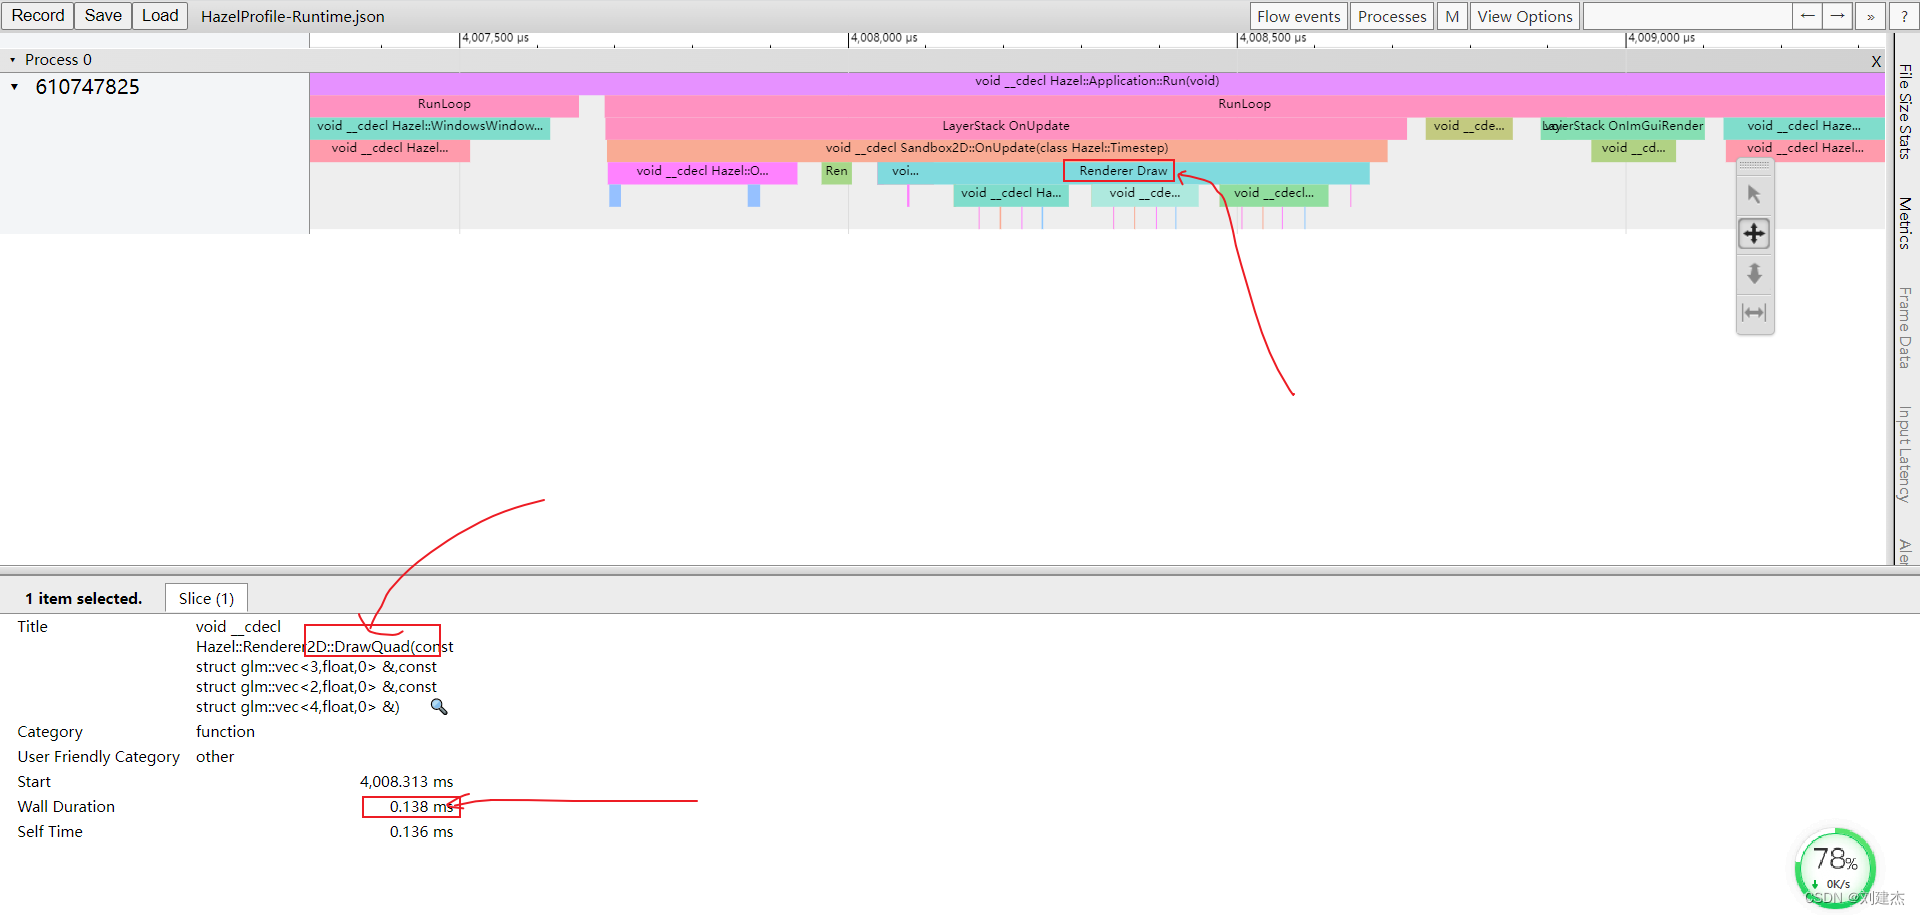
Effect
057 Measure time consumption in every key place
foreword
-
Ideas for this section
I want to have a button in the engine to manually turn on whether to start measuring, and to turn it off manually
In order to avoid running, the writing json file is too large, hundreds of megabytes or even several gigabytes
-
How to achieve
Before that, it is definitely necessary to add measurement codes at the measurement codes, so measurement codes are added in many places.
But this section does not implement the button on and off.
Effect
-
Overall analysis
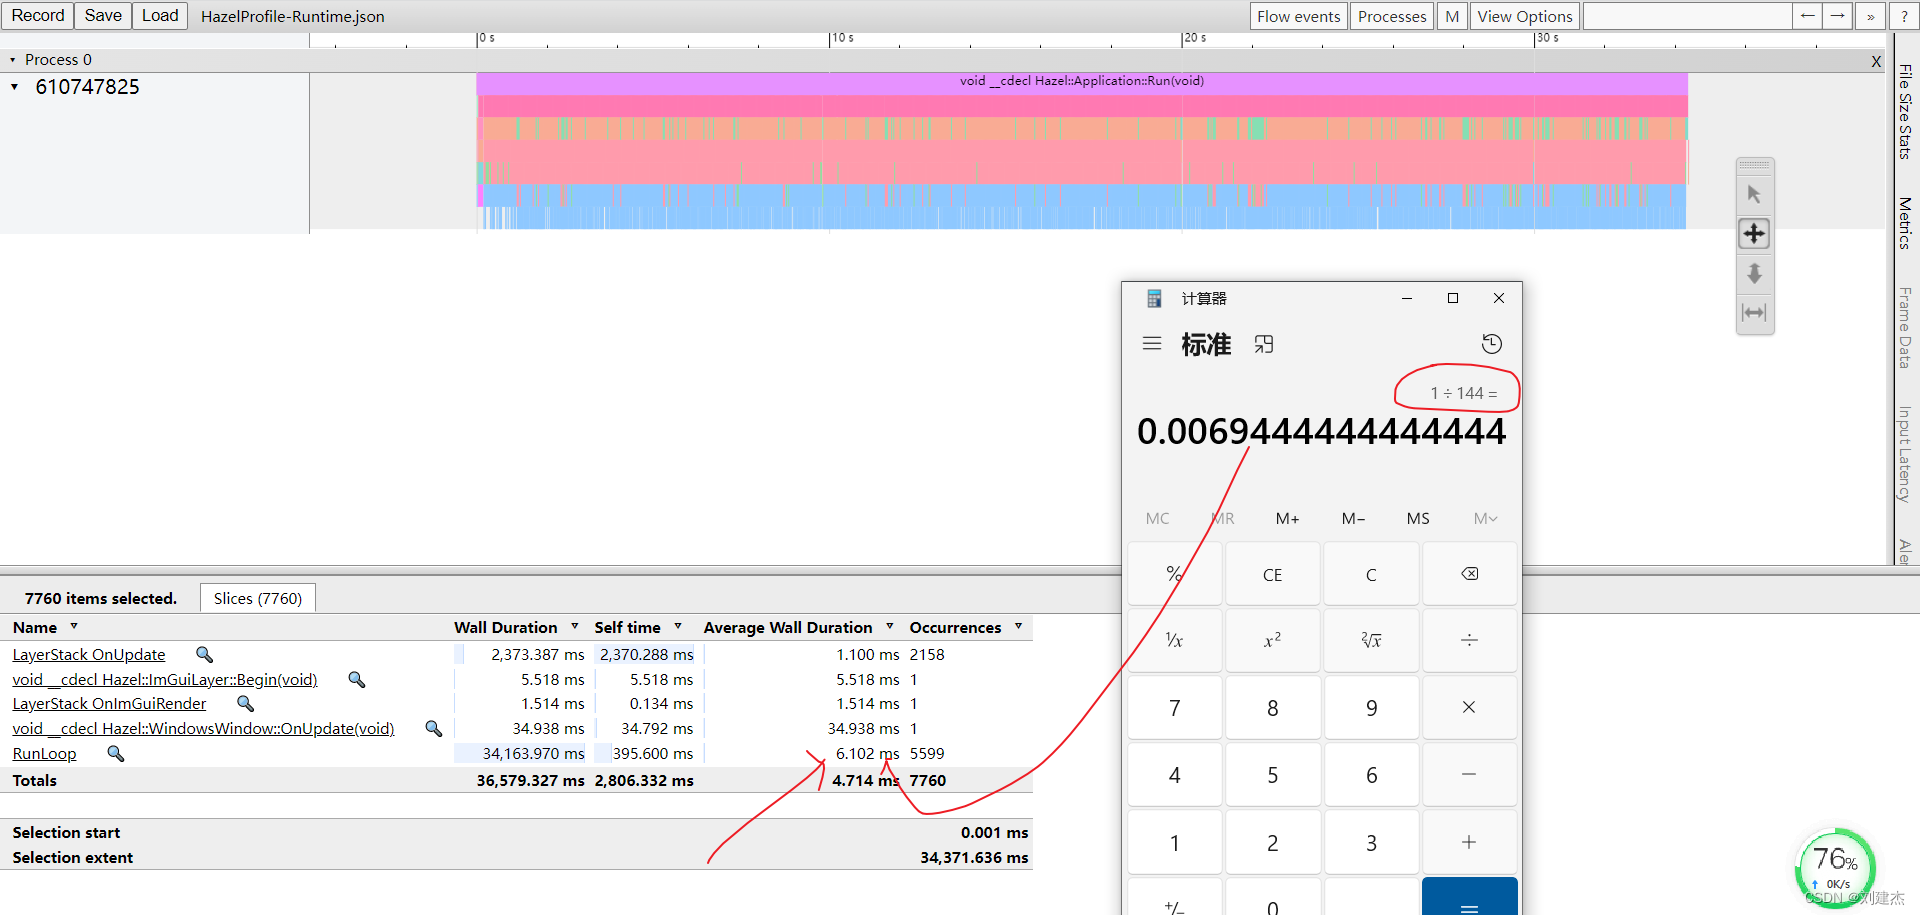
The frame rate of a computer screen can be derived from the average time to render each frame.
1/0.006 ~ 140
-
single analysis