1. Case introduction
In order to study the effect of turmeric on the survival time of hypotonic hypoxic mice, 36 mice were randomly generated into three groups A, B and C, 12 in each group, half male and half female, respectively, 10g/kg, 20g/ kg, 40g/kg three different doses of curcuma were administered orally, and the mice in each group were placed in a 250ml airtight jar with soda lime at the same time, and the survival time of the mice was observed and recorded. I want to study whether the survival time of mice under different doses of turmeric is different (case data source: Yan Hong, Xu Yongyong. Medical Statistics [J]. People's Health Publishing House, 2015.).
2. Problem Analysis
Want to analyze whether there is a difference in the survival time of mice with three different doses of turmeric gavage, the common methods of difference analysis include analysis of variance, t test, chi square test, since "group" is a categorical data, " "Survival time" is quantitative data. Both the independent variable and the dependent variable in the chi-square test need to satisfy the categorical variables, so analysis of variance or t-test is used, and because the categorical data are divided into three groups, namely "Group A", "Group B" and "Group C", generally more than two groups need to use analysis of variance. Therefore, in this example, analysis of variance is used for research. Analysis of variance includes one-way analysis of variance and multi-factor analysis of variance, because there is only one independent variable ("group"), so one-way analysis of variance can be used for research.
3. Software operation and result interpretation
(1) Data import
1. Data format
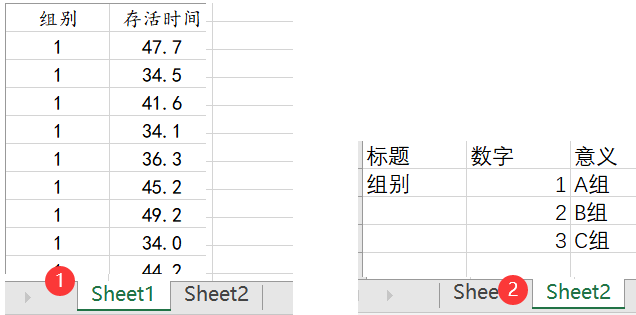
First, organize the data into the correct format. Generally, X is a column and Y is an example. If the analyzed data has data labels, another table needs to be added for explanation. The data format is as follows:
2. Import data
Upload the organized data to the SPSSAU system as follows:

The upload results are as follows:

(2) Judgment of applicable conditions
1. Applicable conditions
First, simply check the data, such as whether there are outliers, etc. The existence of outliers may affect the analysis results, so it needs to be processed before the analysis. In addition, the analysis of variance also needs to satisfy that each population obeys the normal distribution , the variances of the populations are the same (homogeneity of variances is satisfied), and the observations are independent (the example is satisfied). So the following one by one to test outliers, homogeneity of variance and normality.
2. Judgment of applicable conditions
(1) Outliers
Check the outliers in the data. The outliers, as the name implies, are those in the same group that differ greatly from other values (for example, greater than 3 times the standard deviation, etc.). The existence of outliers will make the overall mean and standard deviation inaccurate, and may It will lead to inaccurate analysis of the final results. There are many ways to check outliers, including using descriptive analysis to view the standard deviation for judgment, scatter plots and box plots, etc. The graphical method is more intuitive, so here we use SPSSAU The visualized box plot is described, and the operation is as follows:

The result is as follows:

As can be seen from the results in the figure above, there are no outliers in the data of Group A, Group B, and Group C. So no need to deal with it. Next, test the homogeneity of variance of the data.
(2) Homogeneity of variance
The operation of SPSSAU homogeneity of variance is as follows:

The result is as follows:

It can be seen from the results that the three groups were tested for homogeneity of variance, the final F value was 2.772, and the p value was 0.764 greater than 0.05, which means that the data fluctuations of the three groups are not much different, and they have homogeneity of variance. If the analysis conditions are satisfied, the normality test is carried out next.
(3) Normality test
There are many ways to test normal distribution, including normality test and graphical method pp diagram, qq diagram, etc. Generally, graphical representation is more intuitive, so use a histogram to view it, and the results are as follows:
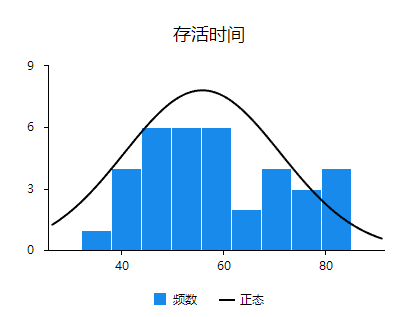
It is found that the "survival time" presents an inverted bell shape, so it meets the normal distribution standard, and the data meets the prerequisites of variance analysis, so one-way analysis of variance can be directly performed.
(3) One-way analysis of variance
- Software operation
After uploading the data, click [General Method] → [Analysis of Variance] and then analyze:

- Interpretation of results
(1) Model results
To analyze whether there is any difference in the survival time of mice given three different doses of turmeric orally, with "group" as the independent variable and "survival time" as the dependent variable, a one-way analysis of variance was carried out. The results are as follows:

It can be seen from the above table that the mean value of group A is 40.08 and the standard deviation is 5.79; the mean value of group B is 52.96 and the standard deviation is 5.01; the mean value of group C is 74.19 and the standard deviation is 6.42. It can be seen that there are differences among the three, and the survival time of mice in group C is relatively longer, and the F value of the one-way variance model is 106.968, and the P value is far less than 0.05, which has a significant difference, which also shows that the three Significant differences exist between. You can also use the graphical method to describe the mean comparison of the three:

It can be seen from the line chart that the average value of "Group C" in the example is the largest, followed by "Group B" and finally "Group A", which means that the survival time of mice in "Group C" is longer, and then "Group B" ’ and finally ‘Group A’. Then according to the one-way analysis of variance to verify that there is a significant difference among the three, how is the specific index calculated?
(2) Index calculation
SPSSAU one-way ANOVA provides intermediate value calculation by default:

01 degrees of freedom
Degree of freedom between groups df1=number of groups-1=3-1=2; degree of freedom within group df2=sample size-number of groups=12*2-3=33;
02 mean square
Between-group mean square = between-group square sum/between-group degrees of freedom df1=7119.994/2=3559.997;
Intra-group mean square = intra-group sum of squares/intra-group degrees of freedom df2=1098.275/33=33.281;
03 F value
F value = mean square between groups / mean square within groups = 3559.997/33.281 = 106.968;
04 p-value
The F value is a statistic, and the p value is calculated by combining the F value and degrees of freedom.
4. Conclusion
Through the one-way analysis of variance of the experimental data, it is found whether there is a difference in the survival time of the mice among the three groups. Combining the results of the one-way analysis of variance and the line graph, it is found that the survival time of the "group C" mice is the longest, which means that the turmeric It has an impact on the survival time of hypotonic hypoxic mice, and in the experiment, the survival time of mice with 40g/kg turmeric dose is longer than that of 10g/kg turmeric dose and 20g/kg turmeric dose. Next is the survival time of 20g/kg turmeric dose mice, and finally is the survival time of 10g/kg turmeric dose decimals.
5. Knowledge Tips
1. What to do when the variance is not uniform?
When the variance is not homogeneous, you can use 'non-parametric test', and you can also use welch variance, or Brown-Forsythe variance. The non-parametric test is to avoid the problem of homogeneity of variance; while welch variance or Brown-Forsythe variance is directly facing the variance of homogeneity, even in When the variance is uneven, the results are guaranteed to be relatively stable. The Welch variance and the Brown-Forsythe variance are only inconsistent in the calculation formula. The purpose of both is to make the results stable when the variance is uneven. Just choose one of them.
2. Does ANOVA need to satisfy normality?
Theoretically speaking, there are two prerequisites for variance analysis, one is that the dependent variable Y needs to meet the normality requirement, and the other is that the variance homogeneity test is satisfied. If not, you can use [General Method->Nonparametric Test] to study the difference at this time. It is also mentioned in the literature that the data can be converted to make it closer to or in line with normality, and then continue to use variance analysis. Users can try to perform data conversion [data processing -> generate variables] function, usually for example to find the data Number, root number and other processing. The theoretical normal distribution does not exist, and the data close to the normal distribution is more in line with the actual situation, so the data close to the normal distribution can be directly analyzed by variance analysis.